
Translate this page into:
Modelling the spread of SARS-CoV-2 pandemic - Is this even close to a supermodel?
*For correspondence: somdattasinha@gmail.com
-
Received: ,
This is an open access journal, and articles are distributed under the terms of the Creative Commons Attribution-NonCommercial-ShareAlike 4.0 License, which allows others to remix, tweak, and build upon the work non-commercially, as long as appropriate credit is given and the new creations are licensed under the identical terms.
This article was originally published by Wolters Kluwer - Medknow and was migrated to Scientific Scholar after the change of Publisher.
Sir,
I read with interest the article on modelling the spread of SARS-CoV-2 pandemic published recently1. I am writing to convey my concerns with the model proposed in this article. In view of my concerns about the model, I also cannot agree with the quantitative inferences of the model, which has been widely mentioned as a 'supermodel' from India.
The authors must be aware of the earlier models proposed for modelling coronavirus disease 2019 (COVID-19), where the presence of asymptomatic infected have been explicitly considered. Therefore, the inclusion of the A component per se, in the proposed model is not new. Further, the extensive changes in parameters done in this study, without proper mathematical analysis or biological reasoning, is risky in terms of prediction and evaluation of goodness-of-fit, unless the parameters and initial condition dependence of the model, with respect to its robustness, are investigated. Such modelling exercises are often tantamount to back-fitting of the data to the model. Further, the data used in this study are also of heterogeneous nature [subject to error due to under-reporting, high variability in testing across the country and mixing of data with different sensitivities (reverse transcription-polymerase chain reaction and rapid antigen testing), etc.], and therefore, reliability is also highly variable.
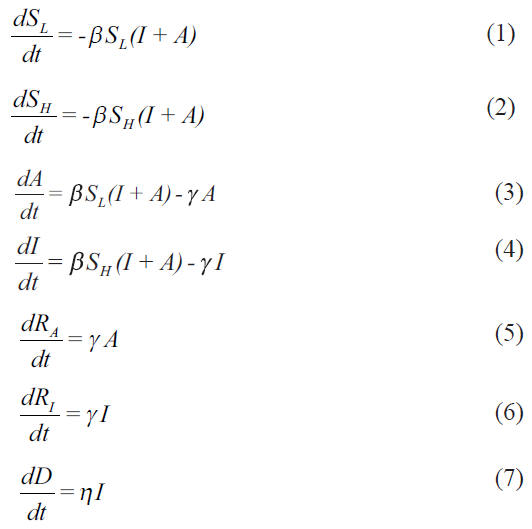
My primary concerns are with the framing of the model, whose equations are reproduced below:
My objections and concerns are listed below:
-
There are a few standard ways of framing epidemiological compartment models. The different types of compartmental models [SIR (susceptible-infected-recovered), SEIR (susceptible-exposed-infected-recovered), SIRS (susceptible-infected-recovered-susceptible)] are structurally and mathematically different from each other. The interactions among the compartments (based on the disease biology) are such that it is not possible to simply add the compartments (and the evolution equations) and reduce it to another type. Hence, an SEIR model is structurally different from an SIR or SIRS models. Thus one should not be able to reduce a properly framed SAIR (susceptible-asymptomatic-infected-recovered) model to an SIR model, because of the underlying interaction structure of the compartments (through parameters and interaction terms). This SAIR model used by Agrawal et al1 is just the opposite. There is no difference in A and I equations. This means that one can keep dividing the susceptible and infected compartments into as many compartments as one wants - may be pre-symptomatic, asymptomatic with no symptoms, with low symptoms, with headache, showing long COVID-19 symptoms, etc. and then add them to say that it essentially is a SIR model (https://www.iith.ac.in/~m_vidyasagar/arXiv/Super-Model.pdf). This is not epidemiological compartment modelling, and certainly not developing a new SAIR model. This model can easily be reduced to two parallel SIR (SL-A-RA and SH-I-RI) models. So it is an improperly framed model.
-
Equations (1) and (2) are structurally the same. If SH (0)=0.499 (say), SL (0)=0.500, and I=0.001, then both the subgroups of S evolve exactly in the same manner, and essentially follow the same trajectory. Since these are simply population fractions, the equations with subdivisions make no sense. Similarly, it is not understood how, with the same parameters (beta, gamma), the A and I evolution equations (Equations (3) and (4)) are different. As mentioned above, for the same SL (0) and SH (0), the trajectory of equations (1) and (2) are the same, and so are equations (3) and (4). Then mathematically, there is no difference in these two variables. What is the advantage in having separate compartments then? What kind of SAIR model is this? Thus, these equations are both unrealistic and mathematically ill-framed.
-
Of the two variables, A and I, A is not easily measurable, and so total I+A is not known. It may be possible to consider a fraction of A (asymptomatic and/or pre-symptomatic), be converted to I, depending on how the viral load increases in the body (about which not much is known). This leads to interaction between the A and I compartments, which can then lead to a SAIR model different from a simple SIR model. Similar objections can be raised for equations (5) and (6). Given the rapidly evolving behaviour of SARS-CoV-2 (including changes in the types and mutations in the genome sequences in India) and the increasing experimental literature on reinfection and/or relapse cases, it will be pertinent to consider a SIRS (or variations thereof) model as part of the so-called Supermodel for the future relevance.
-
From the available biological information, dividing the susceptible population to SL and SH is inappropriate. The reason given is “the physiology of the person (immunity level, genetic disposition, comorbidities, etc.)”1. Till date, none of these individual traits has been shown to determine if the infected individual will be A or I. Furthermore, asymptomatic has not been defined clearly, even though the inclusion of asymptomatics (A) is what makes this model 'new'. It is to be noted that an asymptomatic is one without symptoms, but the presence or absence of symptoms depends on what symptoms one is looking for. Existence of pre-symptomatic individuals, with no or very little symptoms, is known (who never inform and therefore, not tested), who finally may or may not convert to a fully symptomatic case (I). An important factor that has been ignored is age because the epidemiology of SARS-CoV-2 infection and its outcome has been shown to be age-dependent23. For including individual traits and their effect on infection spread, the agent-based models are more appropriate, and there have been a few around4.
-
The most confusing parameter is epsilon, which has been used extensively for data-fitting. The definition of epsilon varies in the different versions of the model. The expanded model (in Supermodel.pdf) defines it as: epsilon=SH (0)/S(0). Which means that epsilon depends on the initial value for equation (2). Therefore, its change with time in a particular region (with a particular population size) in different phases (which are contiguous in time) does not arise. However, in this paper “the parameter ε measures the ratio between infected symptomatic and asymptomatic patient populations”1. That means, ε=I/A. In this case, the parameter epsilon should change with time. But the authors write, “In principle, the parameter ε should not change as the ratio of infected and asymptomatic remains constant in the model”1. There are evolution equations for both A and I, and there is no conservation of numbers of (I+A) with time. So why is the parameter ε expected to remain constant in the model? The only reason for changing epsilon, with no apparent scientific basis in the same population, seems to fit the data. If this parameter is incorporated in the model equations, then one can track it mathematically. With no existing references or a technical way to track epsilon, the results are difficult to justify.
-
Identification of the phases of the epidemic is another contentious issue. The authors have stated that “these were obtained by identifying the dates on which the value of ε increased significantly”1. Sometimes it is 25 days, 45 days, etc. In view of what is stated in para 5 above, these seem unreasonable and have been possibly done for back-fitting the data. The role of migration, if included, should change both S, A and I at a particular time point, and not S alone.
The following points are my additional concerns and related queries/suggestions:
-
Let us consider that gamma is the rate of exiting the compartments A and I. Then gamma for I includes both recovery and death, and the same parameter is only for the recovery rate for A. In such a case how is eta an independent parameter? Should not the propensity of death from I individuals only be a fixed fraction of gamma?
-
Given the above, and with no explicit sink term (-eta*I) included in equation 4, the evolution equation for D is not correct. What is the source of D in equation 7 if (-eta* I) is absent in equation 4? But then, if the mortality term is included in equation (4) for correcting it, then is the conservation expression i.e. SL+SH+A+I+RA+RI=1 valid?
-
An important problem with this model and its treatment for data fitting is in the calculation of the R0 (basic reproductive rate), which is simply considered to be beta/gamma. With the given values of beta and gamma in [Table 1], the paper yields erratic values of R0 at different phases. Since population size and sizes of S sub-compartments at t=0 are considered to be very important (through the parameter epsilon), it is imperative that the authors consider the values of 'effective reproduction number (Reff)', and not R0, at different phases. In addition, R0=beta/gamma is true only for the simple SIR model. For other type of compartment models, it will be different. The authors need to check the relevant papers regarding this.
-
The absence of any wire (transition) diagram of the compartment conversions, that clearly depict interactions among the compartments in an epidemiological model, is baffling. It is the first step to visualize any disease progression kinetics in a model population
-
It is known to those from non-linear dynamics, that small variations in the initial condition of model variables may exhibit different final trajectories based on the basin boundaries of the fixed points and with chaotic dynamics. It is not clear (and not mentioned) whether this property is true with the proposed model. Therefore, how can one distinguish between two variables that have the same evolution equations and parameters?
-
The concerns about the parameters estimation methods are not being detailed. It is an important issue, as different methods have different pros/cons, and these can be manipulated easily to fit anything. One expects some references on parameter estimation methods used in the study. In any case, later data5 have already shown that the model predictions are not correct.
-
During an epidemic/pandemic, since it is rare to obtain data that are complete, it is standard to account for under-reporting in data. The present study essentially assumes that the data set under analysis is ideal, i.e. reported cases and number of cases are the same. In India (and other countries), a comparison of serology and case data shows that most seropositive individuals were never reported as cases67. Hence, by failing to account for under-reporting, the model parameters and results from the model are likely to be biased. The authors should include these critical considerations, and also study the robustness of the model.
Given that there are many models in the literature now, we expected a reasonably good, biologically relevant, and mathematically correct model from the national committee.
Financial support & sponsorship: None.
Conflicts of Interest: The views expressed in this letter are personal and do not represent that of the affiliated organization.
References
- Modelling the spread of SARS-CoV-2 pandemic - Impact of lockdowns & interventions. Indian J Med Res 2020 doi: 10.4103/ijmr.IJMR_4051_20
- [Google Scholar]
- Epidemiology and transmission dynamics of COVID-19 in two Indian states. Science. 2020;370:691-7.
- [Google Scholar]
- Impact of non-pharmaceutical interventions (NPIs) to reduce COVID-19 mortality and healthcare demand. London: Imperial College London; 2020.
- [Google Scholar]
- COVID-ABS: An agent-based model of COVID-19 epidemic to simulate health and economic effects of social distancing interventions. Chaos Solitons Fractals. 2020;139:110088.
- [Google Scholar]
- Available from: https://www.covid19india.org/
- Prevalence of SARS-CoV-2 infection in India: Findings from the national serosurvey, May-June 2020. Indian J Med Res. 2020;152:48-60.
- [Google Scholar]
- Seroprevalence of novel coronavirus disease (COVID-19) in Kobe, Japan. medRxiv 2020 doi: 10.1101/2020.04.26.20079822
- [Google Scholar]


