
Translate this page into:
Comparative performance of verbal autopsy methods in identifying causes of adult mortality: A case study in India
For correspondence: Dr Rajesh Kumar, School of Public Health, Post Graduate Institute of Medical Education & Research, Chandigarh 160 012, India e-mail: dr.rajeshkumar@gmail.com
-
Received: ,
This article was originally published by Wolters Kluwer - Medknow and was migrated to Scientific Scholar after the change of Publisher.
Abstract
Background & objectives:
Cause of death assignment from verbal autopsy (VA) questionnaires is conventionally accomplished through physician review. However, since recently, computer softwares have been developed to assign the cause of death. The present study evaluated the performance of computer software in assigning the cause of death from the VA, as compared to physician review.
Methods:
VA of 600 adult deaths was conducted using open- and close-ended questionnaires in Nandpur Kalour Block of Punjab, India. Entire VA forms were used by two physicians independently to assign the cause of death using the International Statistical Classification of Diseases and Related Health Problems (ICD)-10 codes. In case of disagreement between them, reconciliation was done, and in cases of persistent disagreements finally, adjudication was done by a third physician. InterVA-4-generated causes from close-ended questionnaires were compared using Kappa statistics with causes assigned by physicians using a questionnaire having both open- and close-ended questions. At the population level, Cause-Specific Mortality Fraction (CSMF) accuracy and P-value from McNemar’s paired Chi-square were calculated. CSMF accuracy indicates the absolute deviation of a set of proportions of causes of death out of the total number of deaths between the two methods.
Results:
The overall agreement between InterVA-4 and physician coding was ‘fair’ (κ=0.42; 95% confidence interval 0.38, 0.46). CSMF accuracy was found to be 0.71. The differences in proportions from the two methods were statistically different as per McNemar’s paired Chi-square test for ischaemic heart diseases, liver cirrhosis and maternal deaths.
Interpretation & conclusions:
In comparison to physicians, assignment of causes of death by InterVA- 4 was only ‘fair’. Hence, it may be appropriate to continue with physician review as the optimal option available in the current scenario.
Keywords
Adult mortality
causes of death
computer-coded verbal autopsy methods
InterVA-4
physician coding of death
verbal autopsy

Mortality statistics from the civil registration system (CRS) are essential primary inputs for epidemiology and public health. More than four decades have elapsed since the introduction of compulsory registration of vital events in India under the Registration of Births and Deaths Act of 1969 (RBD Act 1969)1, yet reliable mortality statistics, especially on causes of death are not available2. Every year out of an estimated 8.3 million deaths in India, only 6.14 million (74.3%) are recorded in the national CRS3.
The coverage and quality of causes of death under the Medical Certification of Causes of Death Scheme mandated by the RBD Act 1969 is also limited. In 2014, only 1.06 million deaths (12.9%) were certified by physicians for the cause of death4. In the absence of a well-functioning CRS, the national Sample Registration System (SRS) started using an alternate method to medical certification known as ‘verbal autopsy’ (VA), to provide information on causes of death5. However, owing to insufficient sample size, the SRS cannot provide causes of death for local decision-making at block, district and even State levels.
Verbal autopsy is a method of collecting information on signs and symptoms of the terminal illness as described by relatives of the deceased to trained interviewers6. VA questionnaires commonly include an open-ended or narrative-based section combined with a set of close-ended or structured questions78910. Conventionally, data collected by these questionnaires are analysed by physicians to assign a medical cause of death. More recently, computer diagnostic programmes have been developed to assign causes of death from VA.
In the current environment, computerized diagnostic approaches for ascertaining causes of death are seen as advantageous in terms of efficiency, consistency, timeliness and low costs. Hence, it is important to compare the results from such computerized approaches with the results from the conventional physician review mode, to inform decisions regarding the use of one approach over the other11. Several studies have been conducted to compare the performance between the two causes of death assignment methods, but have shown conflicting results12. For instance, Murray et al13 conducted a retrospective study to compare five computer methods, i.e. simple symptom, tariff, random forest, InterVA and King-Lu, and physician cause of death assignment. They found that simple symptom pattern, random forest, and tariff method performed better with Cause-Specific Mortality Fraction (CSMF) accuracy more than 0.8 as compared to the physician assigned COD at both individual as well as population level. However, Desai et al14 concluded that only the King-Lu method performed better (with CSMF accuracy 0.9) out of the five computer methods in comparison to physician-assigned COD.
Hence, the present study was planned with the objective to assess the performance of computer-coded verbal autopsy (CCVA) in assigning the cause of death in the Indian context in comparison to physician review.
Material & Methods
Study setting and sampling plan: This community-based cross-sectional study was carried out in Nandpur Kalour, Community Development Block of District Fatehgarh Sahib in Punjab, India, between December 2012 to Jan 201715. Nandpur Kalour Block is the field area of the Department of Community Medicine, School of Public Health (SPH), Post Graduate Institute of Medical Education & Research (PGIMER), Chandigarh, India. Hence, the VAs were planned according to the field activities of the SPH after obtaining protocol approval from the Institutional Ethical Committee. The total population of this block was 0.2 million in the 2011 census, of which 59 per cent people were residing in rural areas in 172 villages (25 sub-centres)15. About 64 per cent of the population was 20 yr and above (83,621). As per the estimated crude death rate of rural Punjab (7.5 deaths per 1000 mid-year population) and the proportion of the deaths (68%) in the adult age group (20 yr and above), it was estimated that about 660 adult deaths will be available in the study block for this study.
Adults aged 20 yr and above residing in the study area for more than six months were included in the study. The sample size requirement for the assessment of the agreement of different cause of death assignment methods (using Cohen’s kappa coefficient of 0.7) within tolerable margins of the 95 per cent confidence interval (CI) and at 80 per cent power was estimated to be 51 deaths. A total sample size of 600 adult deaths (aged 20 yr and above), as in our study population, would be adequate to yield at least 50 adult deaths in each of the leading (6–8) causes of death as per the proportionate distribution of leading causes of death in Punjab from the SRS data for 20035. Hence, it was anticipated that this study would yield comparative performance measures between the different COD assignment methods for the major leading causes of death in rural Punjab.
Data collection: A semi-structured (combination of open- and close-ended questions) adult verbal autopsy tool developed by the School of Public Health, PGIMER, Chandigarh was used, the concurrent validity of which had already been established in a previous study7. The questionnaire was modified to be compatible with the most recent version of VA questionnaires published by the World Health Organization in 2016 and includes all the variables required by the Inter VA computer method Version 4.0 to assign causes of death. The reliability of the questionnaire in regard to eliciting responses was established by the test–retest method in 20 adult deaths. The questionnaire was translated to Hindi and Punjabi and back-translated into English. Pre-testing was done in 60 adult deaths. Necessary changes were made after pre-testing and the tool was finalized.
Key informants of the village (including the Accredited Social Health Activist, Auxiliary Nurse Midwife, Anganwadi Worker; Village Head, School Teacher, among others) provided the information about the occurrence of deaths in the community. Only deaths which had occurred within the past one year from the date of interview in the age group of 20 yr and above were selected for the study. Key informants also helped in approaching the person who was with the deceased during the last stage of life. A total of 602 households were approached for the interview. Field interviews were conducted by the primary author, who received specific training for conducting VA using training materials developed for the Indian SRS. VAs could not be done in two houses due to the non-availability of respondents because of migration of the family members after the death of the deceased. The interview was conducted after taking written informed consent from the caretaker who was with the deceased before death. The average duration of each interview was 30-45 minutes.
The quality of the collected data was rechecked by randomly choosing 10 per cent of the total 600 VAs for conducting repeat VAs again by using the same questionnaire, and noting the accuracy of all responses in the resampled questionnaires.
Data processing: All completed VAs were processed by the two CoD diagnostic procedures being compared in this study. For the physician review process, completed paper questionnaires were reviewed with the assignment of underlying CoD. For the computer coding process, all variables from the questionnaires were entered in customized SPSS-23 software for coding by the InterVA programme, and subsequent descriptive and comparative analysis.
Physician coding of verbal autopsy: Five community physicians located in Chandigarh received training for assigning underlying causes of death according to the procedures used in the Indian SRS16. Each completed semi-structured VA questionnaire was reviewed independently by two trained community physicians, who each assigned an underlying CoD. In case where both the physicians assigned the same cause, that cause was taken as the final CoD. In cases where the two physicians assigned different causes, ‘reconciliation’ was used to recode the same form, after discussion between the two physicians. If the difference persisted, then a third senior community physician independently reviewed the VA form to assign the final underlying CoD. This process was called ‘adjudication’. The final underlying cause from physician review (after matching/reconciliation/adjudication) for each death was assigned specific three character codes from the International Classification of Diseases and Health-Related Problems, Tenth Revision (ICD-10)17, and subsequently added to the electronic SPSS dataset for further analysis.
Computer coding of VA: InterVA was used because this method was available in the public domain and version 4 was its latest model available during the study period. InterVA-4 is based on the principle of assigning ‘apriori’ probabilities to symptoms and signs to arrive at the CoD and is claimed to be similar to the physician-coded VA method where physicians use guidelines to assign the CoD18. The complete SPSS electronic data file including all variables for each death was processed using the InterVA software, which assigned the computer-coded underlying cause for each death.
The InterVA programme assigned causes according to 70 categories as listed in the InterVA-4 user guide. These 70 cause categories were mapped onto the complete ICD-10 classification, resulting in a corresponding set of several ICD-10 three character codes for each cause category in the InterVA list. This was in contrast to the physician review process, which assigned specific ICD-10 three character codes to the underlying cause for each death, such that these specific codes could subsequently be aggregated according to any categorization format for summary or comparative analysis.
Statistical analysis: Descriptive analysis was done to describe the socio-demographic profile of the deceased in terms of age, sex, marital status, education and occupation, along with information on personal habits of smoking, tobacco and alcohol consumption and past medical history. For summarizing the age distribution of the deceased, median along with interquartile range (IQR) was calculated.
For descriptive analysis of the physician assigned CoD, the assigned three character codes were first aggregated according to the WHO Mortality List19. Subsequently, to enable comparison with outputs from the InterVA programme, the physician assigned three character codes that were also aggregated to the categories of causes as per the InterVA list.
Comparative assessment of the InterVA-4 generated causes and physician coding of VA questionnaire was done at the individual level using kappa statistics along with its 95 per cent CI. The comparison of the two processes at the population level was assessed through calculating the statistical difference between CSMFs from each process, using the McNemar’s paired Chi-square test to test the significance of any observed differences. Furthermore, at the population level, CSMF accuracy was calculated to determine how accurately CSMFs are estimated at a population level by a CCVA method. It adjusted for a correct diagnosis made by chance1618. CSMF accuracy is an index to indicate the absolute deviation of a set of proportions of causes of death out of the total number of deaths between the two methods. The value of one indicates perfect agreement, and the value of zero meaning as far apart as possible.
CSMF accuracy
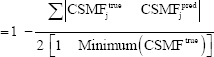
where, j= CoD (cause of death), CSMFjtrue= CSMF estimated by the physician for the CoDj, CSMFjpred= CSMF estimated by CCVA for the CoDj, and minimum (CSMFjtrue)= CSMF value for the cause having minimum CSMF out of all causes estimated by the physician.
Results
Out of all respondents, 71 per cent were female and rest 29 per cent were male. The relationship of deceased to respondents was: in-laws (57%), spouse (17.5%), parents (15.2%), son/daughter (7.7%) and family friends and neighbours (2.6%). Of the 600 deceased, 60 per cent aged more than 60 yr with male predominance (56.8%), 65.2 per cent were illiterate and only 27 per cent individuals were educated up to matriculation. These socio-demographic characteristics are described in detail elsewhere describing the social causes leading to adult deaths20.
The past medical history of the deceased showed that 279 (46.5%) had high blood pressure, 88 (14.7%) were diabetic and heart disease was reported among 66 (11%) while 63 (11%) had respiratory problems like asthma or chronic respiratory disease. A history of tuberculosis was reported among 16 (2.7%) while 47 (7.8%) had a history of diagnosed cancer. Epilepsy was reported in 9 (1.5%) and dementia was reported among 5 (0.8%) cases. Only one individual had a known history of HIV/AIDS.
While coding individually, the disagreement rate was 36 per cent among two physicians. Our study facilitated a programme of direct in-person discussion and reconciliation between two physicians in cases of disagreement, which resulted in successful reconciliation of diagnosis in almost all cases. Differences still persisted in only 0.1 per cent of the VAs, which were settled by the third senior community physician.
Table I shows the comparative distributions of leading CoD from the physician review certification and coding process and the InterVA software, among adults.
| Physician assigned CoD (as per WHO mortality list) | ICD 10 code | Percentage (n=600) | Inter VA-4 assigned CoD (as per interVA list) | ICD 10 code | Percentage (n=600) |
|---|---|---|---|---|---|
| Cerebrovascular diseases | I60-I69 | 15.5 | Stroke | 60-I69 | 15.5 |
| Ischaemic heart diseases | I20-I25 | 11.8 | Acute cardiac disease | I20-I25 | 7.5 |
| Diseases of the liver | K70-K76 | 5.0 | Other and unspecified cardiac diseases | I00-I09; I10-I15; I26-I52; I70-I99 | 5.2 |
| Chronic lower respiratory diseases | J40-J47 | 4.7 | Liver cirrhosis | K70-K76 | 2.0 |
| Other genitourinary diseases | N17-N98 | 4.2 | Chronic obstructive pulmonary diseases | J40-J44 | 4.8 |
| Transport accidents | V01-V99 | 3.7 | Road traffic accident | V01-V89 | 3.7 |
| Other heart diseases | I26-I51 | 3.5 | Renal failure | N17-N19 | 2.3 |
| All other external causes | * | 3.2 | Digestive neoplasms | C15-C26 | 3.5 |
| Pneumonia | J12-J18 | 3.2 | Acute respiratory infection, including pneumonia | J00-J22 | 4.7 |
| Falls | W00-W19 | 2.8 | Accidental fall | W00-W19 | 3.3 |
| Symptoms and ill-defined conditions | R00-R99 | 13.5 | Other and unspecified NCD | ** | 15.8 |
* S00-T99; W20-W64; W75-W99; X50-X59; Y10-Y98; D65-89; E00-E07; E15-35; E50-90; F00-F99; G06-09; G10-37; G40-41; G50-99; H00-95; J30-39; J47-99; K00-31; K35-38; K40-93; L00-99; M00-99; N00-16; N20-99; ** R00-09; R11-94; Q00-99. VA, verbal autopsy; WHO, World Health Organization, NCD, non-communicable diseases; ICD, International Classification of Diseases
There are several important differences between both the rank order as well as the magnitude of several causes across the two CoD assignment processes. While the proportion of deaths from cerebrovascular disease (labelled ‘stroke’ in the InterVA list) from the two processes is almost similar for both males and females, the proportion from ischaemic heart disease from the physician assignment is about 80 per cent higher than the InterVA assignment (labelled ‘acute cardiac disease’) for males, and 60 per cent higher for females (data not shown). Similarly, in males, deaths from liver diseases, renal failure and road traffic accidents, are higher from physician assignment, and conversely, deaths from chronic obstructive pulmonary disease, tuberculosis, pneumonia and ‘intentional self-harm’ (suicide) are assigned in higher proportions by the InterVA programme, as compared to the physician assignment. Another important feature of the InterVA CoD assignment is the considerably high proportions of deaths classified into ‘other and unspecified cardiac diseases’, in both males and females. Such high assignment to this category limits the public health utility of CoD data from the InterVA programme.
From another perspective, the CoD categorization scheme used by the InterVA programme limits the potential to compare proportions with the physician-coded data. For instance, the ‘Ill-defined causes’ category in the InterVA only included codes R95-R99, whereas this category included codes R00-R99 in the physician-coded data. In the InterVA programme, codes R00-R94 were included in the category ‘Other and unspecified non-communicable diseases’. It is not possible to separate deaths assigned codes R00-R94 from the InterVA dataset since the assignment process directly codes deaths to the overall category of ‘other and unspecified non-communicable diseases’, rather than specific ICD codes. As a result, although the overall comparison of deaths coded to the ICD category of ill-defined causes (R00-R99) is not possible, it is likely that the proportions in this category from the InterVA data were higher than that reported according to its classification list. There were minor differences in the ICD codes included in either classification for several other cause categories, e.g. pneumonia, chronic lower/obstructive pulmonary diseases, and ‘other heart diseases’; but these differences are less likely to distort the observed cause-specific mortality patterns.
To achieve comparability at least for some of the important specific causes of death, the physician-coded deaths were aggregated to the ICD code groupings used by the InterVA programme. At first, the agreement between the two processes was assessed using the kappa statistic (Figure). The comparison was conducted for the entire sample without gender disaggregation, to augment the sample size for comparative analysis. For the entire sample, there was only ‘fair’ agreement between InterVA-4 and physician-coded VA with kappa statistics of 0.42 (95% CI 0.38-0.46). However, for injuries, the kappa statistics was ‘excellent’ [κ=1 (95% CI 0.92-1.08)] followed by ‘fair to good’ agreement in case of stroke [0.7 (95% CI 0.67-0.72)], tuberculosis [0.6 (95% CI 0.51-0.61)], acute cardiac diseases [0.5 (95% CI 0.46-0.52)], and chronic respiratory diseases [0.5 (95% CI 0.46-0.54)]. For all other important causes including liver cirrhosis [0.3 (95% CI 0.28-0.34)], renal failure [0.2 (95% CI 0.19-0.23)], diabetes [0.16 (95% CI 0.15-0.17)], and maternal deaths [0.2 (95% CI 0.18-0.26)] among others, the agreement was ‘poor’, i.e. <0.4, as shown in the Figure.

- Cohen’s kappa values for individual causes between InterVA- 4 and physicians among adult deaths.
A comparison of the leading specific causes of death using directly comparable ICD codes as per the InterVA List is shown in Table II. At the population level, CSMF accuracy from the InterVA programme was found to be 0.71 as compared to the physician cause assignment (data not shown), which implies that if the physician assignment was considered as the reference standard, then at the population level, the InterVA-4 programme would correctly predict the cause-specific mortality fraction for each cause in only 71 per cent cases by InterVA-4. As can be seen from Table II, although stroke was the leading CoD from both methods in identical proportions, the differences in proportions from the two methods were statistically different as per McNemar’s paired Chi-square test for several important causes including acute cardiac diseases (ischaemic heart diseases), liver cirrhosis, tuberculosis and maternal deaths.
| ICD-10 code | Causes of death | Physician causes (n=600), n (%) | InterVA causes (n=600), n (%) | P |
|---|---|---|---|---|
| I60-I69 | Stroke | 93 (15.5) | 93 (15.5) | 0.88 |
| I20-I25 | Acute cardiac diseases | 71 (11.8) | 45 (7.5) | <0.05 |
| K70-K76 | Cirrhosis | 30 (5.0) | 12 (2.0) | <0.05 |
| J40-J46 | COPD | 28 (4.7) | 29 (4.8) | 1.00 |
| V00-V89, V90-V99 | Road traffic accidents | 22 (3.7) | 22 (3.7) | 0.72 |
| N17-N19 | Renal failure | 21 (3.5) | 14 (2.3) | 0.25 |
| J00-J22 | Pneumonia | 19 (3.2) | 28 (4.7) | 0.12 |
| W00-W19 | Falls | 17 (2.8) | 20 (3.3) | 0.34 |
| A15-A16 | Tuberculosis | 15 (2.5) | 30 (5) | <0.05 |
| X60-X84 | Intentional self-harm | 14 (2.3) | 16 (2.7) | 0.68 |
| E10-E14 | Diabetes | 7 (1.7) | 15 (2.5) | 0.32 |
| A00-A09 | Diarrhoea | 9 (1.5) | 4 (0.7) | 0.23 |
| O00-O99 | Maternal deaths | 1 (0.2) | 8 (1.3) | <0.05 |
| B20-B24 | HIV | 1 (0.2) | 7 (1.2) | <0.05 |
COPD, chronic obstructive pulmonary disease; HIV, human immunodeficiency virus
Finally, the concordance and disagreement patterns between the two CoD assignment processes were examined using a matrix format, as shown in Table III. Overall, there was a considerably higher pattern of assignment of neoplasms, acute cardiac diseases and liver cirrhosis by physicians, comprising assignments from a wide range of InterVA assigned causes for the same deaths. Similarly, a large number of deaths assigned to ‘other cardiovascular diseases’ by the InterVA programme were assigned to a wide range of specific causes by the physicians, including infectious diseases, neoplasms, pneumonia, chronic obstructive pulmonary disease, liver cirrhosis and renal failure, in addition to specific cardiovascular diseases such as stroke and ischaemic heart disease. This disagreement pattern needs further investigation to study the actual symptom complex responses in the VA questionnaires, which justify and support either of the two different causes for the same death, as assigned by the two programmes. A similar interesting pattern of disagreement in cause assignment was observed in the category ‘other non-communicable diseases’ but in this instance, there was a large assignment to this category by the physician certifiers. A closer examination of the data identified the source of this discrepancy to the inclusion of ICD codes R00-R94 (which actually represent ill-defined causes) within the category of ‘other non-communicable diseases, in the InterVA list. A total of 68 deaths (of the 103 deaths classified under this category) had been assigned codes from R00-R94 by the physicians, and these should have actually been included in the ‘ill-defined causes’ category, which only had 15 deaths, as per the InterVA classification. So, the InterVA classification list includes deaths which actually have ill-defined causes into the category of non-communicable diseases, and this had implications on the overall interpretation of the CoD patterns reported by the InterVA programme.
| CoD source Inter VA | PCVA | |||||||||||||||||
|---|---|---|---|---|---|---|---|---|---|---|---|---|---|---|---|---|---|---|
| Diarrhoea | TB | HIV | Other infections | Neoplasms | Nutritional/endocrine disorders | Acute cardiac diseases | Stroke | Other CVD | Pneumonia | COPD | Liver cirrhosis | Renal failure | Other NCDs | Ill defined | Maternal deaths | All injuries | Total | |
| Diarrhoea | 1 | 1 | 1 | 1 | 4 | |||||||||||||
| TB | 13 | 2 | 1 | 1 | 3 | 2 | 3 | 2 | 2 | 1 | 30 | |||||||
| HIV | 1 | 1 | 1 | 1 | 3 | 7 | ||||||||||||
| Other infections | 1 | 4 | 2 | 1 | 1 | 1 | 5 | 15 | ||||||||||
| Neoplasms | 1 | 26 | 1 | 28 | ||||||||||||||
| Nutritional/endocrine disorders | 1 | 2 | 1 | 3 | 3 | 2 | 1 | 6 | 1 | 1 | 21 | |||||||
| Acute cardiac diseases | 1 | 31 | 8 | 1 | 2 | 1 | 1 | 45 | ||||||||||
| Stroke | 2 | 1 | 3 | 4 | 69 | 1 | 1 | 10 | 1 | 1 | 93 | |||||||
| Other CVDs | 2 | 2 | 2 | 6 | 2 | 19 | 6 | 23 | 2 | 4 | 10 | 10 | 15 | 3 | 2 | 108 | ||
| Pneumonia | 2 | 1 | 2 | 1 | 1 | 10 | 5 | 1 | 3 | 1 | 1 | 28 | ||||||
| COPD | 1 | 1 | 1 | 2 | 2 | 1 | 15 | 2 | 2 | 2 | 29 | |||||||
| Liver cirrhosis | 2 | 1 | 1 | 7 | 1 | 12 | ||||||||||||
| Renal failure | 1 | 3 | 1 | 4 | 4 | 1 | 14 | |||||||||||
| Other NCDs | 1 | 5 | 6 | 1 | 2 | 4 | 1 | 10 | 3 | 33 | ||||||||
| Ill defined | 1 | 1 | 4 | 3 | 3 | 1 | 33 | 3 | 1 | 50 | ||||||||
| Maternal deaths | 1 | 1 | 1 | 1 | 1 | 2 | 1 | 8 | ||||||||||
| All injuries | 2 | 1 | 5 | 67 | 75 | |||||||||||||
| Total | 9 | 15 | 1 | 22 | 55 | 10 | 71 | 93 | 31 | 19 | 28 | 30 | 21 | 103 | 13 | 1 | 78 | 600 |
TB, tuberculosis; CVD, cardiovascular disease; PCVA, physician certified verbal autopsy
Discussion
This study addresses an important question in terms of the comparability of different methods that are applied to assign CoD from information gathered through VA interviews. InterVA is a probability-based computer method which is compatible with the WHO standard VA questionnaire and it is validated and being used worldwide in different settings among varied age groups212223. On the other hand, physician assignment of CoD from VA data is a standard practice followed in routine mortality data collection systems in India and China24.
Regarding the importance of two measures that were used to compare the performance of the two diagnostic methods i.e., CSMF and Cohen’s kappa, both have their own practical implications. For instance, Cohen’s kappa measures agreement of causes derived by the two methods at the individual level that is, comparison on a case-by-case basis. This has its clinical implication such that a high kappa score could imply that the CCVA method can be considered as an accurate alternative to physician review to derive CoD in individual cases. On the other hand, CSMF accuracy is a measure to find out the agreement on the population level distribution of diseases that is, comparing the fraction or proportion of a cause out of the total number of cases. Although there may be misclassification patterns at individual level, these may be compensatory patterns resulting in similar overall number of cases from each cause, and therefore closer proportions of causes from the two diagnostic methods25. A high value of CSMF accuracy can support the usefulness of the diagnostic method for public health purposes, to estimate broad disease burden in the population.
Our study showed that at the individual level, the InterVA-4 performs only ‘fairly’ well (kappa= 0.42), in terms of agreement between CCVA and physician coded diagnoses on a case-by-case basis. Even at the population level, CSMF accuracy was found to be only 0.71, implying that InterVA-4 can correctly predict only 71 per cent of physician coded verbal autopsy causes among adults. Since, there is no cut-off available for which CSMF accuracy may be called sufficient or insufficient to measure causes at population level, we used the McNemar’s paired chi-square test to find out if the CSMFs assigned by the InterVA-4 for individual causes are similar or not to the CSMFs from physician assigned CoD. It was found that even among the top five causes, there were significant differences in CSMFs for three causes, and InterVA-4 could assign similar CSMF for stroke and COPD only. But for causes where the CSMFs by both the methods were similar, except for stroke, the sample size was probably insufficient to detect whether the differences are statistically significant.
Furthermore, cross tabulation of the CoDs assigned by physicians and InterVA-4 in Table III show misclassification of causes by InterVA-4, which predicted HIV/AIDS in seven cases whereas physicians assigned only one death to HIV/AIDS. Similarly, InterVA-4 assigned eight deaths as maternal deaths as compared to physicians who assigned only one death as maternal death. On perusing the completed VA questionnaires for these cases, it was observed that InterVA-4 assigned HIV/AIDS and maternal death as CoD even in the absence of input in terms of a positive history of HIV/ AIDS, or positive responses to questions on pregnancy and childbirth, which is essential for the death being considered to be from a maternal cause. Another major misclassification observed was that InterVA assigned deaths to ‘other CVD causes’, or ‘diarrhoea’; even though no positive symptoms and signs related to CVD or diarrhoea was present in the responses recorded in the VA questionnaires.
Findings of this study are consistent with other studies which have compared the performance of InterVA either among adults or all ages212223. Only one study by Bauni et al21 was carried out among adults, rest of all other studies were among all age groups. In another study by Lozano et al26, the performance of InterVA and PCVA was compared against hospital causes. Physician-coded verbal autopsy versus hospital CoDs had a kappa of 0.52, whereas InterVA versus hospital CoDs had a kappa of 0.32, physician coded VA versus InterVA had a kappa of 0.42. However, in this study, single physician coding was done instead of two physicians coding. Furthermore, since cancer cases are more likely to avail hospital treatment before death, the concurrence for such causes are automatically high. Similarly, deaths from road traffic accidents are easily identified in both hospitals as well as in the community21. In a study by Desai et al14, the performance of InterVA along with three other computer-coded VA methods were compared with physician coded VA (double physician coding). It was found that the chance corrected concordance percentage of InterVA was 41 per cent with respect to physician-coded VA at the individual level. The CSMF accuracy percentage of InterVA was found to be 72 per cent14. The findings of these studies tally with the findings of the current study.
The study by Murray et al13 compared the performance of InterVA with pre-defined gold standards of hospital causes. The chance corrected concordance percentage of InterVA with reference standard was found to be 24 per cent and CSMF accuracy was 60 per cent12, which was lower than the ones estimated by Bauni et al21, Desai et al14 and this study. The findings of Murray et al13 correspond to the findings of Oti et al22 where kappa value between InterVA and physician-coded VA was found to be only 0.27.
Overall the kappa statistics or chance corrected concordance ranged from 0.2 to 0.4 and the CSMF accuracy ranged from 60 per cent to 72 per cent as determined by different studies. So it can be concluded that the performance of InterVA-4 in assigning causes of death both at individual and population level is not optimal. Hence, it cannot replace physician-coded VA in the present scenario.
One of the main limitations of this study was that other CCVA methods like the random forest, tariff method, and simplified symptom pattern method could not be used. King-Lu software though available in the public domain could not be used due to the large sample size required for test-train datasets. Another limitation could be the lack of a gold standard, that is, medically certified CoDs for comparing PCVA and CCVA.
CCVA methods are still evolving and need to be validated more rigorously in different settings for different age groups. The detailed methods and code used in computer programmes should be in the public domain, to encourage their use as well as the interpretation of results. More detailed studies of a similar nature, along with possibly a sample of cases for which reference diagnoses from hospital records are also available, will provide more clarity on the actual performance of computerized diagnostic approaches, whether as a supplement or as an alternative to physician assignment of CoDs. In summary, our study suggests that it may be appropriate to continue with physician-coded VA as the optimal option available in the current scenario, while CCVA programmes continue to evolve in scope, design and performance.
Acknowledgments
The authors acknowledge the team from the Department of Health & Family Welfare, Punjab, especially Community Health Workers for providing their assistance in data collection.
Financial support & sponsorship: None.
Conflicts of Interest: None.
References
- Office of the Registrar General and Census Commissioner, Ministry of Home Affairs. United Nations Children's Fund. Training manual for civil registration functionaries in India. Available from:https://site.bbmp.gov.in/citizenservisfaq/Birthanddeath.pdf
- [Google Scholar]
- Estimating mortality using data from civil registration:A cross-sectional study in India. Bull World Health Organ. 2016;94:10-21.
- [Google Scholar]
- Vital statistics of India based on the civil registration system 2014. New Delhi: Vital Statistics Division, Office of the Registrar General and Census Commissioner, Ministry of Home Affairs; 2016.
- [Google Scholar]
- Report on medical certification of cause of death 2014. New Delhi Unit of Vital Statistics Division, Office of the Registrar General and Census Commissioner, Ministry of Home Affairs 2016
- [Google Scholar]
- Report on causes of death in India 2001-2003. New Delhi: Vital Statistics Division, Office of the Registrar General and Census Commissioner, Ministry of Home Affairs, Government of India; 2009.
- [Google Scholar]
- WHO technical consultation on verbal autopsy tools. Final report:review of the literature and currently used verbal autopsy tools. Geneva: WHO; 2005.
- [Google Scholar]
- Prospective study of one million deaths in India:Rationale, design, and validation results. PLoS Med. 2006;3:e18.
- [Google Scholar]
- Validation of a verbal autopsy instrument to measure cause –Specific mortality among adults in India. Indian J Public Health. 2006;50:90-4.
- [Google Scholar]
- Verbal autopsy standards:ascertaining and attributing cause of death –The 2014 WHO verbal Autopsy Instrument. Geneva: WHO; 2015.
- [Google Scholar]
- Comparison of physician-certified verbal autopsy with computer-coded verbal autopsy for cause of death assignment in hospitalized patients in low- and middle-income countries:Systematic review. BMC Med. 2014;12:22.
- [Google Scholar]
- Using verbal autopsy to measure causes of death:The comparative performance of existing methods. BMC Med. 2014;12:5.
- [Google Scholar]
- Performance of four computer-coded verbal autopsy methods for cause of death assignment compared with physician coding on 24,000 deaths in low- and middle-income countries. BMC Med. 2014;12:20.
- [Google Scholar]
- List of sub- centers in Punjab. Chandigarh: Department of Health &Family Welfare, Government of Punjab; 2009.
- [Google Scholar]
- Million Death Study Training Centre. Health care professional's manual for assigning causes of death based on RHIME household reports by SRS collaborators of RGI- CGHR Toronto:CGHR, St. Michael's Hospital and University of Toronto. 2003. Available from:http://www.cghr.org:8080/cm|ne2-training/
- [Google Scholar]
- ICD-10 :international statistical classification of diseases and related health problems :tenth revision. 2004. (2nd ed). Available from:https://apps.who.int/iris/handle/10665/42980
- [Google Scholar]
- Strengthening standardised interpretation of verbal autopsy data:The new InterVA-4 tool. Glob Health Action. 2012;5:1-8.
- [Google Scholar]
- Special tabulation lists for mortality and morbidity;Mortality tabulation list 1. In: International statistical classification of diseases and health related problems –tenth revision. Vol 1. Geneva: WHO; 1993. p. :1207-10.
- [Google Scholar]
- Social autopsy for identifying causes of adult mortality. PLoS One. 2018;13:e0198172.
- [Google Scholar]
- Validating physician-certified verbal autopsy and probabilistic modeling (InterVA) approaches to verbal autopsy interpretation using hospital causes of adult deaths. Popul Health Metr. 2011;9:49.
- [Google Scholar]
- Verbal autopsy interpretation:A comparative analysis of the InterVA model versus physician review in determining causes of death in the Nairobi DSS. Popul Health Metr. 2010;8:21.
- [Google Scholar]
- Adaptation of a probabilistic method (InterVA) of verbal autopsy to improve the interpretation of cause of stillbirth and neonatal death in Malawi, Nepal, and Zimbabwe. Popul Health Metr. 2011;9:48.
- [Google Scholar]
- An integrated national mortality surveillance system for death registration and mortality surveillance, China. Bull World Health Organ. 2016;94:46-57.
- [Google Scholar]
- Robust metrics for assessing the performance of different verbal autopsy cause assignment methods in validation studies. Popul Health Metr. 2011;9:28.
- [Google Scholar]
- Performance of InterVA for assigning causes of death to verbal autopsies:multisite validation study using clinical diagnostic gold standards. Popul Health Metr. 2011;9:50.
- [Google Scholar]


