
Translate this page into:
The potential impact of vaccination on tuberculosis burden in India: A modelling analysis
For correspondence: Prof Nimalan Arinaminpathy, MRC Centre for Global Infectious Disease Analysis, Imperial College London, London, UK e-mail: nim.pathy@imperial.ac.uk
-
Received: ,
This article was originally published by Wolters Kluwer - Medknow and was migrated to Scientific Scholar after the change of Publisher.
Abstract
Background & objectives:
Vaccination will play an important role in meeting the end tuberculosis (TB) goals. While certain vaccine candidates in advanced stages of clinical trials raise hope for the future availability of new tools, in the immediate term, there is also increasing interest in Bacille Calmette–Guérin revaccination among adults and adolescents as a potential strategy. Here, we sought to estimate the potential epidemiological impact of TB vaccination in India.
Methods:
We developed a deterministic, age-structured, compartmental model of TB in India. Data from the recent national prevalence survey was used to inform epidemiological burden while also incorporating a vulnerable population who may be prioritized for vaccination, the latter consistent with the burden of undernutrition. Using this framework, the potential impact on incidence and mortality of a vaccine with 50 per cent efficacy was estimated, if rolled out in 2023 to cover 50 per cent of the unvaccinated each year. Simulated impacts were compared for disease- vs. infection-preventing vaccines, as well as when prioritizing vulnerable groups (those with undernutrition) rather than the general population. A sensitivity analyses were also conducted with respect to the duration, and efficacy, of vaccine immunity.
Results:
When rolled out in the general population, an infection-preventing vaccine would avert 12 per cent (95% Bayesian credible intervals (Crl): 4.3-28%) of cumulative TB incidence between 2023 and 2030, while a disease-preventing vaccine would avert 29 per cent (95% Crl: 24-34%). Although the vulnerable population accounts for only around 16 per cent of India’s population, prioritizing this group for vaccination would achieve almost half the impact of rollout in the general population, in the example of an infection-preventing vaccine. Sensitivity analysis also highlights the importance of the duration and efficacy of vaccine-induced immunity.
Interpretation & conclusions:
These results highlight how even a vaccine with moderate effectiveness (50%) could achieve substantial reductions in TB burden in India, especially when prioritized for the most vulnerable.
Keywords
Modelling
tuberculosis
vaccination

Ending tuberculosis (TB) will require not just substantial acceleration in diagnosis and treatment but also mass prevention of TB disease1. Although preventive therapy offers one approach to prevention using licensed regimens, at present, WHO guidelines include only risk groups such as people living with HIV and household contacts of TB patients2. Mathematical modelling suggests that, even in high-burden countries, full coverage of these risk groups would typically reduce incidence and mortality by only around 10-15 per cent over 10 years3. Expanding coverage beyond these groups presents challenges because current regimens last for three months, posing a burden on TB programmes as well as on patients with no outward symptoms of TB4.
For these reasons, there has been increasing recognition of the need for an effective TB vaccine1,5 that can be deployed at a population level for mass prevention. Currently, the only licensed vaccine against TB is Bacille Calmette–Guérin (BCG), the live-attenuated vaccine form of Mycobacterium bovis6. In use for almost a century, the main benefit of the BCG vaccine is to protect young children from severe forms of TB when provided at birth7. There are several TB vaccine candidates currently in development as alternatives8, with three for adults and adolescents in phase III trials. However, given the size and complexity required for advanced trials for TB vaccines, it may be some years before any of these candidates reach licensure or widespread deployment.
In this context, attention has returned to BCG, and in particular the potential benefits of BCG revaccination, or ‘boosting’ among adolescents. Early studies of revaccination in sub-Saharan Africa did not show any detectable reduction in TB9, but it is unclear how well these results would generalize to settings such as India. Indeed, a recent study among adults in India showed BCG revaccination to be immunogenic10. In another recent study, a retrospective analysis of the Chingleput BCG vaccination trial in 196811, BCG revaccination was associated with a 36 per cent reduction in the hazard rate of developing TB over a 15 yr period12. In an earlier study in South Africa, sustained QFT conversion (considered a correlate of TB infection) was reduced by BCG revaccination13. Further work, including prospective randomized trials in India, will be invaluable in developing this evidence base. Nonetheless, as India prepares for a large-scale push to end TB, it is important to anticipate the impact that effective TB vaccination may have, on the TB epidemic in India. In this study, we address this question using a mathematical model of TB transmission dynamics, calibrated to the TB epidemic in India.
Our work builds on previous modelling analysis14-16 by incorporating data from India’s recent TB prevalence survey17 to reflect the most recent estimates for TB burden in the country, as well as for the prevalence of latent TB17,18. Moreover, in a diverse country of over 1.3 billion people, targeting may be necessary in the initial stages of vaccine rollout, for example, in vulnerable groups with a higher prevalence of TB than the general population. The potential benefits of prioritizing vaccination in such vulnerable groups is highlighted in this article.
Material & Methods
Outline of the model: A compartmental, deterministic model of TB in India was developed using data from the recent National TB Prevalence Survey in India (2019-2021) report (Fig. 1). The model incorporated two different age groups: those below 15 yr of age (‘children’) and those aged 16 and above (‘adults’). The model took account of the healthcare system in India, distinguishing public and private healthcare sectors. In addition, the model incorporated vaccination status, dividing the adult population into three groups; (i) those who have not received adult vaccination; (ii) those who received adult vaccination and were immune and; (iii) those whose immunity from adult vaccination has waned. The model also incorporated a ‘vulnerable group’. As priority groups for vaccination, such vulnerable groups may include those with higher levels of latent TB infection, those at higher risk of breakdown to active disease given infection, those with a higher prevalence of active TB or a combination of all three. In practice, they might involve, for example, those with comorbidities exacerbating TB, slum dwellers, etc. As an illustrative example, we parameterized the vulnerable population to be consistent with undernutrition, a major risk factor for TB in India19. Because of the immunosuppressive effect of undernutrition20, it was assumed that those with latent TB and low body mass index (BMI) had a rate of progression from latent to active TB greater than those with normal BMI; we treated the relative rate as a parameter to be calibrated. For simplicity it was assumed that undernutrition was not associated with an increased risk of acquiring infection.
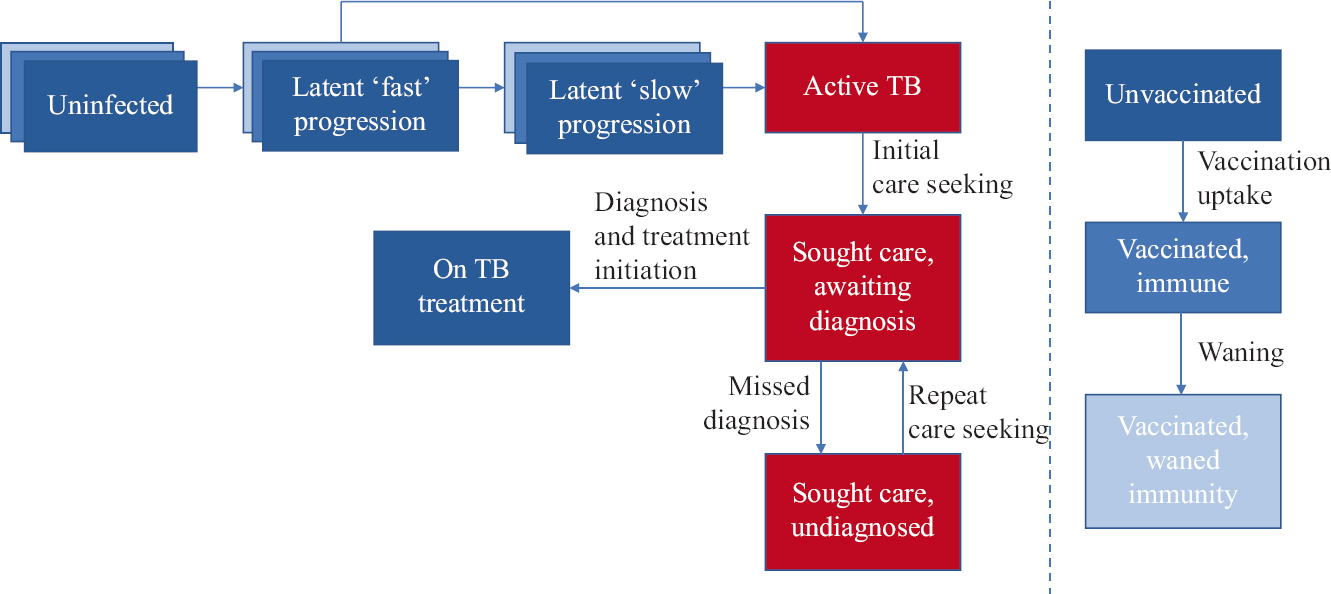
- Schematic illustration of the model. Compartments in red show infectious states. In the left-hand panel, blue-shaded ‘layers’ for the first three compartments (uninfected and latent states) represent different levels of vaccination status: progression between these different levels is shown on the right-hand side. Note: For clarity of illustration, the following features were not shown in this representation: age structure (stratifying all compartments into those <15 yr of age and >15 yr), TB-related mortality, reinfection and relapse and spontaneous cure.
Data and calibration: Calibration to the available data (Table) were performed using adaptive Bayesian Markov chain Monte Carlo (MCMC), performing 10,000 iterations. After discarding the burn-in and taking a ‘thinned’ subsample, we drew 250 samples from the posterior density. Computing all model outputs (e.g. future incidence) using each of these samples, we estimated point values as the 50th percentile, and 95 per cent Bayesian credible intervals (Crl) as being bounded by the 2.5th and 97.5th percentiles.
| Indicator | Value | Source |
|---|---|---|
| Prevalence per 100,000 population, 2020 | 312 (286-337) | National TB prevalence survey17 |
| Of prevalent TB, per cent on treatment | 12 (9.0-16) | |
| Of prevalent TB, per cent that had not sought care | 6.6 (5.6-7.6) | |
| Notifications per 100,000 population, 2019 | 125 (113-138) | Programmatic data, allowing for ±10 per cent uncertainty |
| Mortality, 2019 | 37 (34-40) | WHO global TB report21 |
| Relative risk of TB, undernutrition vs. normal BMI | 3 (2-4) | |
| Per cent of population having undernutrition | 16 (13-19) | Food and agriculture organization data22 |
| Population prevalence of LTBI (per cent) | 25 (20-30) | National TB prevalence survey17 |
| Per cent of population being 15 years old or younger | 29 (25-33) | World bank estimates23 |
Numbers in parentheses show 95 per cent uncertainty intervals. BMI, body mass index; TB, tuberculosis; LTBI, latent TB infection; WHO, World Health Organization
Modelling interventions: Following previous work14, we concentrated on vaccination among adults and adolescents, i.e. those aged 16 yr and above. Because analysis of BCG revaccination was conducted against a clinical endpoint of symptomatic disease rather than infection12, it is not yet clear whether its mode of action is an ‘infection-preventing’ effect, a ‘disease-preventing’ one (i.e. protecting those with latent TB from developing active disease) or both. Hence, we modelled two scenarios, both with 50 per cent efficacy: an infection-preventing vaccine and a disease-preventing vaccine. In addition, assuming an infection-preventing vaccine, we modelled the following scenarios: (i) annually vaccinating 50 per cent of those who have not yet received adult vaccination in the vulnerable population and (ii) annually vaccinating 50 per cent of those who have not yet received adult vaccination in the general population. We assumed for simplicity that vaccination coverage would be scaled up in a linear way, to reach these levels in three years between 2023 and the end of 2025. We also assumed that vaccination would have the same efficacy in those with undernutrition as in the general population, modelled as equivalent proportional reductions in the rate of progression from latent to active TB. Further, we assumed that vaccination only extends to those without prior vaccination as adults, thus excluding those in whom vaccine-induced immunity had waned. We assumed that vaccine-induced immunity lasts for 10 yr on an average but performed a sensitivity analysis to this assumption, as well as to different scenarios for efficacy, coverage and duration of scale-up.
Study tool: This model was coded and implemented in Matlab, version R2021a software (MathWorks Inc. Natick, MA, USA).
Results
The results of model calibration are shown in Supplementary Figures 1 and 2. Figure 2 shows the impact of different mechanisms of vaccine action with the same efficacy and levels of coverage in the general population, illustrating that a disease-preventing vaccine would have a stronger impact on the incidence, between now and 2030, than an infection-preventing vaccine. In particular, an infection-preventing vaccine would avert 12 per cent [95% Bayesian credible intervals (Crl): 4.3-28%] of cumulative incidence over this period, while a disease-preventing vaccine would avert 29 per cent (95% CrI: 24-34%). In terms of mortality, an infection-preventing vaccine would avert 8.5 per cent (95% Crl: 2.8-20%) of cumulative TB deaths between now and 2030, while a disease-preventing vaccine would avert 21 per cent (95% CrI: 19-26%) during this period.
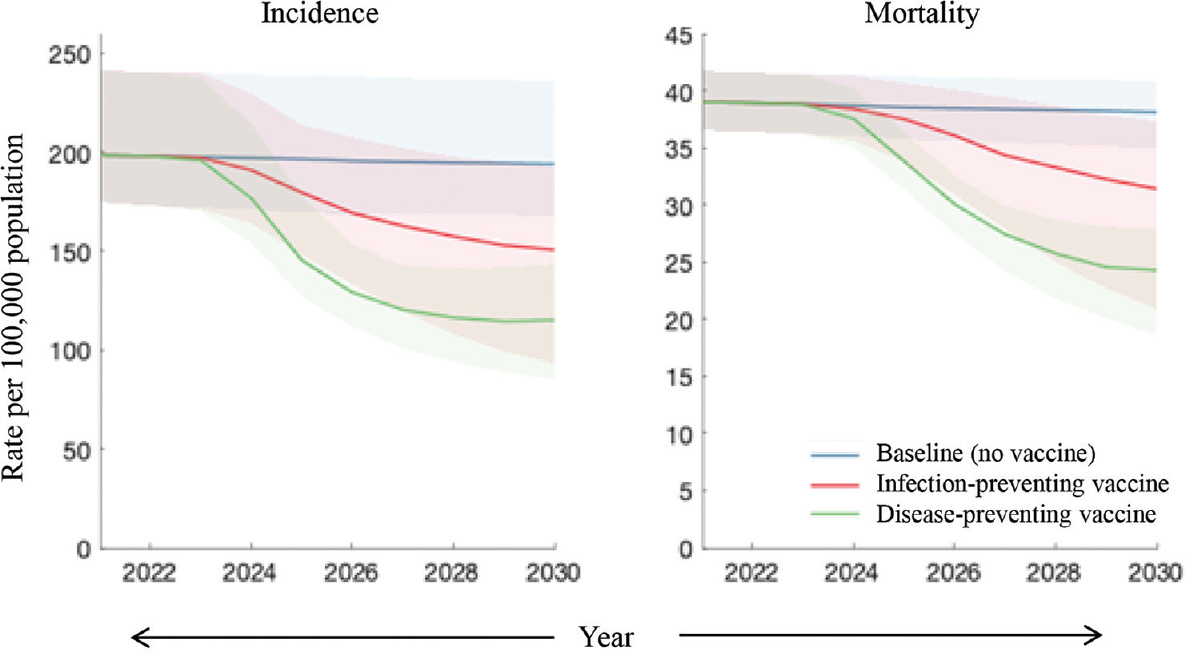
- Comparison of different types of vaccine effects. Shown are the scenarios of an infection-preventing vaccine (red) and a disease-preventing one (green). In both cases, the following assumptions were made: vaccine efficacy of 50 per cent; sufficient vaccination coverage to cover 50 per cent of the unvaccinated population each year and moreover that vaccine-induced immunity lasts for 10 yr on an average.
Figure 3 shows the impact of targeting vulnerable groups, concentrating on the example of an infection-preventing vaccine. The scenario of vaccinating the general population is equivalent to that shown in Figure 2. However, targeting the vulnerable population would avert five per cent of cumulative incidence (95% Crl: 1.8-14) and 3.8 per cent of cumulative mortality (95% credible intervals: 1.2-10).
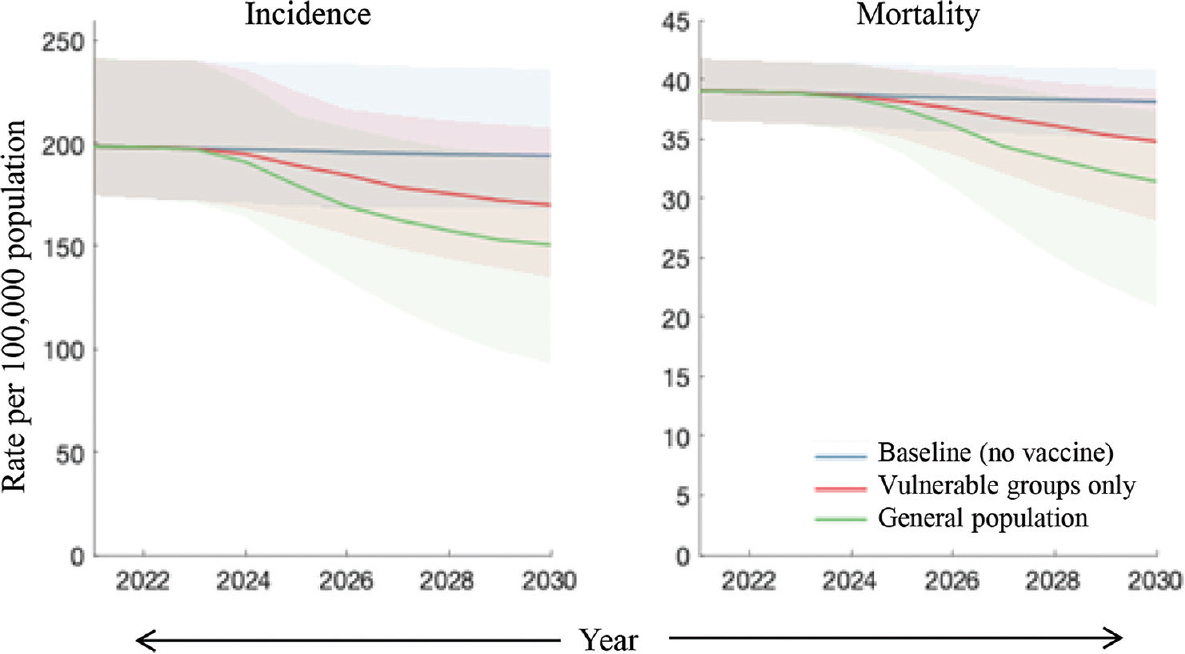
- Comparison of strategies for vaccine targeting. Assuming an infection-preventing vaccine, shown are scenarios where vaccination is targeted at those with undernutrition (red) and where it is deployed in the general population, without targeting (green). Assumptions for vaccine coverage, efficacy, etc., are as in Figure 2.
Figure 4 shows the results of sensitivity analysis, illustrating the strong roles played by the duration of vaccine-induced immunity and by vaccine efficacy. The overall impact is roughly proportional to vaccine efficacy (right-hand panel). It also depends sensitively on the duration of vaccine protection, especially when this duration is shorter than around 10 yr (left-hand panel). For example, where immunity lasts two years on an average, cumulative incidence averted with a disease-preventing vaccine would only be about 6.8 per cent (95% credible intervals: 2.4-17), a relative reduction of over 75 per cent compared to the impact of a vaccine offering 10 yr protection.
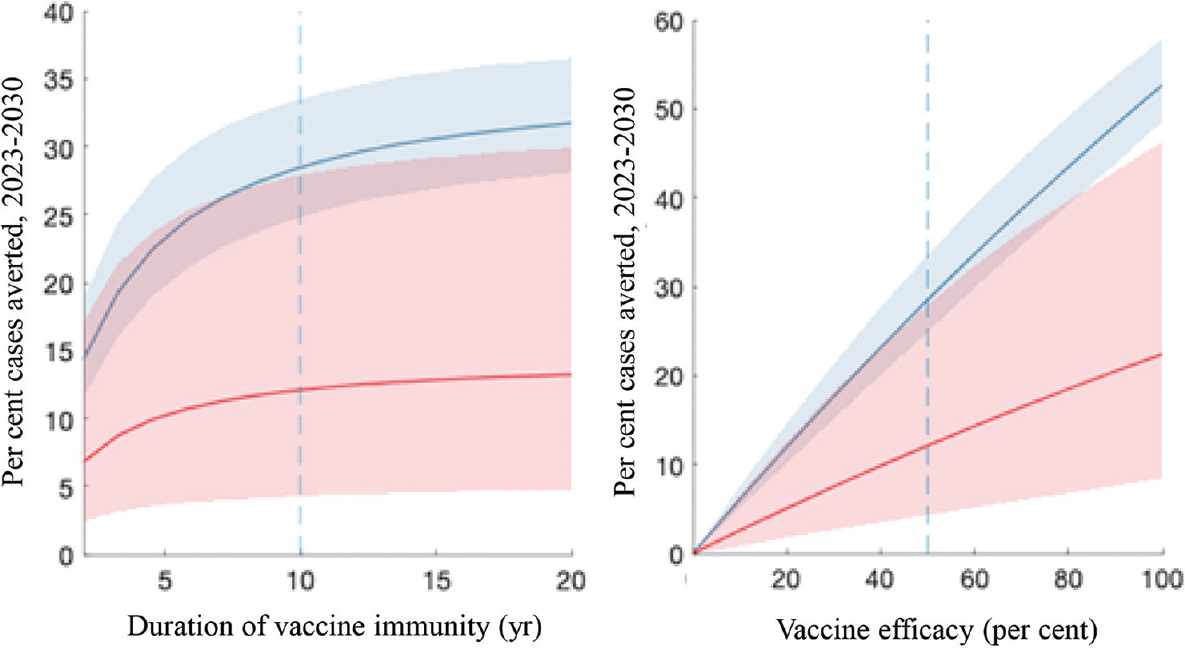
- Sensitivity analysis to vaccine characteristics. Shown are impacts arising from a range of scenarios for the duration of vaccine immunity (left panel) and for vaccine efficacy (right panel). In each panel, red and blue curves correspond, respectively, to infection- and disease-preventing vaccines. The vertical dashed lines show the default values assumed in preceding figures.
Figure 5 shows additional sensitivity analysis to vaccine programme parameters, showing a range of scenarios for annual coverage (X axis) as well as for the duration of scale-up (different colours). For example, three-year scale-up to annual 75 per cent coverage of a disease-preventing vaccine would avert 29 per cent (95% CrI: 25-34%) of cumulative cases by 2030. If this period of scale-up is extended to five years, then the impact would be reduced to 23 per cent (95% CrI: 21-26%). On the other hand, if it is shortened to just one year, the impact would be increased to 34 per cent (95% CrI: 30-41%).

- Sensitivity analysis to vaccine programme characteristics. Shown are impacts arising from a range of scenarios for vaccine coverage (X axis) and for the time taken to scale-up to this coverage, starting from 2023 (solid, dashed and dot-dashed lines). As in Figure 4, red and blue curves correspond, respectively, to infection-preventing and disease-preventing vaccines, and the vertical dashed line shows the default coverage assumed in Figures 1-3.
Discussion
In high-burden settings such as India, vaccination will be critical in bringing down TB incidence and mortality, to meet the End TB goals. Mathematical modelling offers a helpful tool for anticipating the potential impact of vaccination strategies. Our work builds on previous modelling analyses14-16, to incorporate updated estimates of TB burden in India, as well as to address the potential for targeting vulnerable population subgroups in the initial stages of vaccination rollout.
Notably, our results suggest that a disease-preventing vaccine would have a stronger impact than an infection-preventing one, at least over the timescales modelled here (Fig. 2). One key reason for this result could be the slow natural history of TB, specifically with infected individuals typically taking a year or longer to develop active TB24. Thus, while an infection-preventing vaccine may take several years to show the effect on active TB amongst those not yet infected, the benefits of a disease-preventing vaccine are more likely to be felt in the short term, particularly among those already infected who would soon develop disease. Another notable result is the disproportionate impact of prioritizing vaccination in the vulnerable population (Fig. 3). Although this group was assumed to account for only 16 per cent of the general population, targeted vaccination achieves over 40 per cent of the incidence and mortality reductions that could arise from vaccinating the general population. Overall, these results highlight that if vaccine coverage needs to be focussed during the initial stages of rollout, it would have a disproportionate impact when prioritized for vulnerable populations bearing a high burden of TB.
Taken together, our results highlight the public health value of achieving the maximum possible vaccination coverage as rapidly as possible (Fig. 5). In a country as large and complex as India, achieving high levels of coverage will undoubtedly be a substantial programmatic challenge. Nonetheless, the COVID-19 response showed that such levels of coverage could be reached, with almost 90 per cent of >18-yr-olds having received a first dose over the course of 202125. Even so, for a sustained TB vaccination programme in the future, it may be necessary to adopt ‘staged’ strategies for increasing vaccination coverage, including: (i) prioritizing adults and adolescents14, in order to maximize epidemiological impact, and (ii) focussing first on vulnerable populations such as those with malnutrition and other at-risk groups, and (iii) similarly but with a geographic scope, potentially prioritizing those States and districts with the highest burden of TB. Achieving high coverage in these priority populations will be an important stage in ultimately reaching sustained, high coverage at the country level.
As discussed above, while vaccines currently in the development pipeline may take years to be licensed and widely deployed, BCG revaccination may offer a valuable approach in the short term. In children, the efficacy of primary BCG vaccination appears to vary by setting, and in particular by longitude26, suggesting that for BCG revaccination as well, it will be important for any evidence to be context specific. Recent studies have shown promising results regarding the immunogenicity and efficacy of BCG revaccination among adults in India10,12. However, the sample size involved in a recent analysis12, and the limitations inherent in any retrospective study, mean that further evidence from prospective, randomized study designs in India will be invaluable. BCG revaccination is generally safe and can also have important health benefits beyond TB. For example, a recent systematic review highlighted a reduction in all-cause paediatric mortality arising from BCG vaccination, not limited to TB27. The extent of corresponding protection in adolescents and adults remains unclear; nonetheless, these findings suggest the possibility that the population benefits of BCG revaccination may extend well beyond reducing TB burden alone.
With its focus on vaccination, our analysis does not address the potential for future improvements in other areas of the TB response. For example, continued expansion in engaging with India’s private healthcare sector is likely to contribute towards reduced diagnostic delays, as well as improved treatment outcomes28. Moreover, future expansion in active case-finding will contribute towards early identification of those with TB, potentially with important implications for transmission29. All of these measures focus on accelerating diagnosis and treatment: previous modelling work has highlighted the strong impact on incidence and mortality that could result when such measures are combined with mass vaccination1. With a substantial expansion in coverage of short-course TB preventive treatment (TPT) also anticipated in the coming months and years, an important question that arises is how such treatment would interact with preventive vaccines. Given that TPT and vaccines function through pharmacological and immunological effects, respectively, one would expect their preventive effects to be complementary. Nonetheless, this is another context in which evidence from prospective trials will be useful in refining model-based estimates.
As with any modelling analysis, this study had some important limitations to note. The model necessarily entailed simplifications: it did not include rifampicin-resistant TB, which accounts for about four per cent of TB incidence in India21. Previous modelling highlights the substantial reductions in drug-resistant TB that could be achieved through vaccination30,31. This model also neglected HIV/TB coinfection, which accounts for around two per cent of TB incidence in India21. Such small proportions seem unlikely to affect our estimates substantially: nonetheless, given the potentially important effects of HIV on vaccine effectiveness, an important area for future work would be to extend the present analysis to high-HIV burden settings within India. As discussed above, further evidence for the efficacy of BCG revaccination in adults and adolescents will be invaluable in refining our model estimates. Moreover, in the absence of available data, we further assumed that vaccine efficacy would be the same in those with undernutrition as compared to those with normal BMI: if, in practice, there is a lower efficacy in this group, the projected impact of vaccination would be correspondingly lower. Accordingly, in future vaccine evaluation, it will be important to assess efficacy not just in the general population but also in any population subgroups that might be considered for prioritization. Another important area for future work is to estimate the potential impact at the subnational level, particularly for different States, in contrast to the country level focus in the present study. In this work, we have also not addressed cost, although previous modelling analysis has shown that TB vaccination would be cost-effective14. In any future vaccination campaign where eligibility is restricted to those with latent TB, there may be additional costs associated with testing for latent TB infection.
Overall, given the critical role of population-level prevention for meeting the End TB goals, the urgency for an effective vaccine will not diminish, but only intensify, in the coming months and years. Even if currently available vaccines are imperfect, these may afford valuable and much-needed opportunities for TB prevention in India that can be built on as, more-effective and improved vaccines emerge in the future.
Financial support & sponsorship: Author (NA) was supported by the Bill and Melinda Gates Foundation, and also received funding from the UK Medical Research Council and the Jameel Institute at Imperial College London.
Conflicts of Interest: None.
References
- 2023-2030. Available from: https://www.stoptb.org/global-plan-to-end-tb/global-plan-to -end-tb-2023-2030
- 2018. Guidelines on the management of latent tuberculosis infection. Available from: https://www.who.int/publications/i/item/9789241548908
- The potential impact of preventive therapy against tuberculosis in the WHO South-East Asian Region: A modelling approach. BMC Med. 2020;18:163.
- [Google Scholar]
- Ethical issues in expanding latent TB management in high burden countries. Indian J Med Ethics 2020;V:53-6.
- [Google Scholar]
- An investment case for new tuberculosis vaccines. Available from: https://www.who.int/publications/i/item/9789240064690
- Efficacy of BCG vaccine in the prevention of tuberculosis. Meta-analysis of the published literature. JAMA. 1994;271:698-702.
- [Google Scholar]
- Infant BCG vaccination and risk of pulmonary and extrapulmonary tuberculosis throughout the life course: A systematic review and individual participant data meta-analysis. Lancet Glob Health. 2022;10:e1307-16.
- [Google Scholar]
- Pipeline of vaccines. Available from: https://www.tbvi.eu/what-we-do/pipeline-of-vaccines/
- Randomised controlled trial of single BCG, repeated BCG, or combined BCG and killed Mycobacterium leprae vaccine for prevention of leprosy and tuberculosis in Malawi. Lancet. 1996;348:17-24.
- [Google Scholar]
- BCG revaccination boosts adaptive polyfunctional Th1/Th17 and innate effectors in IGRA+and IGRA- Indian adults. JCI Insight. 2019;4:130540.
- [Google Scholar]
- Trial of BCG vaccines in South India for tuberculosis prevention: First report –Tuberculosis Prevention Trial. Bull World Health Organ. 1979;57:819-27.
- [Google Scholar]
- Revisiting the Chingleput BCG vaccination trial for the impact of BCG revaccination on the incidence of tuberculosis disease. Indian J Med Res. 2022;157:152-9.
- [Google Scholar]
- Prevention of M. tuberculosis Infection with H4: IC31 vaccine or BCG revaccination. N Engl J Med. 2018;379:138-49.
- [Google Scholar]
- Impact and cost-effectiveness of new tuberculosis vaccines in low- and middle-income countries. Proc Natl Acad Sci U S A. 2014;111:15520-5.
- [Google Scholar]
- Epidemiological benefits of more-effective tuberculosis vaccines, drugs, and diagnostics. Proc Natl Acad Sci U S A. 2009;106:13980-5.
- [Google Scholar]
- Potential impact of tuberculosis vaccines in China, South Africa, and India. Sci Transl Med. 2020;12:eaax4607.
- [Google Scholar]
- National TB prevalence survey in India (2019 –2021). Available from: https://tbcindia.gov.in/WriteReadData/l892s/25032022161020NATBPSReport.pdf
- The global burden of latent tuberculosis infection: A re-estimation using mathematical modelling. PLoS Med. 2016;13:e1002152.
- [Google Scholar]
- Undernutrition &tuberculosis in India: Situation analysis &the way forward. Indian J Med Res. 2016;144:11-20.
- [Google Scholar]
- Global tuberculosis report 2022. Available from: https://www.who.int/teams/global-tuberculosis-programme/tb-reports/global-tuberculosis-repo rt-2022
- Sustainable development goals: Prevalence of undernourishment. Available from: https://www.fao.org/sustainable-development-goals/indicators/211/en/
- India demographic data. Available from: https://data.worldbank.org/country/india
- Progression from latent infection to active disease in dynamic tuberculosis transmission models: A systematic review of the validity of modelling assumptions. Lancet Infect Dis. 2018;18:e228-38.
- [Google Scholar]
- 2023. India: Coronavirus pandemic country profile. Available from: https://ourworldindata.org/coronavirus/country/india
- Geographic latitude and the efficacy of Bacillus Calmette-Guérin vaccine. Clin Infect Dis. 1995;20:982-91.
- [Google Scholar]
- The effect of BCG revaccination on all-cause mortality beyond infancy:30-year follow-up of a population-based, Double-Blind, randomised placebo-controlled trial in Malawi. Lancet Infect Dis. 2021;21:1590-7.
- [Google Scholar]
- Modelling the impact of effective private provider engagement on tuberculosis control in Urban India. Sci Rep. 2019;9:3810.
- [Google Scholar]
- Turning off the tap: Stopping tuberculosis transmission through active case-finding and prompt effective treatment. Lancet. 2015;386:2334-43.
- [Google Scholar]
- The epidemiologic impact and cost-effectiveness of new tuberculosis vaccines on multidrug-resistant tuberculosis in India and China. BMC Med. 2021;19:60.
- [Google Scholar]
- Modelling the global burden of drug-resistant tuberculosis avertable by a post-exposure vaccine. Nat Commun. 2021;12:424.
- [Google Scholar]
- Progression from latent infection to active disease in dynamic tuberculosis transmission models: A systematic review of the validity of modelling assumptions. Lancet Infect Dis. 2018;18:e228-38.
- [Google Scholar]
- Self-clearance of Mycobacterium tuberculosis infection: Implications for lifetime risk and population at-risk of tuberculosis disease. Proc Biol Sci. 2021;288:20201635.
- [Google Scholar]
- Natural history of tuberculosis: Duration and fatality of untreated pulmonary tuberculosis in HIV negative patients: A systematic review. PLoS One. 2011;6:e17601.
- [Google Scholar]
- Risk of progression to active tuberculosis following reinfection with Mycobacterium tuberculosis. Clin Infect Dis. 2012;54:784-91.
- [Google Scholar]
- Predicting tuberculosis relapse in patients treated with the standard 6-month regimen: An individual patient data meta-analysis. Thorax. 2019;74:291-7.
- [Google Scholar]
- Effect of duration and intermittency of rifampin on tuberculosis treatment outcomes: A systematic review and meta-analysis. PLoS Med. 2009;6:e1000146.
- [Google Scholar]
- The effect of directly observed therapy on the rates of drug resistance and relapse in tuberculosis. N Engl J Med. 1994;330:1179-84.
- [Google Scholar]
- Recurrence due to relapse or reinfection with Mycobacterium tuberculosis: A whole-genome sequencing approach in a large, population-based cohort with a high HIV infection prevalence and active follow-up. J Infect Dis. 2015;211:1154-63.
- [Google Scholar]
Supporting Technical Information
Table of contents
Governing equations...................................................................................2 Table of parameters.....................................................................................4 Model implementation and calibration.......................................................7 References...................................................................................................9
Governing Equations
In what follows, the subscript α denotes age group, with α = 1, 2 denoting, respectively: those aged up to 15 years old and those 16 years and above. The subscript v denotes vaccination status, with v = 0,1,2 denoting, respectively: unvaccinated, those with vaccine immunity and those with waned vaccine immunity. The subscript r denotes the risk group, with r = 0,1 denoting, respectively: those with normal BMI and those with undernutrition.
Definitions and values of model parameters are given in Supplementary Table.
Uninfected (U):

where δ(α,1) takes the value 1 when α = 1 and 0 otherwise. The functions α(.), γ(.) govern ageing and uptake of vaccination, as defined below.
Latent infection, ‘fast’ progression (L(f)):
Latent infection, ‘slow’ progression (L(s)):
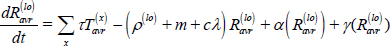
Active disease, pre-care seeking (I):

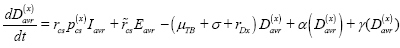
Sought care with provider type x, awaiting diagnosis (D(x)):
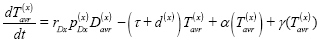
Diagnosed and initiated treatment with provider type x (T(x)):
Missed diagnosis (E):

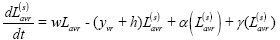
Recovery after treatment completion, low relapse risk ( ):
):
Recovery after treatment interruption or self-cure, high relapse risk ( ):
):

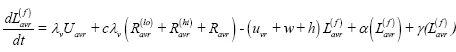
Long-term recovery, stabilized relapse risk (Ravr):

Force-of-infection (λv):
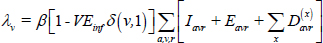
where δ (v,1) takes the value 1 when v = 1 and 0 otherwise. Here, VEinf represents vaccine efficacy in preventing infection.
Similarly, the progression parameters uv,yv are dependent on vaccine status, as follows:
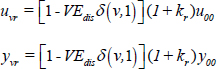
for baseline values u00, y00 in the absence of vaccination amongst people with normal BMI, as listed in Supplementary Table, and where kr represents the excess risk of progressing to active TB associated with undernutrition. Here, VEdis represents vaccine efficacy in preventing disease.
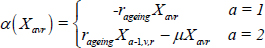
The function α (.) governs transition between the age compartments as follows, for a given state variable X:
The function γ (.) governs transition between states of vaccine immunity as follows, for a given state variable X:
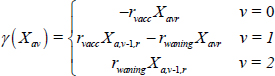
| Parameter symbol | Meaning | Value | Source | |||||||
|---|---|---|---|---|---|---|---|---|---|---|
| Natural history | ||||||||||
| β | Annual infections per TB case | 8.2 [6.4-10] | Model calibration | |||||||
| uvr | Per-capita rate of progression from latent ‘fast’ infection to active disease | v=0, r=0 | u00=0.041 [0.0094-0.10] | Menzies et al1, with uncertainty intervals [0.1-20]-fold, allowing wide uncertainty for progression | ||||||
| Otherwise | uvr = [1 - VEdisδ(v,1)](1+kr) u00 | |||||||||
| w | Per-capita rate of stabilization from latent ‘fast’ to latent ‘slow’ status | 0.87 [0.65-1.09] | Menzies et al1, with uncertainty intervals+/−25% | |||||||
| yvr | Per-capita rate of reactivation from latent ‘slow’ infection to active disease | v=0, r=0 | y00=0.0036 [0.0004–0.0064] | Menzies et al1, with uncertainty intervals [0.1-20]-fold, allowing wide uncertainty for reactivation | ||||||
| Otherwise | yvr = [1 - VEdisδ(v,1)](1+kr) y00 | |||||||||
| kr | Relative hazard of progression/reactivation, | r=0 | 1 | Reference nutritional status | ||||||
| undernourished versus normal BMI | r=1 | 3.67 [2.23-5.99] | Calibrated to yield 3× prevalence in those with undernutrition, relative to normal BMI | |||||||
| h | Per-capita rate of self-clearance of latent TB infection | 0.028 [0.021-0.035] | Emery et al2 | |||||||
| μTB | Per-capita rate of mortality, untreated TB | 0.17 [0.13-0.21] | Tiemersma et al3, calculated to give 50 per cent case fatality rate over an average duration of three years | |||||||
| σ | Per-capita rate of self-cure, untreated TB | 0.17 [0.13-0.21] | ||||||||
| c | Reduced risk of reinfection arising from prior exposure | 0.44 [0.28-0.66] | Andrews et al (2012)4, with assumed uniform prior over range of [0.5-0.9] | |||||||
| Health services | ||||||||||
| rcs | Per-capita rate of first care-seeking, active TB | 0.65 [0.47-0.88] | Model calibration | |||||||
| r̃cs | Following missed diagnosis, per-capita rate of subsequent care seeking | 13.5 [4.2-50] | Model calibration | |||||||
| rDx | Per-capita rate of offering diagnosis | 52 | Assumption, corresponding to an average of one week | |||||||
 |
On each care-seeking attempt, | x=1 (public) | 0.62 [0.41-0.95] | Model calibration | ||||||
| probability of visiting provider type x | x=2 (private) |  |
||||||||
 |
Per care-seeking visit, probability of diagnosis and initiation on treatment with provider type x | x=1 (public) | 0.7 [0.55-0.79] | Model calibration | ||||||
| x=2 (private) | 0.55 [0.4-0.63] | |||||||||
| τ | Per-capita rate of treatment completion | 2 | Corresponds to a regimen duration of six months | |||||||
| d(x) | Per-capita rate of treatment interruption | x=1 (public) | 0.35 [0.26-0.44] | Calculated using d = τp/(1–p), for treatment completion proportion p, which is taken as 0.85 in the public sector and 0.5 in the private sector (assumption, with broad uncertainty intervals) | ||||||
| x=2 (private) | 2 [1.5-2.5] | |||||||||
| ρ(lo) | Per-capita rate of relapse following treatment completion | 0.034 [0.029-0.039] | Romanowski et al (2019)5, Menzies et al (2009)6 and Weis et al (1994)7, with uniform prior using intervals of±50% | |||||||
| ρ(hi) | Per-capita rate of relapse following treatment completion | 0.12 [0.11-0.16] | ||||||||
| m | Per-capita rate of stabilizing to long-term relapse risk | 0.5 | Most relapse occurs in the first two years after recovery: Guerra-Assunção et al (2015)8 | |||||||
| ρ | Long-term per-capita rate of relapse | 0.0014 [0.0011-0.0018] | ||||||||
| Demographics | ||||||||||
| pr | At birth, proportion in risk group r | 0.16 [0.13-0.20] | Adjusted to yield a 16 per cent prevalence of undernutrition in the population, with 95 per cent uncertainty intervals 13%-19% | |||||||
| rageing | Per-capita rate of moving from age groups 1 to 2 | 1/16 | Age group 2 denotes those 16 years old and above | |||||||
| μ | Per-capita rate of background morality | 0.015 [0.0028-0.017] | Model calibration | |||||||
TB, tuberculosis; BMI, body mass index
Model implementation and calibration
For a given parameter set θ, we first simulated a perturbation to the disease-free equilibrium, with no vaccination, to find the equilibrium solution. Taking this solution as the initial condition from 2000 onwards, we simulated the expansion of DOTS services until 2010 as an expansion in the model parameter ppu (the proportion of care-seeking visits that are to the public sector). We simulated the model forwards to 2019.
We assessed model outputs against each of the calibration targets shown in Table in the main text, as follows: for each calibration target, we first constructed likelihood functions using beta distributions to model proportions, and log-likelihood distributions for all other data. We then took the overall likelihood as a product of all likelihood terms: in practice, we calculated the log-likelihood, thus taking a sum of the individual log-likelihood terms. For all priors (representing plausible ranges on model parameters), we took uniform distributions. We took the posterior density for the parameter θ as being proportional to the product of the likelihood and prior densities.
We sampled from the posterior density using adaptive Bayesian MCMC9. Drawing 10,000 samples (Supplementary Fig. 1), we discarded the burn-in and selected every 50th sample to yield 250 samples from the posterior density. We made all model projections (i.e. future impact of given vaccination scenarios) using these 250 samples; we estimated uncertainty by calculating the 2.5th and 97.5th percentiles, and denoting the interval between these estimates as the 95% Bayesian credible intervals. We identified central estimates as the 50th percentile. Below, Supplementary Fig. 1 shows the trace arising from the MCMC calibration, while Supplementary Fig. 2 shows the resulting comparisons between model outputs and data.
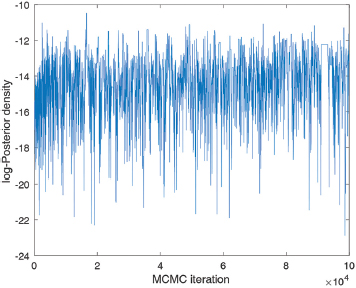
- Trace plot arising from MCMC calibration, showing the log-posterior density over 100,000 iterations. MCMC, Markov chain Monte Carlo.

- Results of model calibration. Outputs are shown on two different panels because of the different scales involved. Dots show central estimates, while error bars show 95% uncertainty intervals.


