
Translate this page into:
The desat-max in 2-chair test appears to be a worthwhile parameter to identify sickness: An appraisal
For correspondence: Dr Parthasarathi Bhattacharyya, Department of General Pulmonology, Institute of Pulmocare and Research, Kolkata 700 156, India e-mail: parthachest@yahoo.com
-
Received: ,
Accepted: ,
Abstract
Background & objectives
The 2-chair test (2CT) has recently been proposed as a cardiopulmonary reserve-specific assessment of post-exercise recovery response. The objective of this study was to find out the most appropriate parameter of 2CT to categorically differentiate between ‘normal’ and symptomatic diseased population.
Methods
In a prospective manner, we recruited a random cohort of symptomatic patients attending our outpatient department (OPD) with different respiratory diseases. We also selected another cohort of ‘normal’ persons from the willing attendants of the patients who had no symptoms and revealed no abnormality on chest X-ray and spirometry. Persons belonging to both groups were requested to mark their ‘sickness’ on a scale of 0 to 10 (‘0’ meaning none and ‘10’ meaning maximum possible) under the PPSS (patient-perceived sickness score) and were subjected to perform 2CT. All the test variables related to pulse rate and peripheral capillary oxygen saturation (SpO2) changes were noted for both groups. The ‘symptomatic’ and ‘normal’ persons were compared based on the 2CT variables to find the well-performing discriminatory parameter.
Results
The comparison of 2CT variables of 419 patients and 30 ‘normal’ controls revealed that the PR change max, maximum SpO2, minimum-SpO2, and desat-max can significantly differentiate between the two. However, the desat-max correlated to the PPSS best. The VIP plot, primary component analysis, and pattern-hunter representation further substantiated this.
Interpretation & conclusions
The desat-max appears to be a sensitive parameter to differentiate the normal from the symptomatic diseased population. Further research in this area is warranted.
Keywords
2-chair test
arterial oxygen saturation
desat-max
heart rate recovery
patient-perceived sickness score
post-exercise recovery response

Exercise tests are integral to understanding cardiovascular status in health and diseases1. In routine clinical practice, a test like the 6-min walk test (6MWT) is widely used to appreciate underlying disease severity, functional status, and impact of treatment across various chronic diseases, including heart failure, pulmonary hypertension, and chronic obstructed pulmonary disease (COPD)2-6.
To circumvent the demand for a 30-meter-long corridor for 6MWT, the 2-chair test (2CT) was innovated1. The test is simple, less time-consuming, and can be performed in the physician’s office. It includes the serial measurements of pulse rate and peripheral capillary oxygen saturation (SpO2) at rest and at every 10 sec immediately following movements between two chairs based on a defined protocol7. It offers several variables in the domains of both the pulse rate and SpO2 changes7.
The innovators of 2CT claimed it to be cardiopulmonary specific even though the top performing yardstick of measurement for any cardiopulmonary abnormality out of the list of available variables of 2CT is yet to be published. The innovators used the maximum point deviation of SpO2 from the baseline (named desat-max) in their publication to select the chronic obstructive pulmonary disease associated pulmonary hypertension (COPD-PH) subjects for vasodilator treatment8 and used the same parameter in their effort of hemodynamic endorsement of such approach9. In the present study, we aimed to identify the most sensitive parameter that could correlate best with the subjective appreciation of sickness by sufferers of respiratory diseases.
Materials & Methods
This prospective study was undertaken by the department of General Pulmonology, Institute of Pulmocare and Research, Kolkata from March 2023 to March 2024 after ethical clearance.
The methodology included, (i) selecting participants from ill and symptomatic patients and ‘normal’ persons, (ii) collecting their subjective sickness score on a ‘0’ to ‘10’ scale based on severity, (iii) subjecting them uniformly to 2CT, and (iv) conducting statistical tests as appropriate to attain the stated objective.
Participants selection
The ill and symptomatic participants were recruited from our referral pulmonary OPD attendees with consent. Unwilling subjects, subjects with any significant disability hindering spirometry or 2CT, and those below 18 and above 70 yr were excluded. The treating physician identified the ‘normal’ subjects from the healthy attendants accompanying the patients at the OPD. These participants belonged to the same age group as the patients included in the research. The criteria for inclusion were: (i) no active or recent history of any disease symptoms, (ii) no history of any known morbidity, (iii) no history of consuming any medication regularly for any reason in recent months, and (iv) having a personal appreciation of ‘normal health’. They were further evaluated with a chest X-ray (PA view) and spirometry, observing the European Respiratory Standard (ERS) standard10; anyone having any abnormality was excluded from the study.
Collecting subjective sickness score on a ‘0’ to ‘10’ scale based on severity
All the participants (both symptomatic and ‘normal’) scored their subjective appreciation of ‘sickness’ (if present), on a ‘0’ to ‘10’ scale (‘0’ being none and ‘10’ denoting maximum possible). This was done following a satisfactory pilot observation (Supplementary Fig. 1) with a smaller number of patients (n=30), which proved the feasibility of the use of such visual analogue scale (VAS). We termed such scoring as patients’ perception-based sickness score (PPSS) since it reflects an individual’s perception of the level of ‘sickness’
Uniform application of 2-chair test
Experienced technicians ensured the quality of the test performed the 2CT in the both groups of participants (‘normal’ and diseased) according to the published protocol7.The test mandates a person to rest first on a chair till the pulse rate (PR) and SpO2 are stabilized over 30 sec. Then, the person moves up to sit on another chair placed five feet away and facing the first one, and then immediately return to the first chair at his/her pace. The continuous performance of five such up and down movements completes the exercise protocol. The PR and SpO2 are measured immediately following the cessation of exercise and then at every 10 sec for 2 min. We used a simple software capable of both graphical and numerical display of the collected data (Fig. 1). Any ‘normal’ person showing >1% desaturation at any point in the 2CT were excluded from the protocol.
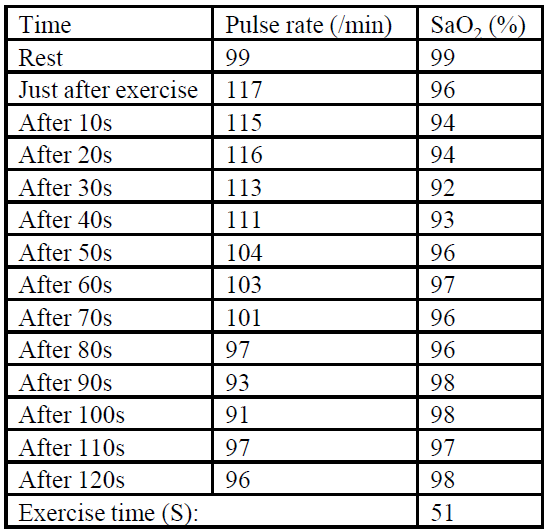
- Numerical representation of the 2-chair test data by the software used for data collection.
The PR-related variables were minimum PR (observed during the test at rest), maximum PR after exercise, maximum PR change (the difference between the minimum and the maximum PR), cumulative PR change (the summation of the deviation of PR at each point of measurements), and duration of tachycardia (PR>100). The maximum SpO2 (recorded maximum saturation at rest), minimum SpO2 (minimum saturation measured post-exercise), maximum desaturation or the desat-max (the maximum fall of saturation from baseline), and cumulative desaturation (adding up all the post-exercise desaturation values) formed the SpO2 related variable.
Statistical calculations to serve the objective
The data collected were charted and compared between the ‘normal’ and the ‘symptomatic diseased group’ with an unpaired Student’s t-test. A significant difference was at the level of P<0.05. Selected 2CT variables showing a statistically significant intergroup difference were used independently to see co-relationship to the PPSS (Fig. 2) to identify the best correlating variable by preparing a correlation matrix using the correlation coefficients of all the variables of 2CT (Supplementary Fig. 2).
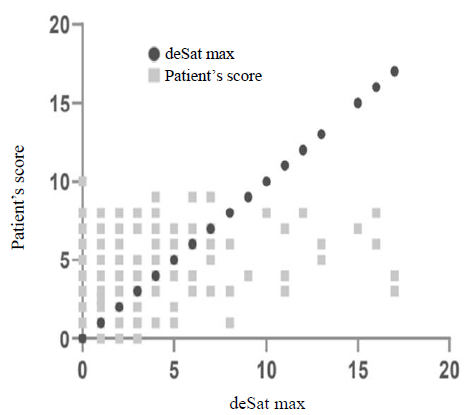
- Displays the correlation between the desat max and the patients’ score of perceived sickness (PPSS).
Further, we used a free web-tool ‘metaboanalyst-version 6.0’ ( https://dev.metaboanalyst.ca/ModuleView.xhtml ), to examine the relative importance of the different parameters to influence the sickness and displayed it in a VIP plot through multivariate analysis. We used the clustering of different groups based on 2CT parameters using orthogonal PLSDA 2D score plots. In addition, we made a principal component analysis of the two groups of participants (healthy and symptomatic) on the 2CT data separately. Simultaneously, the weight of the co-relation coefficients of different 2CT parameters was displayed using a pattern hunter chart.
Results
A total of 419 patients (Mean age in yr=55.046±17.231; M:F=280:139) and 30 ‘normal’ controls (Mean age in yr=43.166±10.357; M:F=19:11) were included for statistical comparison. The results (Table I) showed a very significant difference in PPSS score between the two groups (P=<0.0001). Out of the parameters of 2CT, the maximum PR change showed the best significance in differentiation between the normal and diseased persons (P=0.0086), followed by maximum or highest SpO2 (P=0.0151), minimum SpO2 (P=0.0270), and the desat-max (P=0.026) (Table I).
| Parameters | Patient group | Mean±SD | P value |
|---|---|---|---|
| De-sat max | Symptomatic diseased persons | 2.1103±2.802 | 0.026 |
| Normal | 0.8333±0.5527 | ||
| Patient’s perceived sickness score (PPSS) | Symptomatic diseased persons | 4.0012±2.097 | <0.0001 |
| Normal | 0.5±0.645 | ||
| Minimum PR | Symptomatic diseased persons | 92.6014±40.8414 | 0.292 |
| Normal | 74.208±18.287 | ||
| Maximum PR | Symptomatic diseased persons | 101.686±19.989 | 0.748 |
| Normal | 103.043±12.231 | ||
| PR change max | Symptomatic diseased persons | 43.107±34.237 | 0.0086 |
| Normal | 24.541±12.519 | ||
| Duration of tachycardia | Symptomatic diseased persons | 35.725±35.608 | 0.2033 |
| Normal | 26.25±29.973 | ||
| Maximum SpO2 | Symptomatic diseased persons | 95.714±13.181 | 0.0151 |
| Normal | 94.291±19.671 | ||
| Minimum SpO2 | Symptomatic diseased persons | 96.014±3.005 | 0.027 |
| Normal | 93.304±19.909 | ||
| Cumulative desaturation | Symptomatic diseased persons | 0.179±32.264 | 0.5355 |
| Normal | 3.916±4.494 | ||
| Cumulative PR change | Symptomatic diseased persons | 99.555±86.507 | 0.2978 |
| Normal | 118.333±68.492 |
PR, pulse rate; SpO2, peripheral capillary oxygen saturation; De-sat Max, maximum desaturation from base line
Further, we looked for correlations between the four parameters of the PPSS (differentiating the ‘sick’ patients from the ‘normal’ group significantly; Table I). It revealed that the desat-max performed the best of the four (change in PR max, minimum and maximum SpO2, and desat-max) so far the correlation coefficients were concerned (Table II). The co-relationship of the desat-max with PPSS is displayed in figure 2.
| 2CT item co-relating to PPSS score | Correlation coefficient | |
|---|---|---|
| (r) | R2 | |
| Change in PR max | 0.096 | 0.00001296 |
| Minimum SpO2 | -0.218 | 0.047524 |
| Maximum SpO2 | -0.151 | 0.022801 |
| Desat-max | -0.2705 | 0.07317025 |
Both the VIP plot and ‘pattern hunter’ displayed the desat-max as the best available 2CT parameters (Fig. 3A and B). The clustering (2-dimensional and 3-dimensional) of the two groups based on desat-max using orthogonal PLSDA 2D score plots are displayed in figure 4A and B (Supplementary Fig. 3; Supplementary Table I, II and III).
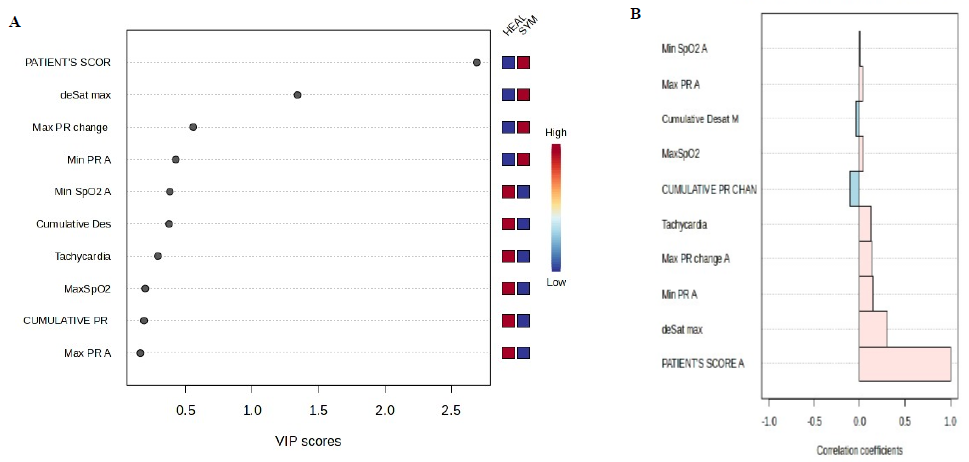
- Displays the relative strength of the desat-max being the best out of the all the other parameters to indicate the perceived sickness in the form of (A) VIP plot and (B) pattern hunter plot.
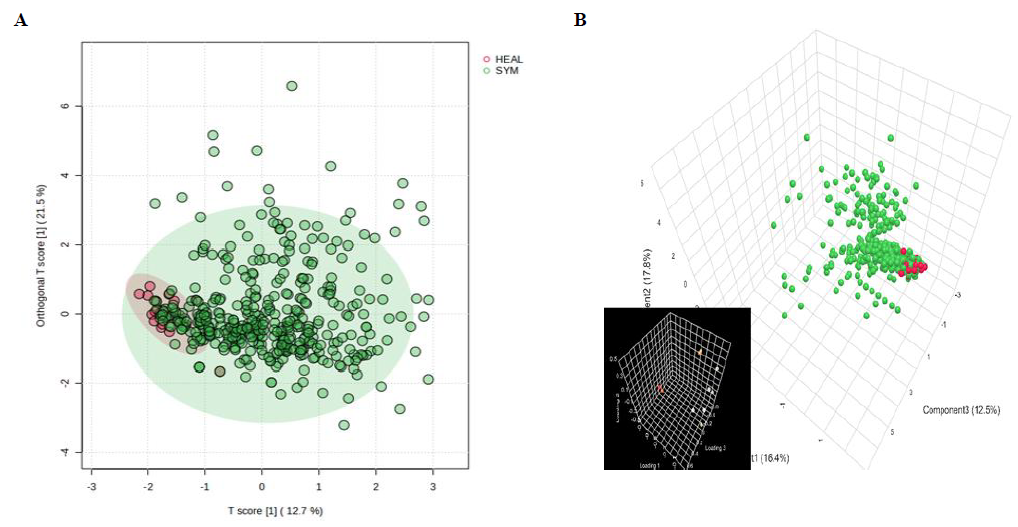
- Displays the scatter plot with the normal (red dots) and the symptomatic and diseased (green dots) in (A) 2 dimensional and (B) three dimensional.
Discussion
The results of our investigation revealed that maximum PR change, minimum SpO2, maximum SpO2, and desat-max differed significantly between normal participants and diseased patients. Of them, the desat max correlated best to the PPSS and appeared most discriminating on the VIP and pattern-hunter plots.
It was intriguing how the desat-max turned out to be the parameter reflecting the PPSS while the change in maximum PR (PR max) and other parameters differentiated between ‘normal’ and symptomatic patients even better than desat-max (Table I). The reasons are likely embedded in the hosts’ multiple and complex physiological changes that need to be investigated with experiments on the physiology of post-exercise desaturation.
One possible mechanism could be that in the post-exercise state, the PR changes under autonomic control, reflecting a primary cardiac or cardiovascular functional recovery, while the change in SpO2 (in both degree and pace of recovery) appears dependent on factors like mixed venous oxygen concentration, the ventilation/perfusion relationship, the FiO2, and the performance of both the ventricles. In addition, the variation of PR is far bigger (60 to 100) than SpO2 (95 to 100) in normal health. Hence, it is natural for a PR change to achieve a difference of significance far more easily than a SpO2 change. Therefore, the SpO2-based parameters achieving significance in the comparison between normal and abnormal may be considered more meaningful. It seems that the threshold for change has been set at a lower level for PR than SpO2 both in normal and diseased states in post-exercise observations. Therefore, a relatively lower difference of significance (Table I) for the SpO2 may reflect much bigger physiological disturbances.
The clusters showing an overlap between normal and abnormal appeared interesting. This reflects the following possibilities: (i) presence of a latent disease affecting the desaturation, (ii) a perceptual failure of subjects to appreciate sickness marked by de-saturation, or (iii) inclusion of some diseases that may not affect any SpO2 change. All the three possibilities need investigations, and one needs to find a better and more objective parameter than the sickness score to appreciate the abnormal physiology. That a patient is sick but not de-saturating is also possible if the sensitivity of detection is low or the background physiological status remains good enough to compensate for the process of desaturation. Such situations mean that the desat-max is a poor parameter to reflect sickness in many. Thus, the exercise may be a way forward to determine or identify a poor perceptor and a good reservoir-holder reflecting two different physiological statuses of the population under research. We have seen such events of poor perception in patients having ‘happy hypoxia’ during the COVID-19 pandemic. This leads us to a very interesting interaction between the psycho-behavioural and cardiopulmonary domains. Since, theoretically, both respiratory and the cardiovascular pathology can cause and influence desaturation, it is important to understand the interaction between the two systems. Another possibility is that the co-relationship of desat-max with the PPSS might have been dragged to a lower level, possibly due to the poor association of perceived sickness in patients with relatively higher desaturation (Fig. 2). This could be possible because of psychological adjustment of patients with chronic debilitating illness or blunting of the perception quality of the seriousness of sickness. This merits future research. The overlap of parameters of the diseased patients in the normal range of desaturation is interesting. We chose patients with clinically isolated upper respiratory tract diseases (e.g., allergic rhinitis) that may have none or trivially significant cardiopulmonary effects altogether. The inclusion of such patients might have contributed to the overlap.
The measurement had a limitation that it could not capture values between two units (like 95 and 96% of SpO2). A more sensitive measurement using a decimal scale recording (viz., 95.46%, 96.28%) could have helped identifying a more precise cut-off of desat-max. Our results were in favour of desat-max as the one to appreciate sickness by the 2CT. It implied that this simple parameter of post-exercise recovery response (PERR) could distinguish an abnormal state of cardio-pulmonary health from normal.
Exercise tests have been in vogue in clinical practice for a long time. The 6 MWT has been a useful validated test that counts the walk distance and has played important role in the assessment of the change in a disease state11-13, functional status4,14,15, and prognostications16,17. Evolved to substitute the 6MWT, the 2CT appears to belong to a different class altogether. While the 6MWT measures the distance walked, or the functional capacity, the 2CT actually accounts for the post-exercise changes in PR and SpO2 allowing it to be marked as a cardiopulmonary reserve-specific test.
Exercise means a complex integration where multiple systems act in tandem. The predominant output of the locomotor system is supported by the cardio-respiratory system and controlled by neurological inputs. However, when the subjects cease to exercise (i.e., at the immediate post-exercise state), the locomotor system is brought to rest, neural inputs change the pattern, and there is a readjustment of the cardio-pulmonary system to return to the pre-exercise status. This readjustment or the functional return of cardio-pulmonary systems is designated as PERR, the understanding of which, through the changes in PR and SpO2 at the recovery response, appears novel. The desat-max of 2CT can identify poor cardiopulmonary readjustment in patients.
Post exercise physiology of recovery response has been an issue in research for a long time in sports medicine18-21. The heart rate (HR) variation following exercise is regarded as a research domain on autonomic activity22. There have been several works on HR recovery despite methodological issues, and researchers have tried to appreciate the cardiac autonomic response using HR and systolic time interval23. Delayed fall in HR after exercise was thought to be a prognostic marker, and a fall of less than 12 beats per minute from the peak rate was regarded as abnormal. Such delayed decrease in the heart rate response (HRR) was found to predictmortality24. In applies to chronic heart failure patients where the parameter acted as an independent prognostic factor25. Such HRR could predict mortality independently in suspected coronary artery disease, even after taking into account the left ventricular function, exercise capacity, and angiographic severity of CAD26. Such post-exercise HRR has been seen to be accelerated in exercise and blunted in patients with chronic heart failure27.
Exercise-induced desaturation has been noticed in COPD and interstitial lung disease (ILD) patients28-30, but post-exercise desaturation has not received that much attention for any heart or lung disease, except some recent interests2,3.
The present study had several limitations. A higher number of ‘normal’ participants or ‘controls’ would have been better. There is inclusion of patients from a pulmonary clinic only since we work in the subspecialty of pulmonology. However, including patients with primary cardiovascular diseases could have added strength to our investigation. Although we used PPSS due to ease of using and we chose ‘sickness’ as a yardstick of measurement of diseases, these were not specific to cardiopulmonary illness.
In conclusion, the role of 2CT in clinical practice for screening populations for diseases, identifying individuals for further evaluations, offering proper medications, monitoring the course of a disease, and assessing prognostication merits wider research.
Acknowledgment
The authors acknowledge all the staff of Institute of Pulmocare and Research, Kolkata and all the study participants who willingly participated in this study.
Financial support & sponsorship
None.
Conflicts of Interest
None.
Use of Artificial Intelligence (AI)-Assisted Technology for manuscript preparation
The authors confirm that there was no use of AI-assisted technology for assisting in the writing of the manuscript and no images were manipulated using AI.
References
- ACC/AHA 2002 guideline update for exercise testing: Summary article: A report of the American College of Cardiology/American Heart Association task force on practice guidelines (Committee to update the 1997 exercise testing guidelines) Circulation. 2002;106:1883-92.
- [CrossRef] [PubMed] [Google Scholar]
- ATS statement: Guidelines for the six-minute walk test. Am J Respir Crit Care Med. 2002;166:111-7.
- [CrossRef] [PubMed] [Google Scholar]
- Reference equations for the six-minute walk in healthy adults. Am J Respir Crit Care Med. 1998;158:1384-7.
- [CrossRef] [PubMed] [Google Scholar]
- The six-minute walk test predicts peak oxygen uptake and survival in patients with advanced heart failure. Chest. 1996;110:325-32.
- [CrossRef] [PubMed] [Google Scholar]
- Meaningful change in 6-minute walk in people with peripheral artery disease. J Vasc Surg. 2021;73:267-76.
- [CrossRef] [PubMed] [PubMed Central] [Google Scholar]
- Incremental shuttle and six-minute walking tests in the assessment of functional capacity in chronic heart failure. Can J Cardiol. 2008;24:131-5.
- [CrossRef] [PubMed] [PubMed Central] [Google Scholar]
- Two chair test: A substitute of 6 min walk test appear cardiopulmonary reserve specific. BMJ Open Respir Res. 2020;7:e000447.
- [CrossRef] [PubMed] [PubMed Central] [Google Scholar]
- Post exercise desaturation can help identifying treatment responders of COPD pulmonary hypertension in real world: an appraisal. J Pulm Respir Med. 2018;8:2.
- [CrossRef] [Google Scholar]
- Hemodynamic endorsement of post-exercise desaturation-based decision of treating COPD-PH: A pilot observation. J Pulm Respir Med. 2020;10:1000499.
- [Google Scholar]
- Standardization of spirometry 2019 update An official American thoracic society and European Respiratory Society technical statement. Am J Respir Crit Care Med. 2019;200:e70-e88.
- [CrossRef] [PubMed] [PubMed Central] [Google Scholar]
- Reproducibility and responsiveness of quality of life assessment and six minute walk test in elderly heart failure patients. Heart. 1998;80:377-82.
- [CrossRef] [PubMed] [Google Scholar]
- Oxygen desaturation and breathlessness during corridor walking in chronic obstructive pulmonary disease: Effect of oxitropium bromide. Thorax. 1993;48:1145-50.
- [CrossRef] [PubMed] [Google Scholar]
- A qualitative systematic overview of the measurement properties of functional walk tests used in the cardiorespiratory domain. Chest. 2001;119:256-70.
- [CrossRef] [PubMed] [Google Scholar]
- Analysis of clinical methods used to evaluate dyspnea in patients with chronic obstructive pulmonary disease. Am J Respir Crit Care Med. 1998;158:1185-9.
- [CrossRef] [PubMed] [Google Scholar]
- The 6-minute walk as an appropriate exercise test in elderly patients with chronic heart failure. J Gerontol A Biol Sci Med Sci. 1996;51:M147-51.
- [CrossRef] [PubMed] [Google Scholar]
- The 6-min walking distance: long-term follow up in patients with COPD. Eur Respir J 2007. ;29:535-40.
- [CrossRef] [Google Scholar]
- Predictive factors of hospitalization for acute exacerbation in a series of 64 patients with chronic obstructive pulmonary disease. Am J Respir Crit Care Med. 1999;159:158-64.
- [CrossRef] [PubMed] [Google Scholar]
- Effect of exercise intensity on post-exercise oxygen consumption and heart rate recovery. Eur J Appl Physiol. 2014;114:1809-20.
- [CrossRef] [PubMed] [Google Scholar]
- Specificity and context in post-exercise recovery: It is not a one-size-fits-all approach. Front Physiol. 2015;6:130.
- [CrossRef] [PubMed] [PubMed Central] [Google Scholar]
- Physiological and nutritional aspects of post-exercise recovery: Specific recommendations for female athletes. Sports Med. 2011;41:861-82.
- [CrossRef] [PubMed] [Google Scholar]
- Post-exercise heart-rate recovery correlates to resting heart-rate variability in healthy men. Clin Auton Res. 2016;26:415-21.
- [CrossRef] [PubMed] [Google Scholar]
- Submaximal exercise intensity modulates acute post-exercise heart rate variability. Eur J Appl Physiol. 2016;116:697-706.
- [CrossRef] [PubMed] [Google Scholar]
- Cardiac autonomic responses during exercise and post-exercise recovery using heart rate variability and systolic time intervals – A review. Front Physiol. 2017;8:301.
- [CrossRef] [PubMed] [PubMed Central] [Google Scholar]
- Heart-rate recovery immediately after exercise as a predictor of mortality. N Engl J Med. 1999;341:1351-7.
- [CrossRef] [PubMed] [Google Scholar]
- Early heart rate recovery after exercise predicts mortality in patients with chronic heart failure. Int J Cardiol. 2006;110:393-400.
- [CrossRef] [PubMed] [Google Scholar]
- Heart rate recovery after exercise is a predictor of mortality, independent of the angiographic severity of coronary disease. J Am Coll Cardiol. 2003;42:831-8.
- [CrossRef] [PubMed] [Google Scholar]
- Vagally mediated heart rate recovery after exercise is accelerated in athletes but blunted in patients with chronic heart failure. J Am Coll Cardiol. 1994;24:1529-35.
- [CrossRef] [PubMed] [Google Scholar]
- Exercise-induced desaturation in patients with chronic obstructive pulmonary disease on six-minute walk test. Lung India. 2015;32:320-5.
- [CrossRef] [PubMed] [PubMed Central] [Google Scholar]
- Prevalence and prediction of exercise-induced oxygen desaturation in patients with chronic obstructive pulmonary disease. Respiration. 2012;84:353-9.
- [CrossRef] [PubMed] [Google Scholar]
- Exertional desaturation is more severe in idiopathic pulmonary fibrosis than in other interstitial lung diseases. Phys Ther Res. 2023;26:32-7.
- [CrossRef] [PubMed] [PubMed Central] [Google Scholar]


