
Translate this page into:
Strategies for ending tuberculosis in the South-East Asian Region: A modelling approach
For correspondence: Dr Nimalan Arinaminpathy, Department of Infectious Disease Epidemiology, St. Mary's Hospital, Imperial College London, London, UK e-mail: nim.pathy@imperial.ac.uks
-
Received: ,
This is an open access journal, and articles are distributed under the terms of the Creative Commons Attribution-NonCommercial-ShareAlike 4.0 License, which allows others to remix, tweak, and build upon the work non-commercially, as long as appropriate credit is given and the new creations are licensed under the identical terms.
This article was originally published by Wolters Kluwer - Medknow and was migrated to Scientific Scholar after the change of Publisher.
Abstract
Background & objectives:
To support recent political commitments to end tuberculosis (TB) in the World Health Organization South-East Asian Region (SEAR), there is a need to understand by what measures, and with what investment, these goals could be reached. These questions were addressed by using mathematical models of TB transmission by doing the analysis on a country-by-country basis in SEAR.
Methods:
A dynamical model of TB transmission was developed, in consultation with each of the 11 countries in the SEAR. Three intervention scenarios were examined: (i) strengthening basic TB services (including private sector engagement), (ii) accelerating TB case-finding and notification, and (iii) deployment of a prognostic biomarker test by 2025, to guide mass preventive therapy of latent TB infection. Each scenario was built on the preceding ones, in successive combination.
Results:
Comprehensive improvements in basic TB services by 2020, in combination with accelerated case-finding to increase TB detection by at least two-fold by 2020, could lead to a reduction in TB incidence rates in SEAR by 67.3 per cent [95% credible intervals (CrI) 65.3-69.8] and TB deaths by 80.9 per cent (95% CrI 77.9-84.7) in 2035, relative to 2015. These interventions alone would require an additional investment of at least US$ 25 billion. However, their combined effect is insufficient to reach the end TB targets of 80 per cent by 2030 and 90 per cent by 2035. Model projections show how additionally, deployment of a biomarker test by 2025 could end TB in the region by 2035. Targeting specific risk groups, such as slum dwellers, could mitigate the coverage needed in the general population, to end TB in the Region.
Interpretation & conclusions:
While the scale-up of currently available strategies may play an important role in averting TB cases and deaths in the Region, there will ultimately be a need for novel, mass preventive measures, to meet the end TB goals. Achieving these impacts will require a substantial escalation in funding for TB control in the Region.
Keywords
Burden
end TB
epidemiology
modelling
public health
SEAR
tuberculosis

The World Health Organization (WHO) South-East Asian Region (SEAR) bears a disproportionate burden of tuberculosis (TB). In 2015, the 11 countries of this Region accounted for 25 per cent of the world's population but 40 per cent of global TB deaths, the highest of any of the WHO regions1. The Region includes India and Indonesia, two countries with high absolute numbers of TB cases, that together account for an estimated 37 per cent of global TB incidence12. Overall, therefore, progress in global TB control depends critically on the success of TB control in SEAR.
All countries in SEAR have adopted the end TB strategy, which sets ambitious targets for ending TB by 20353. Despite such broad political commitment, however, countries in the Region are faced with a range of challenges stemming from human and financial resource constraints and compounded by sociodemographic problems456. Many countries in the Region have a sizeable health sector outside the national TB programmes (NTPs) that often fails to notify TB cases to public health authorities7891011. Early detection of TB is additionally complicated by stigma, lack of awareness and underinvestment1213. Drug-resistant-TB (DR-TB) is becoming an increasing concern1415, while some countries also have a high burden of HIV co-infection. As a result of these and other challenges, TB incidence in the Region continues to decline at an estimated rate of only 1-2 per cent per year1.
These circumstances raise important questions: how does the Region translate political commitment into interventions that lead towards ending TB? It is clear that current interventions (private sector engagement and accelerated case-finding, among other measures) will need to be taken to far larger scales than current levels, and that innovative interventions need to be developed and scaled up, with a focus on intensified case-finding. There is a need to estimate the levels of implementation, coverage and funding required to meet the end TB goals in the Region.
Here, we addressed these questions using mathematical models of TB transmission. Such models offer a helpful framework for capturing the dynamics of TB transmission, as well as the complexity of healthcare systems characteristic of many countries in the Region161718. The analysis was conducted on a country-by-country basis. Input was gathered from each of the NTPs through WHO country offices in the Region and published literature on indicators, assumptions and intervention scenarios used in the model. As a guide to the resources needed, a costing exercise, fully integrated with the transmission model was additionally conducted.
Material & Methods
Fig. 1 shows the overall model structure. The model explicitly captures the national TB programme (NTP) and non-NTP sectors, and the respective standard of TB care in these sectors. In doing so, the model also captures the implications of diagnostic delays and treatment outcomes, for overall transmission. For simplicity, the model does not distinguish age groups and is nationally aggregated. However, it incorporates HIV/TB co-infection, as well as 'risk groups' bearing a disproportionate TB burden, and the generation and transmission of drug-resistant TB (DR-TB). Key structural elements were as follows:
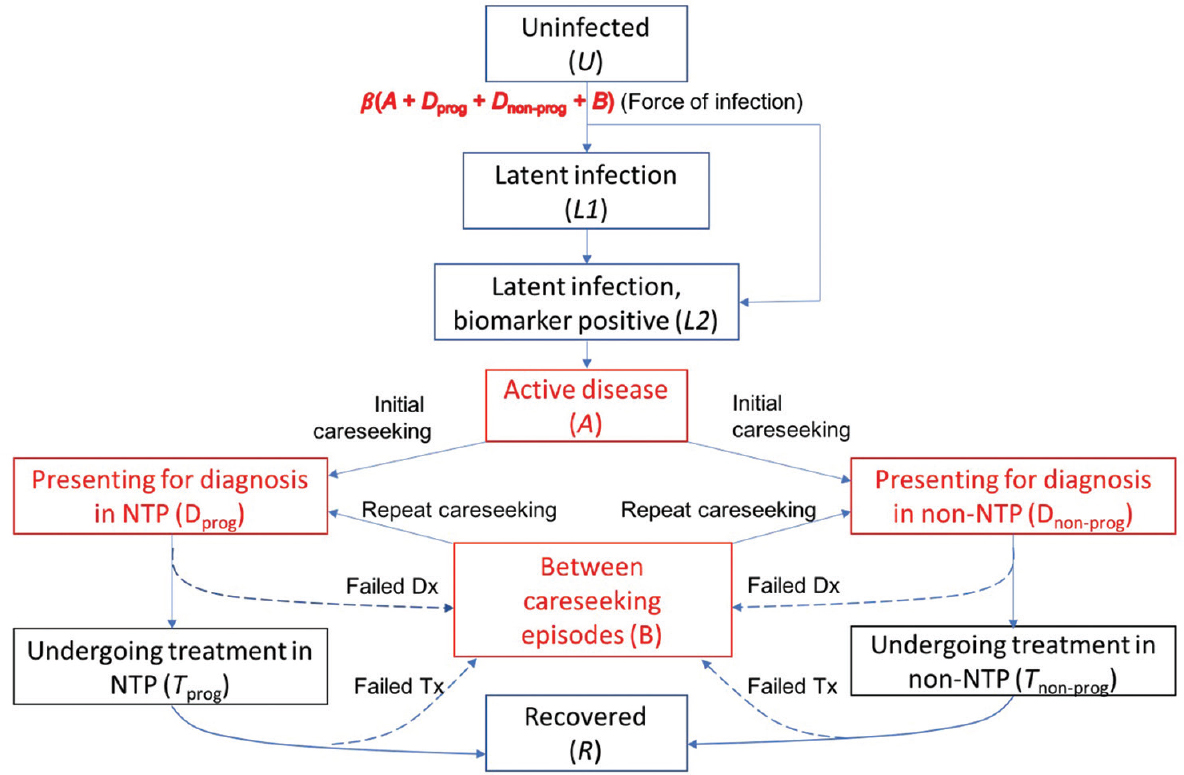
- Illustration of the basic model structure, replicated by HIV, drug resistance and risk-group status. Compartments in red denote states that are infectious. The NTP (national TB programme) (left-hand side) sector is distinguished from the non-NTP sector (right-hand side). Among latent infection, it is assumed that those who are most at risk of developing disease within the next two years are detectable using a hypothetical, future diagnostic test. Not shown on this figure for clarity, the model also incorporates tuberculosis mortality, as well as recurrent tuberculosis (the latter including relapse of an existing infection, and exogenous reinfection).
Among people having latent TB infection, 'incipient TB' cases are distinguished as those who would develop active TB disease within the next two years19. It is assumed that after patients develop active disease, they undergo an initial delay before first presenting for care (for example, as their symptoms develop in intensity) - often referred to as the 'patient delay'. This delay was estimated, together with the infectiousness per case, to country-specific epidemiological data (
On seeking care, it is assumed that a proportion p of patients visit the NTP, while the remainder seek care in the non-NTP sector: the latter broadly including pharmacies and traditional healers, as well as physicians and hospitals that are not involved with NTP. These 'non-NTP' providers generally have a lower standard of TB care than the NTP (substandard diagnosis as well as a general lack of treatment adherence) as well as not reporting TB cases to the programme781020. This difference was captured as a lower probability of TB diagnosis per patient visit, and a lower treatment completion rate, among non-NTP than among NTP providers. With limited systematic evidence to inform these parameters quantitatively, a range of values was assumed (Supplementary Table II available from http://www.ijmr.org.in/articles/2019/149/4/images/IndianJMedRes_2019_149_4_517_262877_sm7.pdf). To allow for exceptions such as Thailand, where non-NTP and NTP providers generally offer a similar quality of care, the same parameters were assumed for both. The proportion of patients approaching 'non-NTP' providers (p) is adjusted country-wise in such a way that simulated treatment initiations in the NTP agree with reported notifications from the public sector.
| Symbol | Meaning |
|---|---|
| q | Indicator variable for provider type: q = 0, 1 and 2, respectively, for NTP providers, non-NTP providers and ‘engaged’ non-NTP providers, respectively |
| r | Indicator variable for risk group: r = 0 and 1, respectively, for the general population and the ‘vulnerable’ group |
| s | Indicator variable for strain: s = 0 and 1, respectively, for DS- and DR-TB |
| Ur | Proportion uninfected in risk group r |
| Lrs | Proportion in group r having latent infection with strain s |
| Mrs | Proportion in group r having incipient TB with strain s |
| Irs | Proportion in group r having active disease with strain s, that has not yet presented for care |
| Dqrs | Proportion in group r awaiting diagnosis with provider type q |
| Fqrs | Proportion in group r undergoing first-line TB treatment with provider type q |
| Sqrs | Proportion in group r undergoing second-line TB treatment with provider type q |
| Brs | Proportion who have temporarily dropped out of care cascade |
NTP, national TB programme; TB, tuberculosis; DR, drug resistance; DS, drug-sensitive
| Parameter name | Symbol | Value | Note/source |
|---|---|---|---|
| Natural history parameters | |||
| Average infections per infectious TB case per year | |||
| Drug-susceptible TB | β | Calibrated to yield incidence and prevalence for given country setting | |
| Drug-resistant TB | βDR | ||
| Proportion of infections undergoing rapid progression | |||
| General population | f0 | 0.14 | Vynnycky and Fine1 |
| Vulnerable group | f1 | Taken as kf0 where k >1 is calibrated to yield relative risk of TB in the vulnerable population | |
| HIV coinfected | fh | 0.37 | Sergeev et al2 |
| Rate of breakdown to incipient disease | |||
| General population | g0 | 0.001 y−1 | Horsburgh et al3 |
| Vulnerable group | g1 | Taken as kg0, where k is as noted above | |
| HIV coinfected | gh | 0.023 y−1 | Horsburgh et al3 |
| Per-capita hazard of progression from incipient TB to active disease | h | 0.5 | Assumption that ‘incipient’ disease includes those at risk of developing disease within two year |
| Per-capita relapse rate | ρ | 0.0017 y−1 | Corresponding to 10% lifetime risk4, 5 |
| Per-capita rate of self-cure, active TB | σ | 0.166 y−1 | Together corresponds to 50% spontaneous cure, 50% mortality in average of three years6 |
| Per-capita mortality hazard rate, active TB | µTB | 0.166 y−1 | |
| Care cascade parameters, first line | |||
| Per-capita rate of first presentation to a provider following onset of symptoms | c | Governs the initial patient delay: Calibrated together with β, βDR to yield incidence and prevalence | |
| Probability that a TB patient visits a provider of type q, per careseeking attempt | pq | Calibrated for simulated treatment initiations to match reported notifications | |
| Per-capita rate of offering a diagnosis | d | 52 y−1 | Assumption: Corresponds to an average of one week to arrive at a diagnosis |
| Probability of successful diagnosis and treatment initiation with provider type q | uq | Calculated using uq = pq(Dx) pq(Tx) for values of pq(Dx) ,pq(Rx) given below | |
| Per-capita rate of default from treatment from provider type q | δq | Calculated using dq =t (FL)pq(FL) / (1 - pq(FL)) for values of t (FL), pq(Dx) given below | |
| Probability of correct TB diagnosis per visit to a provider | |||
| NTP provider | p0(Dx) | 0.83 (0.8-0.85) | Subbaraman et al7,a |
| Non-NTP provider | p1(Dx) | 0.7 (0.6-0.8) | Assumedb |
| Proportion of diagnosed cases initiating treatment | |||
| NTP provider | p0(Rx) | 0.88 (0.85-0.9) | Subbaraman et al7,a |
| Non-NTP provider | p1(Rx) | 0.7 (0.6-0.8) | Assumedb |
| Proportion completing first-line treatment | |||
| NTP provider | p0(FL) | Drawn from WHO country reports8 | |
| Non-NTP provider | p1(FL) | 0.6 (0.5-0.7) | Assumedb |
| Care cascade, second line | |||
| Probability of provider offering second-line testing at point of TB diagnosis (in absence of Xpert) | |||
| NTP provider | v0 | 0.2 | From baseline data of GeneXpert demonstration study in India9 |
| Non-NTP provider | v1 | 0.1 | Assumption |
| Proportion of first-line treatment failures being switched to second-line treatment | |||
| NTP provider | w0 | Calibrated for simulated, second-line treatment initiations to match reported DR-TB notifications8 | |
| Non-NTP provider | w1 | 0.1 | Assumption |
| Proportion treatment success, second-line treatment | |||
| NTP provider | p0(SL) | 0.5 | Taken from country reports where available8 |
| Non-NTP provider | p1(SL) | 0.2 | Assumption |
| Other care parameters | |||
| Duration of first-line regimen | τ(FL) | 2 y−1 | Corresponds to a six-month regimen10 |
| Duration of second-line regimen | τ(SL) | 0.5 y−1 | Corresponds to a two-year regimen10 |
| Rate of repeat care seeking for patients who have dropped out of care cascade | γ | 6-25 y−1 | Yields an interval between careseeking episodes with uncertainty range of two week to two months11 |
| Population structure | |||
| Per-capita birth rate | b | Selected to yield projected population growth | |
| Per-capita ‘background’ mortality hazard | µ | 1/66 | Corresponding to a TB-free life expectancy of 66 yr for India (World Bank, adjusted to country-specific data) |
| Proportion of population in ‘high-risk’ group | 0.1 (0.05-0.15) | Risk groups are specific groups with disproportionate TB burden, having contact with the rest of the population, and being possible to focus on, for case-finding initiatives. Parameters given here are consistent with TB burden in urban slums in India12 | |
| Relative risk of TB in high-risk group, compared to general population | 3 (2-4) |
aUnless other country-specific information was available, we drew from a recent systematic review in India, of the public care cascade (Subbaraman et al)7. An exception is Bangladesh, where treatment initiation rates are estimated as 99%; bGiven a lack of systematic evidence quantifying the care cascade in the private sector in SEAR, we assumed the parameters specified here for each country, with the exception of Thailand, where the private healthcare sector has a good quality of TB care, but tends not to notify TB. Here, we assumed the same parameters for the care cascade as in the public sector. DR-TB, drug-resistant TB; SEAR, South-East Asian Region; TB, tuberculosis; NTP, national TB programme
| Programmes | Unit cost value (in US$) | Reference and comments |
|---|---|---|
| Diagnosis assumptions | ||
| Microscopy Diagnosis Programme | 2.3-8.5 per suspect tested | 2 x smear slides using a global cost of $0.7. Costs loaded for infrastructure and human resource delivery costs. Sputum smear microscopy (two smears) of $3.00 was used by Little et al21. Labour cost adjusted by relative GNI in each country. Varies from $2.3 to 8.5 across Region. Lowest cost in Nepal. There are large variations in Thai estimates from $10.5 to 1.1 for smear test alone22 |
| Culture + DST first-line programme | 20-35 per suspect tested | Conventional DST is required to determine drug susceptibility to drugs other than rifampicin and isoniazid. A consumable cost of $1.95 per test is taken from TB workbook global costs. Costs loaded for infrastructure and human resource delivery cost, with the assumed 48 min of laboratory technologist time generating a large cost. Solid first-line DST was estimated at $29.88 (Maheshwari et al23) while Vassall et al24 used $22.3 in their diagnostic costing study Labour cost adjusted by relative GNI in each country |
| Culture programme | 14-21 per suspect tested | Xpert replaces smear in routine diagnostic algorithm in the public sector. An Xpert MTB/RIF cost of $25 was used in by Little et al21. Vassall et al24 estimated a cost of $14.93 at Xpert (volume. 3.0 million/year) based on a consumable cost of US$11.7 including transport. A $12 Xpert consumable cost is outlined in the Global TB database of Avenir. This cost is loaded by 13% for infrastructure and a human resource delivery cost. Labour cost adjusted by relative GNI in each country |
| Screening X-ray programme | 11-12 per suspect tested | Taken from TB workbook global costs. Costs loaded for infrastructure, other and human resource delivery cost. $11 per X-ray in India from Vassall et al24. Labour cost adjusted by relative GNI in each country |
| Treatment assumptions | ||
| First-line TB treatment programme | 10 per patient month | A first-line budget estimate of $60 for first-line drugs included in the Global Plan resource projections for India17; and expenditures in the baseline are estimated to be $70 per case. A health system cost of $140 was also included. Over six months, the drugs component was $10 per month and health systems $23 per month. It is assumed $10 per month is borne by the national programme. The programme cost of first-line treatment is assumed to be similar for all SEAR countries |
| 20-month second-line TB treatment programme | 90 per patient month | A budget estimate of $1,030 for second-line drugs was included in the Global Plan resource projections for India17, expenditures in the baseline were estimated to be $2290 for second-line in India. A health system cost (hospital, ambulatory) was also included for DR-TB at $2,350 per case. Assuming a 20 months’ regime, this was equivalent to $52-115 per month. A laboratory support cost of $5-10 per month was also included. It is assumed $90 per month is borne by the national programme in our analysis for 20 months’ DR-TB treatment. Health system costs of $136 per month are reported with patient direct costs. The programme cost of second-line treatment is assumed to be similar for all SEAR countries |
| Nine-month second-line TB treatment programme | 85.3 per patient month | WHO guidance on implementation of the shorter second-line regimen25 noted that nine months’ treatment with the shorter second-line regimen cost was between US$500 and 700. About half of the cost was attributable to clofazimine alone. The medicines needed for a full course of treatment with longer second-line regimens can be four times as expensive. An average monthly cost of $78 per month is included for drugs (i.e., $700 divided by nine months) in nine months treatment plus laboratory support of $7.5 per month. Health system costs of $136 per month are reported with patient direct costs. The programme cost of second-line treatment is assumed to be similar for all SEAR countries |
| Private sector engagement | ||
| Cost per suspect | 2.5 per suspect | 1328 patients with TB were registered in the public-private artnership in Lalitpur municipality, Nepal over 36 months26. Median total cost involved in treating a TB patient in the PPP scheme is US$89.60 including start-up costs, of which $2.067 was training and social mobilization for providers26. A rate of $2.5 per suspect is assumed for all SEAR countries |
| Laboratory expansion | ||
| Cost per suspect | 2.3-8.5 per suspect tested | This intervention involves establishing more facilities for smear microscopy, leading to increased access to NTP services. Muniyandi et al28 investigated diagnosis costs in government health facilities, including subcentres situated in a TB unit of a rural district of Tamil Nadu in 2002. Costs included staff salary, costs incurred for reagents, drugs, maintenance, stationery and fuel. A cost of $0.26 (2010 USD) per smear test was calculated. Vassall et al24 examined costs in urban or periurban primary care health centres in India. Costs of building, overhead, staff, equipment and consumables, quality control and maintenance and calibration inputs were estimated. The cost of one smear was $1.13 (2010 USD) and culture LJ: Lowenstein-Jensen $13.56. Sohn et al29 estimated Thai costs in 2007-2008 including building space, equipment, staff, laboratory consumables and chemicals and recurrent costs. The cost for fluorescence microscopy was $1.08 and Ziehl-Neelsen $1.21 for smear test alone |
| New diagnostics | ||
| Xpert MTB/RIF | India $15 per suspect tested in India | 15 per test in India. Includes $12 consumable, capital cost of 13% total cost from Vassal24 and labour cost based on laboratory technician cost of 34 min. Labour cost adjusted using relative GNI for rest of SEAR |
| Improved NTP sector treatment | ||
| Treatment support | $17 per initiating patient | Menzies et al3 included an incentive of $10.5 per patient per month, which included transport and administration allowance. Richter et al30 analyzed GF proposals’ benefits for 240 000 people with a value of US$4.3 m, equivalent to average US$17 per person per annum. This estimate is used in our study |
| Contact tracing | ||
| Cost per suspect screened | 4-26 | The Cambodian programme cost (US$) from 35,000 household and neighbourhood contacts identifying 810 bacteriologically confirmed cases was $10.3 per contact screened. Suspects were screened, and those with symptoms were tested by Xpert. Menzies et al15 assumed a cost of $36.6 per active suspect based on twice the current passive screening cost in China - as the intervention is not being widely conducted. In India, a cost of $23 per suspect was included in their study. This accounted for incentives, all Xpert, X-ray and 3 visits. It is assumed that all contact suspects get verbal assessment, 30% get smear and 10% X-ray. An active case finding labour cost of $5 per suspect (indexed by relative GNI) is included for all countries using budget expenditure from Cambodia |
| Community referrals | ||
| Community referral is assumed to be $2 per suspect less expensive than contact tracing due to use of community networks | ||
DR-TB, drug-resistant TB; SEAR, South-East Asian Region; TB, tuberculosis; NTP, national TB programme; GNI, gross national income; DST, drug susceptibility testing
The model is constructed so that any patients missed from the TB care cascade (because of failed diagnosis, initial or subsequent default) enter the compartment B, representing those who have temporarily dropped out of careseeking. These patients are still infectious: they remain for an average of one month before seeking care, again with a probability p of choosing the NTP sector. Quantities governing the TB care cascade in the NTP and non-NTP sectors are shown in the Supplementary Table II (available from http://www.ijmr.org.in/articles/2019/149/4/images/IndianJMedRes_2019_149_4_517_262877_sm7.pdf).
The model captures the acquisition and transmission of drug resistance to first-line therapy: rifampicin-resistant and multi-drug-resistant TB (MDR-TB) were collectively referred to as 'drug-resistant' (DR)-TB, requiring second-line TB treatment. Laboratory-based drug susceptibility testing (e.g. through molecular tests or culture) is not universally available in the countries of the Region, and therefore, not routinely conducted. It was assumed that only a proportion g of cases identified in the public sector are subject to drug susceptibility testing: the value was calibrated to yield reported DR-TB notifications from the programme. Those not identified as DR-TB were assumed to undergo first-line treatment, and to remain infectious with DR-TB during this time: upon failing first-line treatment, a certain proportion were switched to second-line therapy.
We did not explicitly model the dynamics of HIV: instead, it was assumed that a time-dependent proportion h of new TB cases were HIV coinfected, drawing the value of h from WHO estimates. Individuals with HIV/TB infection have an elevated risk of developing active disease, with parameter values informed by the literature (Supplementary Table II available from http://www.ijmr.org.in/articles/2019/149/4/images/IndianJMedRes_2019_149_4_517_262877_sm7.pdf). It was assumed that HIV-positive patients undergoing ART had the same risk of developing active disease, as HIV-negative TB infections.
We also considered the targeting of TB interventions. In particular, 'high-impact risk groups' were defined as population subgroups that bear a disproportionate TB burden, while also having sufficient contact with the general population, to play an important role in TB transmission. These groups may include, for example, slum populations or hospital outpatients21. In practice, the most appropriate risk groups for a given country would depend on many country-level factors, including the size and relative burden of TB in a given group, as well as the feasibility of targeting such a group for intervention. We did not aim to identify these groups for each country in the current study. There are insufficient data to parameterize each risk factor, along with interactions between overlapping factors. Instead, an illustrative scenario was adopted, one where 10 per cent of the population had three times the prevalence of active TB as in the general population. This scenario was intended to be illustrative rather than prescriptive, and is consistent with, for example, urban slums in India21. It was assumed that the concentrated burden in this high-impact risk group was mediated by an increased risk of reactivation relative to the general population, although we also explored other potential mechanisms in sensitivity analysis. We adopted broad uncertainty around these parameter values (Supplementary Table II available from http://www.ijmr.org.in/articles/2019/149/4/images/IndianJMedRes_2019_149_4_517_262877_sm7.pdf), while also exploring sensitivity of model findings to these assumptions.
Model calibration: Free parameters, calibrated separately to each country setting, included the mean annual infections per drug-susceptible TB case (β); the mean annual infections per DR-TB case (βDR); the mean, initial patient delay before first seeking care (d); the relative risk of re-activation following infection in the 'high-impact risk group' compared to the general population (m); the proportion of TB cases visiting an NTP provider at each care seeking attempt (p) and the proportion of TB diagnoses receiving a drug susceptibility test (g).
For each country setting, model inputs were calibrated to the following data: WHO estimates for incidence (all forms of TB) from 2006 to 2015; prevalence (all forms) in 2014 (the last year prevalence estimates were reported); estimated proportion of incident TB disease having DR-TB in 2015; TB notifications from 2000 to 2017 and DR-TB notifications from 2000 to 2017. India, the highest burden country in the Region, has also seen an upward revision of TB burden estimates22: In this case, prevalence estimates were used from pooled subnational prevalence surveys23. In addition, Indonesia recently saw a 15 per cent decrease in its estimated burden1; we used the most updated estimates, published in 20181.
The WHO estimates were used to construct independent log-normal distributions for each indicator and year. By evaluating the product of these likelihood terms, along with independent uniform priors for each of the model inputs, the posterior distribution for a given set of model inputs was evaluated. The Bayesian melding approach162425 was used to sample from the posterior distribution. This is a systematic way of propagating uncertainty from model inputs to outputs. We refer to the uncertainty intervals thus obtained as 'credible intervals' (CrI).
The WHO estimates suggest that TB incidence and mortality have been declining by 1-2 per cent annually over the last five years1, 'background' trends that may arise from a variety of factors including socio-economic development. These secular trends were captured assuming a constant, annual decline in β and the per-capita mortality hazard for TB cases. However, there is little evidence for how these trends may continue in future: when simulating future projections; therefore, a range of scenarios was adopted, ranging from current trends continuing indefinitely, to a more conservative scenario where current trends stabilize by 2020 (yielding constant β and TB mortality hazard).
Implementing interventions: The interventions listed in the Table were modelled, successively adding each intervention in a combination strategy. Broadly, the interventions were grouped in three categories: strengthen, accelerate and prevent. The first of these, aimed at coordinating and improving basic TB services, focused on diagnostic facilities, private sector engagement and improving treatment initiation and outcomes. Such interventions are foundational, but contingent on a TB patient's presentation for care.
| Package | Intervention | Coverage |
|---|---|---|
| Strengthen | Private sector engagement | Engage with 80% of non-NTP providers to implement diagnostic tests and treatment adherence at same level as in public sector |
| Improved programmatic diagnostics | Accelerated substitution (ultimately 80%) of smear by rapid molecular test, for NTP and engaged non-NTP providers. Involves X-ray screening followed by Xpert confirmation, with 20% receiving Xpert without screening. This results in: (i) the probability of diagnosis per patient visit increasing to 95% in the NTP/engaged non-NTP sector, and (ii) 80% of patients receiving a first-line drug susceptibility test at the point of TB diagnosis | |
| Improved programmatic treatment cascade | Increase treatment initiation and completion rates in NTP sector (including engaged non-NTP providers) to 95% | |
| Accelerate | Systematic screening in risk groups | Systematic screening using symptoms and X-rays in the risk group alone, at a given annual frequency |
| Extended contact investigation in the general population | Screen for active TB among extended contacts, including household, social and occupationala | |
| Prevent | Biomarker-guided preventive therapy | After 2025: systematic biomarker testing at a given annual frequency to identify incipient TB (those who would benefit from preventive therapy) and initiation on preventive therapyb |
These interventions are modelled in combination, added progressively in the order listed here. Both the ‘accelerate’ and ‘prevent’ packages involve active detection of TB disease and incipient TB, respectively. aThere is limited evidence for the potential yield of such an extended contact definition. Household studies in India suggest that 4-5% of household contacts of pulmonary TB cases also have active TB disease26. If this burden is half as much in extended contacts, and if individuals have on average 10-20 such contacts, then this approach could yield roughly 0.5 additional TB cases for every passively diagnosed case. bThe impact of these measures will depend on the numbers of incipient TB cases identified per year, as well as the success of preventive therapy in preventing TB disease. We report the ‘effective prevention coverage,’ which is a multiple of both these factors. TB, tuberculosis; NTP, national TB programme
The 'accelerate' package of interventions builds on 'strengthening' activities and additionally includes measures to reach TB cases that have not yet presented for care: that is, enhanced case-finding measures (although as discussed below, this scenario could also include patient-focused mechanisms to encourage uptake of TB services). In risk groups, consistent with ongoing case-finding activities in some countries of the Region, we assumed sustained, systematic screening using mobile diagnostic units to screen for TB, at a given annual frequency27. In the general population, however, such approaches are not feasible. Instead for this population, information was used from recent work in Vietnam, which demonstrated the potential value of contact investigation, for identifying undiagnosed TB28. We modelled an 'extended contact investigation' scenario, where screening for TB incorporated not only household contacts of index TB patients but also social and occupational contacts.
Finally under 'prevent', interventions building on 'strengthen' and 'accelerate' were considered to additionally include population preventive measures. At present, the primary tool for TB prevention is preventive therapy29. For example, recent WHO guidelines recommend that preventive therapy should be offered to clinical risk groups, including people living with HIV, and household contacts of those diagnosed with active TB30. Ongoing modelling suggests that although these measures in the SEAR could have a meaningful impact on TB burden in the Region, these will not be sufficient to meet the end TB goals. Therefore, current preventive therapy was not explicitly considered in the current work. By contrast, a future scenario was considered where preventive therapy could be implemented in the general population without being constrained to any such clinical risk factors (hence the designation as 'population' preventive measures). It was assumed in particular that, by 2025, new 'biomarker' tools could allow the identification of those with TB infection who are most likely to develop disease within the next two years (that is, a tool for diagnosing 'incipient TB' in the model illustrated in Fig. 1). Such tools together with the ongoing development of shorter, more effective regimens that are better suited for mass administration3132 could allow implementation of preventive therapy on a population level. This scenario is merely illustrative: it is contingent on the coverage of biomarker screening, as well as the effectiveness of future preventive regimens. To address both in a simple way, the 'effective prevention rate' was considered, as the multiple of these two factors.
It is important to note that this is just one example of population prevention, and other approaches may offer promise as well: for example, recent findings raise hope for a transmission-blocking TB vaccine33, which would have a profound impact on TB control in the Region. Moreover, undernutrition is an important risk factor for TB in South Asia, accounting for one of the largest population attributable fractions of TB burden, in India34. Therefore, 'intersectoral approaches' such as nutrition support initiatives could have an important population preventive impact35 on TB. At present, all of these possibilities are equally untested and hypothetical: thus, the example of a biomarker test, which we adopted for the present study, remains only an illustrative one.
All interventions were assumed to be implemented with a steady (linear) scale-up, over five years starting from 2017 with the exception of population preventive measures, beginning from 2025.
For the 'strengthening' interventions the coverage scenarios shown in the Table were assumed, as such measures are a necessary foundation for the 'accelerate' and 'prevent' interventions. We then examined what levels of coverage were needed for the 'accelerate' and 'prevent' interventions, to meet the 2035 end TB goals for incidence and mortality. The 'accelerate' package builds upon the 'strengthening' package though these are not sequential. Different scenarios were explored for the coverage of these interventions in the high-impact risk group, and in the general population.
Finally, as an indication of the magnitude of investment that would be required, the resources required for scaling up the implementation of currently available tools were estimated. The 'prevent' scenario in the costing was not included, given that it featured diagnostic technologies and preventive therapy regimens that do not currently exist. Taking the programmatic perspective for the 'strengthen' and 'accelerate' packages, commodity and personnel costs were included, incorporating the number of diagnostic tests needed to identify one TB case, as well as 'false positive' TB, that is, the excess cost of treating patients wrongly diagnosed as having TB (
Results
Fig. 2 shows the model outputs for incidence and prevalence for the three highest burden countries in the Region, illustrating the best parameter fits (black curves) as well as the different scenarios for future burden projections (blue and black curves, respectively). Although these figures show only the best-fitting parameter sets, for clarity, the model simulations additionally captured the uncertainty in WHO estimates for these epidemiological indicators.
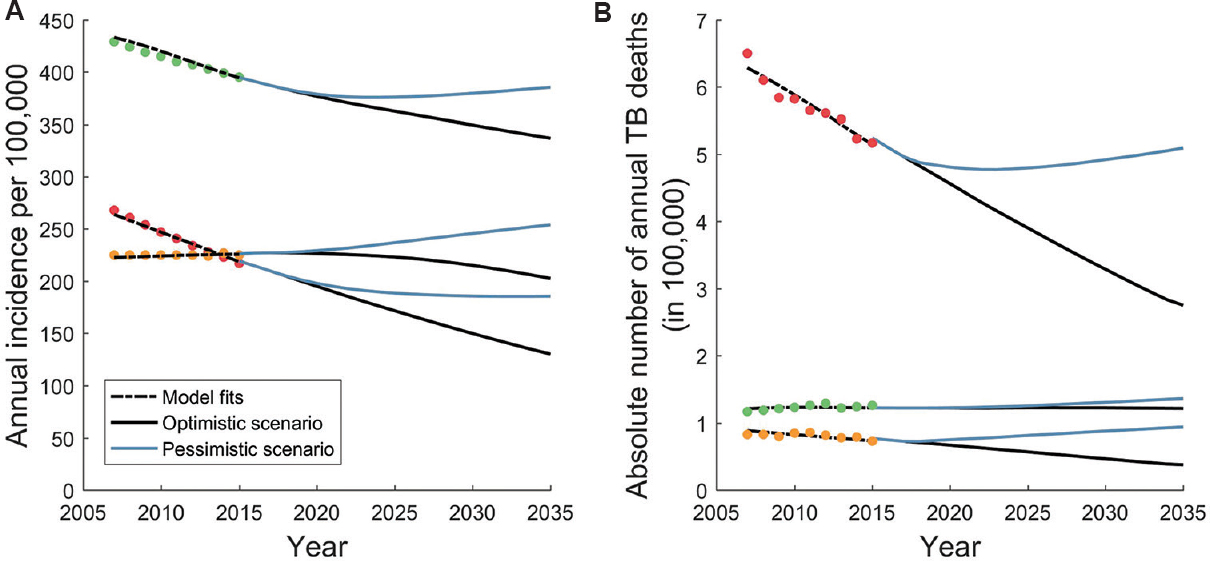
- Model fits to World Health Organization estimates for incidence and mortality. Shown, for illustration, are the three countries accounting for 90 per cent of the population in South-East Asian Region: India (red), Indonesia (green) and Bangladesh (yellow). World Health Organization estimates account for recent trends, and it is not clear how these trends may continue in future. We adopted an ‘optimistic’ scenario (black curves) in which current trends persist until 2035, and a ‘pessimistic’ scenario in which current trends stabilize by 2020. Panels A and B show projections for incidence and mortality, respectively.
Fig. 3 shows illustrative dynamics for incidence and mortality, under the different intervention packages described above. The 'strengthen' scenario followed the levels of coverage shown in the Table. The 'accelerate' scenario assumed systematic screening in the high-impact risk group three times a year, along with extended contact investigation in the general population. Finally, the 'prevent' scenario assumed the use of a future biomarker test, together with preventive therapy, that successfully avertsed half of TB progressions from incipient to active disease, per year.
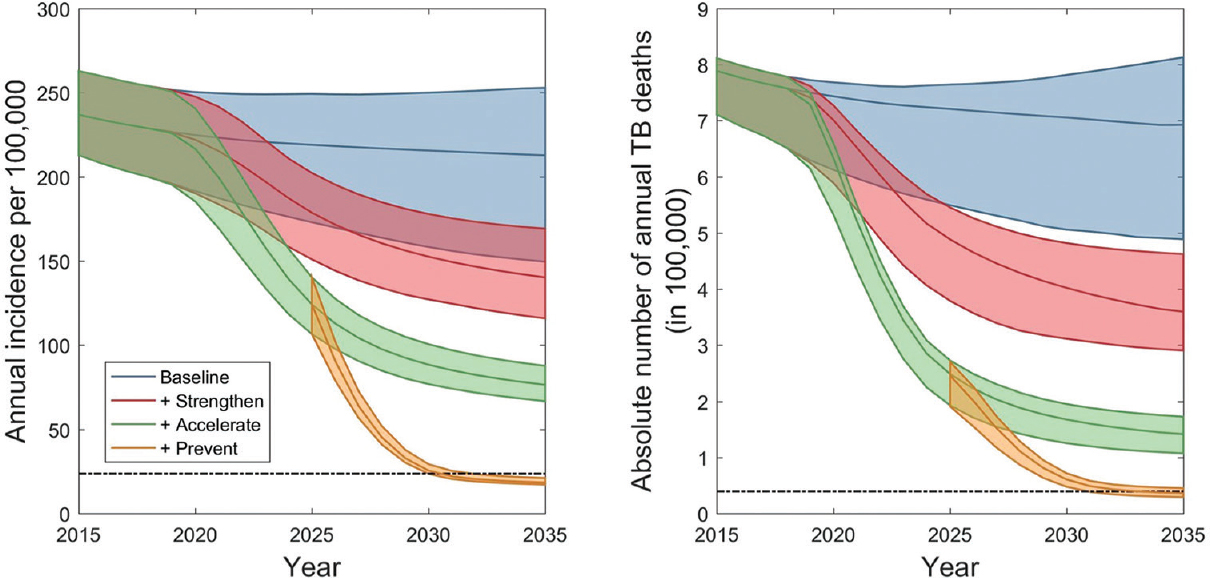
- Epidemic dynamics under different intervention scenarios. Shown are the dynamics aggregated over all 11 South-East Asian Region countries. Shaded regions show 95 per cent credible intervals (CrI), arising from uncertainty in input parameters (Table SII) and in potential future background trends in tuberculosis burden (illustrated in Fig. 2). The horizontal, dashed lines show the 2035 targets for incidence (left-hand panel) and mortality (right-hand panel).
The 'strengthen' package could reduce incidence rate by 43 per cent (95% CrI 32.0-49.4%) and TB deaths by 52.5 per cent (95% CrI 43.6-64.4%), the latter because of improvements in patient outcomes as well as reducing transmission. The addition of the 'accelerate' package of interventions increased these impacts to 67.3 per cent (95% CrI 65.3%-69.8%) and 80.9 per cent (95% CrI 77.9-84.7%), respectively. Although showing a considerable impact, these results suggested that even with the ambitious levels of implementation shown here, the end TB goals were not reached. It was observed that while such measures might be effective at controlling transmission, there is ultimately a dominant share of incidence coming from remote infection rather than recent transmission. It is only with the deployment of primary TB prevention, and of TB recurrence, that the end TB goals can ultimately be met (Fig. 3). We note that the 'population preventive' strategy modelled here is assumed to affect incipient TB among those recovered from previous TB episodes, as well as among new cases.
An accompanying, ingredient-based costing analysis (
These results showed just one illustrative scenario: we next explored the levels of coverage needed for the 'accelerate' and 'prevent' packages, scaled up, respectively, from 2017 to 2025, concentrating first on the numbers of active TB cases and incipient TB that were needed to be identified each year. Fig. 4 shows the coverage that would be needed in the general population. Curves showed the minimum required coverages of case-finding (horizontal axis) and population prevention (vertical axis), with each separate curve representing a different scenario for prioritization of the high-impact risk group. Screening in the risk group three times a year (green curve) can substantially reduce the amount of case-finding needed in the general population, compared to a strategy that addresses the risk group and the general population equally (blue curve). In practice, this would have important resource implications, as focused efforts in high-burden groups will mitigate the resources needed in the general population, where TB burden is more diffuse. However, addressing the risk group alone is not sufficient to meet the end TB goals. Moreover, these results suggested that under the parameters assumed here for the role of the risk group in TB burden there could be diminishing returns from screening more than three times a year in the risk group (see proximity of orange and green curves). Results from an alternative model (not shown here), where TB burden in the risk group arises not from higher rates of progression but from a higher risk of infection than the general population showed similar results to those shown in Fig. 4.
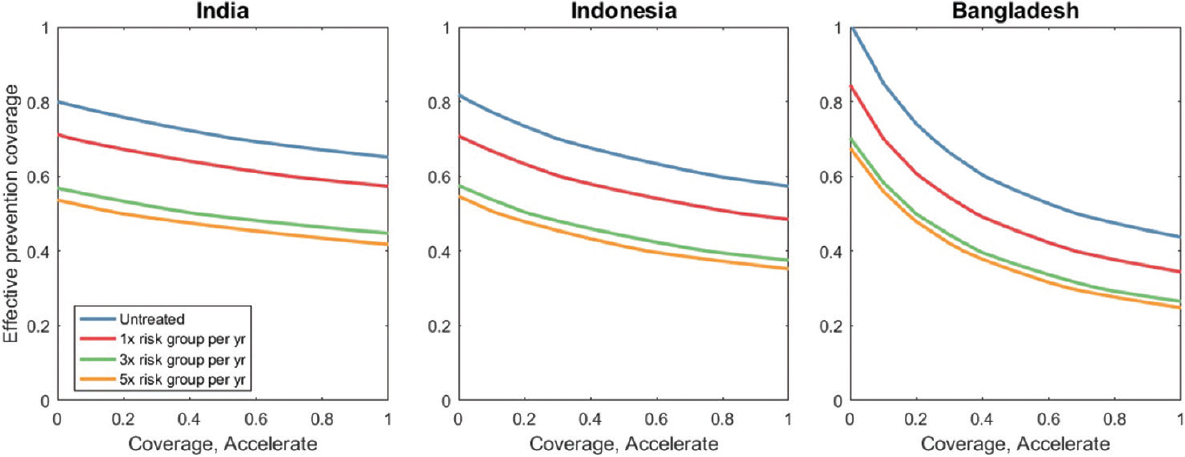
- Minimum coverage levels for meeting the end tuberculosis goals by 2035. The x-axis denotes the proportion of TB in the general group that is detected per year, while the y-axis denotes the proportion of incipient TB that is successfully diagnosed and treated in the general population, each year. Each curve represents a different scenario for the coverage of case-finding and population prevention in the risk group. For example, yellow curves involve, as well as full implementation of the ‘strengthen’ package, additionally the risk group being screened five times a year for active disease, and (after 2025) for ‘incipient’ disease. The Figure illustrates that focused interventions in the risk group can significantly lower the coverage needed in the general population. However, there is limited incremental benefit to be gained, between screening 3 or 5 times a year in the risk group (comparing green and yellow lines).
Discussion
The present work emerges in a context of increasing political commitment to end TB in SEAR. Here, a mathematical modelling was used which showed that ending TB in the Region could only be met through a massive mobilization of effort and resources, greatly exceeding current levels of TB activity. In particular, while there is a need to fix basic TB services (including engagement with the private healthcare sector) and accelerate TB diagnosis (including increases in case-finding), these measures alone will not be sufficient to meet the end TB goals. In addition, there is a pressing need to invest in the technology required for scalable, population-level preventive measures to be available by 2025. The Delhi ministerial meeting also called for the establishment of a regional 'Innovation to Implementation fund'36, to support sustained research into new technologies for TB control in the Region.
It is also to be noted that the interventions covered here are only examples of measures to realize the transmission impact of each of the three intervention scenarios. For example, the key feature of the 'accelerate' scenario is that it curtails the period of infectivity before a patient's first presentation for care. We considered case-finding as one way of realizing this impact, yet the same effect might also arise from interventions that aim to encourage uptake of TB services through social protection mechanisms for TB patients.
Second, current approaches to preventive therapy are restricted, by practical necessity, to specific risk factors, such as HIV co-infection and household contacts. By contrast, for the substantial reductions that will be needed in TB transmission before 2035, future preventive measures will need to be truly 'population-based', or unrestricted to any specific exposure or risk group. Here, as an illustrative example, we modelled a scenario where mass preventive therapy could be guided by the use of a biomarker tool, to identify incipient TB. In practice, it must be noted that the implementation of such a prognostic tool would carry its own challenges, involving testing in the general community, for a condition having less than one per cent prevalence. The specificity of such a test will therefore, be paramount, whether implemented alone or as part of a triage/confirmation algorithm. In addition, the delivery technology for the biomarker test would be critical in its implementation: for example, a point-of-care 'fingerprick' test could be deployed in primary care settings, not just for detecting incipient TB but also as part of routine screening for other conditions including diabetes. On the other hand, as illustrated in Fig. 4, where such a test is intensively implemented in high-burden settings such as urban slums, this could mitigate its required coverage in the rest of the population.
Our findings for the impact of the 'prevent' intervention scenario would apply to any primary prevention measure that is deployable on a population level, in addition to currently recommended strategies. A primary example is an effective transmission-blocking vaccine, which could have even more profound implications for TB control33. Importantly, prevention need not be limited to biomedical tools; as discussed above, the impact of 'multisectoral approaches' aimed at addressing the determinants of TB, including poverty, diabetes and undernutrition may have an equally important effect on TB prevention. There is a pressing need for further evidence on such approaches in South-Asian settings.
As with any transmission model, this framework has some limitations. The model is nationally aggregated and thus does not address subnational heterogeneities, beyond high-impact risk groups. For simplicity, it was not aimed to capture certain secular trends in the Region, such as rapidly growing urbanization; a changing demography (namely an ageing population) and an increase in comorbidities such as diabetes. Further, different forms of TB were not distinguished, thus averaging over bacteriologically confirmed and clinically diagnosed, pulmonary and extrapulmonary TB. It was also assumed that all non-NTP providers involved in 'private sector engagement' were successfully trained to improve their standards of TB care. While initiatives in India have shown notable increases in notifications from the private sector, there is also an increasing body of evidence on the approaches that work best in engaging effectively with healthcare providers in the private sector37. More broadly, illustrative scenarios for 'high-impact risk groups' were adopted, noting that the purpose of this element in the model was to be illustrative, rather than prescriptive. In particular, assumptions were made for two important parameters, the size and relative risk of TB in the risk group. An important question for future work is, for a given country setting, the values of these parameters specific to different risk groups. With ongoing case-finding efforts in India and elsewhere, data from these activities will be invaluable in addressing this important data gap. We have assumed efficient implementation and scale-up of TB services, whereas in practice, it is likely that challenges with recruitment, management, procurement and other issues would increase the costs of the activities that we have modelled. Moreover, the largest overall incremental costs are associated with active case-finding and preventive measures. There are limited studies on which these resource needs are based, and the cost per case found is likely to increase as prevalence declines, thus expanding overall resource needs. Further research is needed to better define active and preventive models and their costs. In this cost analysis, the potential for overlapping costs between different activities was ignored, for example, the fact that human resources needed to support the 'strengthen' package may also be able to support the 'accelerate' package of interventions.
Finally, we simulated declines in TB burden that have not previously been recorded on such a scale as in the SEAR. To some extent, this is because we simulated interventions at a scale that is equally unprecedented. A seminal study in Alaskan communities in the 1970s demonstrated that rapid declines in TB could indeed be achieved with population-based treatment of latent TB infection38. As discussed above, however, to be replicated on the scale considered here, there is a need for mass preventive measures to be more targeted. In another example, while TB mortality in Western Europe declined up to 10 per cent per year in the early 1900s, this largely predated the availability of TB chemotherapy39. Perhaps the most important similarity with modern-day SEAR is that much of TB incidence likely comes from recent transmission. In this respect, currently available tools for early detection and effective treatment would indeed be expected to yield more rapid declines in TB incidence than have previously been observed. It is important to note the limitations inherent in modelling at such levels of scale: for example, in modelling the 'accelerate' package of interventions, we have assumed that case-finding efforts can reduce the delay to diagnosis. Although plausible, as case-finding would tend to interrupt the initial 'patient delay', there remains a lack of systematic evidence for this impact40. In future, there is a pressing need to address these evidence gaps, for the potential transmission impact of interventions at scale. Such studies could be facilitated if coupled with existing surveillance efforts (for example, studying the transmission impact of TB prevalence surveys).
In conclusion, our overall findings show that strengthening systems is a critical foundation for meeting the end TB goals in the SEAR; additional declines in TB incidence will require substantial acceleration in case-finding and that TB elimination will ultimately depend on population-level prevention. Achieving these impacts calls for a shift in the TB response in the Region: not only in funding and research effort but also in the ambitious scale at which currently available tools need to be deployed.
Supplementary files
Supplementary files Model specificationFinancial support & sponsorship: This work was financially supported by the World Health Organization South-East Asia Region, New Delhi, India.
Conflicts of Interest: None.
References
- 2018. Global tuberculosis report. Available from: http://www.who.int/tb/publications/global_report/en/
- New tuberculosis estimates must motivate countries to act. J Epidemiol Glob Health. 2017;7:97-8.
- [Google Scholar]
- WHO End TB Strategy: Global strategy and targets for tuberculosis prevention, care and control after 2015. Available from: http://www.who.int/tb/post2015_strategy/en/
- Trends in tuberculosis incidence and their determinants in 134 countries. Bull World Health Organ. 2009;87:683-91.
- [Google Scholar]
- Tuberculosis control and elimination 2010-50: Cure, care, and social development. Lancet. 2010;375:1814-29.
- [Google Scholar]
- Tuberculosis and poverty: Why are the poor at greater risk in India? PLoS One. 2012;7:e47533.
- [Google Scholar]
- Effectiveness of involving the private medical sector in the national TB control programme in Bangladesh: Evidence from mixed methods. BMJ Open. 2012;2 pii: e001534
- [Google Scholar]
- How do private general practitioners manage tuberculosis cases. A survey in eight cities in Indonesia? BMC Res Notes. 2015;8:564.
- [Google Scholar]
- Missed opportunity for standardized diagnosis and treatment among adult tuberculosis patients in hospitals involved in public-private mix for directly observed treatment short-course strategy in Indonesia: A cross-sectional study. BMC Health Serv Res. 2010;10:113.
- [Google Scholar]
- Tuberculosis management by private practitioners in Mumbai, India: Has anything changed in two decades? PLoS One. 2010;5:e12023.
- [Google Scholar]
- Use of standardised patients to assess quality of tuberculosis care: A pilot, cross-sectional study. Lancet Infect Dis. 2015;15:1305-13.
- [Google Scholar]
- Causes of stigma and discrimination associated with tuberculosis in Nepal: A qualitative study. BMC Public Health. 2007;7:211.
- [Google Scholar]
- TB control: Challenges and opportunities for India. Trans R Soc Trop Med Hyg. 2016;110:158-60.
- [Google Scholar]
- Multidrug-resistant tuberculosis in Bangladesh: Results from a sentinel surveillance system. Int J Tuberc Lung Dis. 2017;21:12-7.
- [Google Scholar]
- Universal access to care for multidrug-resistant tuberculosis: An analysis of surveillance data. Lancet Infect Dis. 2013;13:690-7.
- [Google Scholar]
- Counting the lives saved by DOTS in India: A model-based approach. BMC Med. 2017;15:47.
- [Google Scholar]
- Modeling the impact of alternative strategies for rapid molecular diagnosis of tuberculosis in Southeast Asia. Am J Epidemiol. 2013;178:1740-9.
- [Google Scholar]
- Feasibility of achieving the 2025 WHO global tuberculosis targets in South Africa, China, and India: A combined analysis of 11 mathematical models. Lancet Glob Health. 2016;4:e806-15.
- [Google Scholar]
- Incipient and subclinical tuberculosis: Defining early disease states in the context of host immune response. J Infect Dis. 2011;204(Suppl 4):S1179-86.
- [Google Scholar]
- Size and usage patterns of private TB drug markets in the high burden countries. PLoS One. 2011;6:e18964.
- [Google Scholar]
- Prevalence and risk factors for adult pulmonary tuberculosis in a metropolitan city of South India. PLoS One. 2015;10:e0124260.
- [Google Scholar]
- New evidence of the tuberculosis burden in Asia demands national action. Lancet. 2016;388:2217-9.
- [Google Scholar]
- Estimating tuberculosis incidence from primary survey data: A mathematical modeling approach. Int J Tuberc Lung Dis. 2017;21:366-74.
- [Google Scholar]
- Inference for deterministic simulation models: The Bayesian melding approach. J Am Stat Assoc. 2000;95:1244.
- [Google Scholar]
- Population health impact and cost-effectiveness of tuberculosis diagnosis with xpert MTB/RIF: A dynamic simulation and economic evaluation. PLoS Med. 2012;9:e1001347.
- [Google Scholar]
- Tuberculosis (TB). Available from: https://www.who.int/tb/areas-of-work/laboratory/contact-investigation/en/
- 2017. National Strategic Plan for Tuberculosis Elimination. Available from: https://tbcindia.gov.in/WriteReadData/NSPDraft20.02.20171.pdf
- Household-contact investigation for detection of tuberculosis in Vietnam. N Engl J Med. 2018;378:221-9.
- [Google Scholar]
- Tuberculosis preventive treatment: The next chapter of tuberculosis elimination in India. BMJ Glob Health. 2018;3:e001135.
- [Google Scholar]
- Latent TB infection: Updated and consolidated guidelines for programmatic management. Available from: https://www.who.int/tb/publications/2018/latent-tuberculosis-infection/en/
- Three months of rifapentine and isoniazid for latent tuberculosis infection. N Engl J Med. 2011;365:2155-66.
- [Google Scholar]
- 2018. One month of Rifapetine/Isoniazid to prevent TB in people with HIV. CROI Conference on Retroviruses and Opportunistic Infections. Available from: http://www.croiconference.org/sessions/one-month-rifapentineisoniazidprevent-tb-people-hiv-brief-tba5279
- Phase 2b controlled trial of M72/AS01E vaccine to prevent tuberculosis. N Engl J Med. 2018;379:1621-34.
- [Google Scholar]
- Undernutrition, nutritionally acquired immunodeficiency, and tuberculosis control. BMJ. 2016;355:i5407.
- [Google Scholar]
- Estimating the impact of reducing undernutrition on the tuberculosis epidemic in the central eastern States of India: A dynamic modeling study. PLoS One. 2015;10:e0128187.
- [Google Scholar]
- 2017. Call for action: ministerial meeting towards ending TB in the South-East Asia. New Delhi: WHO; Available from: https://apps.who.int/iris/handle/10665/255553
- Testing and treating the missing millions with tuberculosis. PLoS Med. 2015;12:e1001805.
- [Google Scholar]
- Isoniazid prophylaxis among alaskan eskimos: A final report of the bethel isoniazid studies. Am Rev Respir Dis. 1979;119:827-30.
- [Google Scholar]
- The decline of tuberculosis mortality in Western Europe. Br Med Bull. 1954;10:77-81.
- [Google Scholar]
- The benefits to communities and individuals of screening for active tuberculosis disease: A systematic review. Int J Tuberc Lung Dis. 2013;17:432-46.
- [Google Scholar]


