
Translate this page into:
Hospitalization & health expenditure in Odisha: Evidence from National Sample Survey (1995-2014)
For correspondence: Mr Jayakant Singh, School of Health Systems Studies, Tata Institute of Social Sciences, Mumbai 400 088, Maharashtra, India e-mail: singhjayakant.tiss@gmail.com
-
Received: ,
This article was originally published by Wolters Kluwer - Medknow and was migrated to Scientific Scholar after the change of Publisher.
Abstract
Background & objectives:
Financing healthcare services through out-of-pocket payments is common in India. Household impoverishments due to health expenditure can be daunting, especially among the economically vulnerable households. This study investigated hospitalization and patient’s health expenditure in Odisha State in India.
Methods:
The national sample survey data were used to assess hospitalization and patient’s health expenditure over two time periods (1995 and 2014). Disease classification was made following International Classification of Diseases 10th revision (ICD-10). The hospitalization rate and health expenditure were estimated for infectious, cardiovascular, non-communicable, disability and other diseases. Andersen model was used to examine the determinants of healthcare expenditure.
Results:
Findings of the study revealed that hospitalization in Odisha increased nearly three folds and health expenditure by more than two times between 1995 to 2014. While the hospitalization for other diseases remained consistently higher, health expenditure for disability was the highest and it increased three times within the last two decades. The socio-economic and demographic divides in the hospitalization rate and health expenditure were evident.
Interpretation & conclusions:
Our analysis indicated that predisposing factors such as age and marital status played an important role in hospitalization whereas, enabling factors likely determined the health expenditure. There is a need to recognize the unique vulnerabilities of older population, widowed and health financial mechanism for disability-related illness.
Keywords
Health expenditure
hospitalization
morbidities
NSSO
Odisha
socio-economic status

Every year, millions of households are pushed to poverty on account of high spending in healthcare services, especially in low- and middle-income countries1-3. Financing healthcare services through out-of-pocket (OOP) payments is the general norm in many Asian countries including India4. Nearly eight per cent of population in India are pushed to below the poverty line due to OOP payments for healthcare services5. Evidently, public health spending in India is abysmally low as compared to many developing nations given that the health budget of India is only one per cent of its gross domestic product6. More importantly, about 67 per cent of the health expenses are managed by the households, making India one of the highly privatized healthcare systems in the world7. The ever-rising cost of healthcare services remains a grave concern in India more so in the poor states.
Although India witnessed a rapid increase in non-communicable diseases (NCDs) indicating a pattern of an epidemiological transition but an overwhelming burden of communicable diseases is suggestive of a double burden of diseases8. With the changing morbidity profile, hospitalization and health expenditure patterns are also expected to alter and pose a serious threat, especially to the socio-economically weaker sections of the society in the absence of adequate health financing mechanism. It was shown that proportion of OOP expenditure for hospitalization was significantly higher among the economically weaker sections of the society9,10.
Odisha is an economically poor State and catastrophic health spending in Odisha is one of the highest in India11. Despite the majority of the healthcare institutions in Odisha are in the public sector, OOP expenditure remained high12. Odisha has a high percentage of older population in India (10%) and an elevated rate of hospitalization and health expenditure among them is a growing concern13. In India, health being a State subject, the majority of healthcare planning and interventions are state specific. Therefore, State-level analysis is important to inform health policy.
Population-based large scale surveys are an important source of evidence to identify the emerging health concerns and thereby effectively design and implement health programmes. While there are several studies on catastrophic health expenditure and its effect on household impoverishment at the national level3,5,9, but studies at the State level are sparse. Considering Odisha has a high poverty rate and high catastrophic health spending11, examining the interplay between the socio-economic and demographic characteristics of population with hospitalization and health spending over a period of time may provide new insights. This study was undertaken to investigate hospitalization and patient’s health expenditure in Odisha over the two time periods (1995-2014) using the National Sample Survey (NSS) data.
Material & Methods
The data from the 52nd and 71st round of NSS were used, which were available in public domain (http://www.icssrdataservice.in, accessible on request). The total sample for Odisha comprised 21,723 individuals in 52nd round and 11576 in 71st round of NSS. The survey design including the methods of data collection and other survey-related information can be found elsewhere14,15. As the objective of the study was to assess the variations of socio-economic and demographic factors on hospitalization and health spending in the long run (over 2 decades), the 52nd and 71st round of NSS were chosen.
Andersen’s behavioural model of healthcare utilization was used to examine the predisposing, enabling and need factors16. Andersen’s model postulates that the utilization of healthcare services by the households is a function of their predisposition to use services that emerge by naturally possessed conditions such as geographical accessibility, gender, caste and any other affiliations17. The enabling factors are further dependent on the economic positions, educational attainment, place of residence and other basic infrastructure-related factors that facilitate access. At the end, the utilization of healthcare services is determined by the need of the households based on health condition and disease burden.
The rate of hospitalization and health expenditure were examined by the socio-economic and demographic characteristics as the predisposing and enabling factors for five distinct morbidity categories: infectious diseases, cardiovascular diseases (CVDs), NCDs, disability and other diseases. The morbidity classifications are based on the 10th revision of the international classification of disease18 (Supplementary Table). The references period for hospitalization cases was 365 days preceding the survey. Health expenditure is provided in Indian rupees ₹ and for comparison purpose, the expenditure value of the year 1995 was adjusted for inflation as per the Reserve Bank of India by taking base year as 201419.
| 1995 (52nd) | 2014 (71st) |
|---|---|
| Infectious disease | |
| Diarrhoea/dysentery | Fever with loss of consciousness or altered consciousness |
| Tetanus | Fever with rash/eruptive lesions |
| Diphtheria | Fever due to diphtheria, whooping cough |
| Whooping cough | Tuberculosis |
| Meningitis and viral encephalitis | Filariasis |
| Chicken pox | Tetanus |
| Measles/german measles | HIV/AIDS |
| Mumps | Other sexually transmitted diseases |
| Acute respiratory infection (including pneumonia) | Diarrhoeas/dysentery etc. |
| Chronic amoebiasis | Worms infestation |
| Pulmonary tuberculosis | Discomfort/pain in the eye with redness or swellings/boils |
| Acute upper respiratory infections (cold, runny nose etc.) | |
| Sexually transmitted diseases | Cough with sputum with or without fever and NOT diagnosed as TB |
| Guinea worm | Skin infection (boil, abscess, itching) |
| Filariasis (elephantiasis) | |
| Gastritis/hyper-acidity gastric/peptic ulcer | |
| CVD | |
| Heart failure | Stroke/haemiplegia |
| Diseases of heart | Hypertension |
| High/low blood pressure | Heart disease: Chest pain, breathlessness, CVD |
| NCD | |
| Cerebral stroke | Jaundice |
| Cough and acute bronchitis | Cancer |
| Ailment relating to pregnancy and child birth | Anaemia (any cause) |
| Jaundice | Bleeding disorders |
| Cancer | Diabetes |
| Other tumours | Under-nutrition |
| (General debility) anaemia | Goitre and other diseases of the thyroid |
| Goitre and thyroid disorders | Others (including obesity), high cholesterol |
| Diabetes | Cataract |
| Beri beri | Glaucoma |
| Rickets | Earache with discharge/bleeding from ear/infections |
| Other malnutrition diseases | Bronchial asthma etc. |
| Epilepsy | Abnormality in urination |
| Other diseases of nerves | Pelvic region/reproductive tract infection |
| Piles | Change/irregularity in menstrual cycle |
| Diseases of kidney/urinary system | Pregnancy with complications before or during labour |
| Prostrate disorder | Complications in mother after birth of child |
| Illness in the newborn/sick newborn | |
| Disability disease | |
| Diseases of eye | Mental retardation |
| Acute diseases of ear | Mental disorders |
| Diseases of mouth, teeth and gum | Headache |
| Injury due to accident and violence | Seizures or known epilepsy |
| Mental and behavioural disorder | Weakness in limb muscles and difficulty in movements |
| Visual disability (other than cataract) | Others including impaired cognition, memory loss, confusion |
| Cataract | Decreased vision |
| Other diseases of eye | Others (including disorders of eye movements) |
| Hearing disability | Decreased hearing or loss of hearing |
| Other diseases of ear | Diseases of mouth/teeth/gums |
| Speech disability | Joint or bone disease/pain or swelling in any of the joints |
| Diseases of mouth, teeth and gum | Back or body aches |
| Hydrocele | Accidental injury, road traffic accidents and falls |
| Pains in joints | Accidental drowning and submersion |
| Other disorder of bones and joints | Burns and corrosions |
| Locomotor disability | Poisoning |
| Other congenital deformities (excluding disability) | Intentional self-harm |
| Assault | |
| Others disease | |
| Fever of short duration | All other fevers (includes malaria, typhoid and fevers of unknown origin) |
| Other diagnosed ailment (of <30 days) | Pain in abdomen: Gastric and peptic ulcers/acid reflux/acute abdomen |
| Undiagnosed ailment (of <30 days) | Lump or fluid in abdomen or scrotum |
| Other diagnosed ailment (of >30 days) | Gastrointestinal bleeding |
| Undiagnosed ailment (of >30 days) | Contact with venomous/harm-causing animals and plants |
| Symptom not fitting into any of the above categories | |
| Could not even state the main symptom | |
Source: Ref. 18. CVDs, cardiovascular diseases; NCDs, non-communicable diseases; TB, tuberculosis
The socio-economic and demographic characteristics used in this study were gender (male, female), place of residence (rural, urban), age groups (0-14, 15-34, 35-59, 60 yr and above), level of education (illiterate, primary, higher secondary, graduate and above), marital status (never married, currently married, widowed/separated), household size (1-5 members, 6-7 members, 8 and above members), caste (ST/SC, OBC, other), religion (Hindu, others), monthly per capital expenditure, i.e. MPCE (poorest, poor, medium, rich, richest), regions (northern, coastal, southern), whether health service was sought in private or public facility, and whether had insurance coverage or not. Hospitalization rate was calculated using the following formula:

Where, hi= Number of persons hospitalized in the past 365 days; pi= Total number of persons alive in the sample households.
Bivariate analysis was conducted to examine hospitalization rate by socio-economic covariates and health expenditure was estimated for two different time period i.e. year 1995 and 2014. Data analysis was conducted using STATA 12 (StataCorp LP, College Station, Texas, USA).
Results
Hospitalization by socio-economic and demographic characteristics: Hospitalization rate in Odisha nearly increased by three times between 1995 and 2014 from 12 per thousand to 30 per thousand population. Hospitalization for CVDs followed by disability and NCDs showed a steep increase between 1995 and 2014 (Table I). Further, hospitalization rates for CVDs and NCDs, especially among the older population (aged 60 yr and above) and the widowed or separated were the highest. For instance, seven of 1000 older persons and widowed or separated reported hospitalization due to CVDs and 16 of 1000 for NCDs in the year 2014. On the other hand, hospitalization for other diseases remained consistently higher in both the time periods. Other disease category comprised the diseases other than the remaining four categories, i.e. infectious, CVDs, NCDs and disability. In 2014, hospitalization for other diseases was higher among widowed (17/1000), other religion (16/1000), and in Southern region of Odisha (13 in 1000). Overall, hospitalization was higher among urban resident, older population, widowed, those who were economically well-off and lived in the coastal region of Odisha as opposed to their counterparts.
| Variables | Infectious | CVDs | NCDs | Disability | Others | Total | ||||||
|---|---|---|---|---|---|---|---|---|---|---|---|---|
| 1995-96 | 2014 | 1995-96 | 2014 | 1995-96 | 2014 | 1995-96 | 2014 | 1995-96 | 2014 | 1995-96 | 2014 | |
| Gender | ||||||||||||
| Male | 2.5 | 6.0 | 0.3 | 1.7 | 1.1 | 4.7 | 1.7 | 7.3 | 8.0 | 8.8 | 13.6 | 28.5 |
| Female | 2.6 | 8.9 | 0.2 | 2.1 | 1.3 | 8.0 | 0.5 | 4.3 | 5.5 | 7.9 | 10.1 | 31.2 |
| Place of residence | ||||||||||||
| Rural | 2.4 | 7.3 | 0.2 | 1.6 | 1.1 | 5.7 | 0.9 | 5.4 | 6.9 | 8.5 | 11.5 | 28.5 |
| Urban | 3.1 | 8.2 | 0.7 | 3.1 | 2.1 | 9.3 | 2.2 | 8.3 | 5.8 | 7.7 | 13.9 | 36.6 |
| Age groups | ||||||||||||
| 0-14 | 1.6 | 5.3 | 0 | 0.2 | 0.4 | 2.9 | 0.3 | 1.9 | 4.5 | 6.7 | 6.8 | 17.0 |
| 15-34 | 1.8 | 5.5 | 0.1 | 0.2 | 0.8 | 5.0 | 1.0 | 5.0 | 6.7 | 6.6 | 10.4 | 22.3 |
| 34-59 | 3.7 | 8.8 | 0.4 | 3.3 | 2.1 | 7.6 | 2.0 | 9.0 | 8.1 | 11.2 | 16.3 | 39.9 |
| 60+ | 6.8 | 15.8 | 1.6 | 7.8 | 4.7 | 15.9 | 2.9 | 9.0 | 14.9 | 10.7 | 30.9 | 59.2 |
| Level of education | ||||||||||||
| Illiterate | 3.5 | 9.3 | 0.1 | 2.4 | 1.0 | 8.2 | 1.0 | 5.3 | 8.2 | 10.1 | 13.8 | 35.3 |
| Primary | 1.5 | 8.1 | 0.3 | 1.4 | 1.4 | 5.5 | 1.1 | 6.2 | 5.4 | 8.3 | 9.7 | 29.5 |
| Higher secondary | 0.9 | 4.5 | 0 | 1.5 | 0.5 | 5.4 | 3.3 | 4.5 | 3.1 | 9.2 | 7.8 | 25.1 |
| Graduate and above | 0.1 | 6.5 | 3.1 | 1.9 | 3.5 | 5.4 | 2.1 | 6.5 | 4.2 | 6.7 | 13.0 | 27.0 |
| Religion | ||||||||||||
| Hindu | NA | 7.5 | NA | 1.9 | NA | 6.3 | NA | 5.7 | NA | 8.2 | NA | 29.6 |
| Others | NA | 6.5 | NA | 1.2 | NA | 5.9 | NA | 11.1 | NA | 15.8 | NA | 40.5 |
| Caste | ||||||||||||
| ST/SC | 3.0 | 5.8 | 0.1 | 1.5 | 0.9 | 5.6 | 0.7 | 4.1 | 6.6 | 8.7 | 11.3 | 25.7 |
| OBC | NA | 10.0 | NA | 3.3 | NA | 8.4 | NA | 8.6 | NA | 8.0 | NA | 38.3 |
| Others | 2.1 | 7.8 | 0.4 | 1.5 | 1.5 | 5.9 | 1.4 | 6.2 | 6.9 | 8.3 | 12.3 | 29.7 |
| Marital status | ||||||||||||
| Never married | 1.5 | 5.7 | 0 | 0.3 | 0.3 | 2.8 | 0.4 | 4.2 | 4.5 | 6.3 | 6.7 | 19.3 |
| Currently married | 3.2 | 8.3 | 0.4 | 2.7 | 2.2 | 8.4 | 1.8 | 7.4 | 9.0 | 9.3 | 16.6 | 36.1 |
| Widowed/separated | 6.6 | 13.0 | 0.8 | 7.4 | 1.6 | 15.5 | 1.4 | 4.0 | 9.7 | 16.8 | 20.1 | 56.7 |
| Household size | ||||||||||||
| 1-5 members | 2.8 | 7.6 | 0.2 | 1.9 | 1.1 | 5.9 | 1.2 | 6.0 | 8.8 | 10.4 | 14.1 | 31.8 |
| 6-7 members | 2.5 | 8.2 | 0.4 | 1.3 | 1.2 | 6.5 | 0.7 | 5.8 | 4.9 | 5.2 | 9.7 | 27.0 |
| 8 and above members | 2.0 | 4.8 | 0.2 | 2.7 | 1.5 | 7.8 | 1.3 | 4.7 | 5.0 | 2.9 | 10.0 | 22.9 |
| MPCE | ||||||||||||
| Poorest | 2.1 | 7.2 | 0.1 | 1.7 | 0.6 | 5.9 | 0.8 | 3.9 | 5.6 | 8.8 | 9.2 | 27.5 |
| Poor | 1.8 | 5.2 | 0.1 | 0.5 | 0.3 | 6.3 | 0.4 | 4.9 | 5.0 | 9.9 | 7.6 | 26.8 |
| Medium | 2.6 | 8.9 | 0.1 | 2.1 | 1.3 | 4.8 | 0.9 | 5.6 | 5.6 | 11.5 | 10.5 | 32.9 |
| Rich | 3.7 | 6.2 | 0.4 | 1.4 | 1.2 | 4.9 | 1.1 | 6.4 | 8.3 | 6.0 | 14.7 | 24.9 |
| Richest | 2.4 | 9.3 | 0.5 | 3.4 | 2.6 | 9.6 | 2.4 | 8.7 | 9.4 | 6.1 | 17.3 | 37.1 |
| Regions | ||||||||||||
| Northern | 2.5 | 6.8 | 0.2 | 1.7 | 1.3 | 4.3 | 1.4 | 4.6 | 8.0 | 8.5 | 13.4 | 25.9 |
| Coastal | 2.8 | 8.1 | 0.4 | 2.6 | 1.3 | 7.5 | 1.1 | 6.8 | 6.9 | 6.1 | 12.5 | 31.1 |
| Southern | 1.5 | 7.1 | 0.1 | 0.7 | 0.7 | 7.0 | 0.4 | 5.8 | 2.8 | 12.9 | 5.5 | 33.5 |
| Total | 2.5 | 7.4 | 0.2 | 1.9 | 1.2 | 6.3 | 1.1 | 5.8 | 6.8 | 8.4 | 11.8 | 29.8 |
Source : Refs 14,15. NA indicates lack of information. MPCE, monthly per capita expenditure; CVDs, cardiovascular diseases; NCDs, non-communicable diseases; NSSO, National Sample Survey Organization
Patient’s health expenditure by types of morbidities: The health expenditure for hospitalization in Odisha doubled in the period between 1995 and 2014 (Table II), of which, expenditure for disability-related illness increased three folds and other morbidity by over two times. Although health expenditure for CVDs was the highest in 1995, in 2014, health expenditure for disability was the highest followed by CVDs and NCDs. Remarkably, health expenditure almost reduced by half for infectious disease and CVDs between 1995 and 2014. Health expenditure for most of the diseases was higher among male population, urban resident, in the age group 15-59, among never married, persons with higher level of education, affluent households, and those who were hospitalized in private health facilities. The health expenditure for CVDs among those who were hospitalized in private health facility, richest MPCE households, and with education level of graduate and above crossed rupees 0.1 million in the year 1995 and 2014 . Further, irrespective of the type of morbidities, health expenditure was generally higher among wealthy households, in the coastal region of Odisha and those who were hospitalized in the private health facility in 1995 and 2014 with few exceptions.
| Background characteristics | Infectious | CVDs | NCDs | Disability | Others | Total | ||||||
|---|---|---|---|---|---|---|---|---|---|---|---|---|
| 1995 | 2014 | 1995 | 2014 | 1995 | 2014 | 1995 | 2014 | 1995 | 2014 | 1995 | 2014 | |
| Gender | ||||||||||||
| Male | 7389 | 6648 | 42,890 | 26,329 | 11,454 | 21,646 | 7376 | 25,451 | 4514 | 7479 | 6636 | 15452 |
| Female | 2789 | 9409 | 36,039 | 11,278 | 13,797 | 12,377 | 8329 | 18,534 | 3960 | 7645 | 4241 | 11441 |
| Place of residence | ||||||||||||
| Rural | 6085 | 9409 | 17,394 | 11,278 | 11,144 | 12,377 | 6554 | 18,534 | 3871 | 7645 | 5415 | 12616 |
| Urban | 5716 | 7199 | 73,359 | 18,554 | 13,428 | 13,764 | 10,247 | 23,818 | 7966 | 7072 | 12764 | 22713 |
| Level of education | ||||||||||||
| Illiterate | 3650 | 6119 | 3821 | 8488 | 10233 | 9802 | 4590 | 15421 | 4396 | 4494 | 4518 | 8422 |
| Primary | 8481 | 8005 | 29,340 | 12,161 | 11,078 | 15,141 | 8923 | 28,223 | 4128 | 6745 | 6970 | 13809 |
| Higher secondary | 1904 | 7874 | 10,230 | 25,898 | NA | 24,969 | 1129 | 29,301 | 24,328 | 10385 | 11570 | 17687 |
| Graduate and above | 16,355 | 4053 | 116,213 | 112,868 | 28,255 | 45,435 | 17,071 | 19,873 | 13,438 | 26847 | 31515 | 35018 |
| Age group (yr) | ||||||||||||
| <15 | 2640 | 9320 | 6392 | 4861 | NA | 20,355 | 2475 | 37356 | 3221 | 2806 | 3350 | 19291 |
| 15-34 | 4805 | 7664 | 2353 | 21,717 | 9260 | 11,483 | 6943 | 41,112 | 2739 | 11048 | 3812 | 14510 |
| 35-59 | 7593 | 6364 | 76,022 | 13,137 | 15,497 | 21,669 | 8069 | 21,754 | 5861 | 6565 | 9019 | 13139 |
| 60 and above | 4815 | 9131 | 13,659 | 43,288 | 7511 | 18,676 | 6131 | 20,978 | 3785 | 7599 | 5059 | 18015 |
| Caste | ||||||||||||
| ST/SC | 4534 | 6971 | 2752 | 9756 | 13,141 | 10,110 | 4300 | 14,212 | 2531 | 6517 | 3914 | 8841 |
| OBC | NA | 7650 | NA | 25,274 | NA | 13,601 | NA | 28,330 | NA | 8104 | NA | 14754 |
| Others | 7062 | 7530 | 51,896 | 39,001 | 11,118 | 36,301 | 8620 | 27,328 | 5564 | 8450 | 8111 | 22204 |
| Religion | ||||||||||||
| Hindu | NA | 7479 | NA | 23,358 | NA | 19,057 | NA | 24543 | NA | 7358 | NA | 14651 |
| Others | NA | 1829 | NA | 53,126 | NA | 19,105 | NA | 10,609 | NA | 10414 | NA | 12563 |
| Marital status | ||||||||||||
| Never married | 9309 | 13,539 | 6395 | 15,359 | 19,054 | 20,272 | 2449 | 27,855 | 2297 | 18567 | 7164 | 18530 |
| Currently married | 6221 | 6756 | 46,210 | 26,993 | 10,332 | 20,767 | 7630 | 25,245 | 4835 | 6841 | 6828 | 15114 |
| Widowed/separated | 3871 | 6906 | 25,502 | 6294 | 23,839 | 8118 | 6323 | 8938 | 1957 | 7076 | 5019 | 7469 |
| Household size | ||||||||||||
| 1-5 members | 4980 | 7717 | 36,538 | 15,626 | 15893 | 20,869 | 7187 | 21,157 | 3990 | 7323 | 5871 | 13327 |
| 6-7 members | 8144 | 6751 | 48,533 | 22,959 | 6791 | 16,449 | 6333 | 30,652 | 4858 | 7292 | 8243 | 15042 |
| 8 and above members | 3307 | 5960 | 21,533 | 65,519 | 16,114 | 14,771 | 11,098 | 29,530 | 9560 | 11478 | 6580 | 23707 |
| MPCE | ||||||||||||
| Poorest | 2280 | 7032 | 729 | 17,882 | 1973 | 7664 | 2039 | 20,876 | 1719 | 8750 | 1865 | 10138 |
| Poor | 3693 | 6135 | 3429 | 5425 | 3851 | 15,144 | 5501 | 17,307 | 3333 | 4384 | 3564 | 9514 |
| Medium | 6501 | 9838 | 4458 | 9460 | 10,963 | 13,667 | 4544 | 18,772 | 3518 | 8108 | 4630 | 11687 |
| Rich | 4161 | 7223 | 10,854 | 9913 | 6250 | 21,532 | 6442 | 18,844 | 4293 | 8574 | 4775 | 13256 |
| Richest | 16,790 | 7268 | 101,036 | 69,781 | 24,951 | 32,884 | 11,916 | 39,451 | 13,223 | 11075 | 19958 | 29377 |
| NSS region | ||||||||||||
| Northern | 3825 | 7552 | 7785 | 13,247 | 6452 | 14,939 | 5739 | 23,080 | 5412 | 5976 | 5310 | 11576 |
| Coastal | 7646 | 8516 | 66,733 | 37,866 | 16,206 | 25,192 | 9940 | 28,754 | 3086 | 7688 | 7950 | 19727 |
| Southern | 3990 | 4103 | 21,533 | 8809 | 12,784 | 9466 | 4511 | 11,907 | 5039 | 9128 | 5960 | 8608 |
| Type of health facility | ||||||||||||
| Public | 5471 | 5683 | 9286 | 6398 | 12,418 | 10,756 | 6808 | 14,621 | 4660 | 4655 | 5772 | 8074 |
| Private | 12,180 | 15,428 | 121,341 | 71,995 | 9785 | 40,389 | 11,936 | 47,785 | 8247 | 18778 | 17236 | 36097 |
| Insurance coverage | ||||||||||||
| Not covered | NA | 5010 | NA | 30,690 | NA | 16,401 | NA | 22,211 | NA | 7182 | NA | 15153 |
| Covered | NA | 8228 | NA | 21,013 | NA | 20,257 | NA | 24,691 | NA | 7651 | NA | 12821 |
| Total | 14,576 | 7368 | 42,019 | 23,854 | 11,679 | 19,057 | 7484 | 23,944 | 4406 | 7504 | 6584 | 14585 |
Price is adjusted for inflation. NA indicates lack of information. MPCE, monthly per capita expenditure; CVDs, cardiovascular diseases; NCDs, non-communicable diseases; NSS, national sample survey
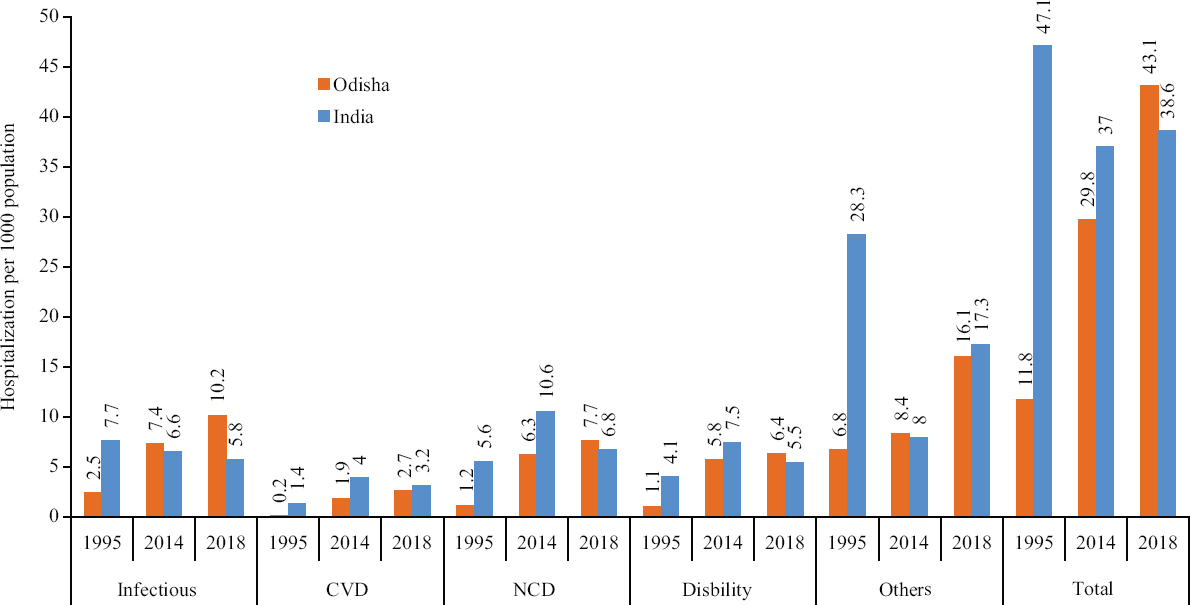
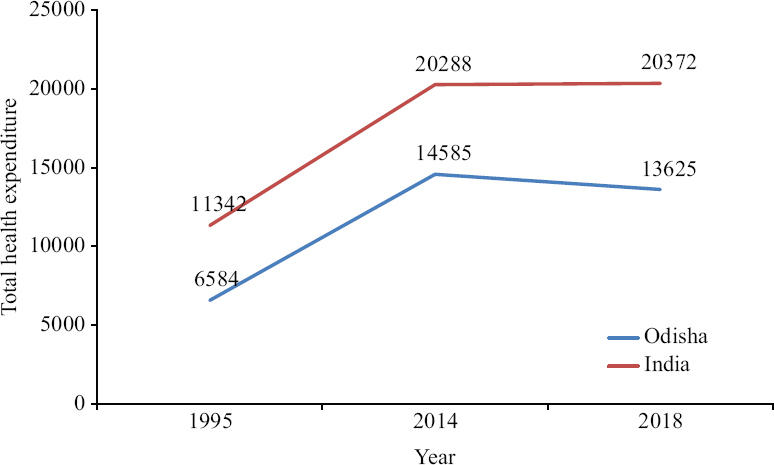
A comparison of hospitalization trend between Odisha and at the all India level indicated that total hospitalization rate in Odisha was lower than the national average in 1995 and 2014. However, the 2018 data suggested that total hospitalization in Odisha surpassed the national average (43/1000 vs. 39/1000 population) (Fig. 1). On the other hand, total health expenditure in Odisha remained consistently lower than the national average over a period of time (Fig. 2).
Discussion
This study revealed that hospitalization in Odisha increased nearly three folds and health expenditure by more than two times between 1995 to 2014. Hospitalization for other diseases remained consistently higher over the period of time. However, the increase in hospitalization for CVDs, disability and NCDs was considerably higher between the last two decades. Similarly, health expenditure for disability was the highest in 2014 and the increase was three times higher than 1995. A decreasing pattern of health expenditure for infectious disease and CVDs during the same period was encouraging.
Hospitalization in Odisha was generally lower than the national average with a few exceptions, but health expenditure was noticeably lower than the national average. Further, the socio-economic and demographic divides in the hospitalization rate and health expenditure were evident. Predisposing factors such as age and marital status played an important role in hospitalization whereas enabling factors likely determined the health expenditure.
The results showed a clear distinction in hospitalization between older population and others as shown earlier9,10. The hospitalization rate among the older population was two times more than others. Similarly, widowed population were exposed to alleviated risk of hospitalization20. Irrespective of the burden of diseases, the health expenditure among the richest MPCE was consistently higher than others21. People with higher level of education as compared to others spent the highest in hospitalization perhaps because they perceived health to be important. Similarly, higher health spending among male, working age population, wealthy households were indicative of ability to pay as well as gender-biased attitude.
Of the three regions in Odisha, the coastal region is considered as a developed region22. The study findings indicated that CVDs and NCDs-related hospitalization were higher in the Coastal region. This trend may indicate availability of healthcare services in the region23. Moreover, higher health expenditure in the coastal region may also indicate the ability to pay as a possible determinant of health expenditure24,25. The data indicated that fever comprised a major part in the other disease categories (data not shown) [In the 71st round of NSS (2014)], morbidity schedule introduced ‘all other fevers’ (includes malaria, typhoid and fevers of unknown origin) in the other disease category; for comparison purpose, fever was classified in other disease in 52nd round of NSS. Tropical diseases such as malaria and other vector-borne diseases are quite prevalent in this region26-28. Although increased rate of hospitalization is a positive sign for curative healthcare point of view, but from a public health perspective, it calls for better intervention strategies to control vector-borne diseases29.
The increasing rate of hospitalization for disability-related illness as well as the highest spending on it may be due to road traffic accidents and injuries30. On the other hand, greater financial burden for accidents and injuries is particularly high in poorer households31. Trauma care facilities and a better financial protection mechanism for disability-related illness in Odisha are essential. The reduction in health expenditure for infectious disease and CVDs over the years is encouraging. However, considering treatment cost for CVDs being commonly high, more studies are needed to understand the reason for this.
The findings needs to be interpreted in light of a few limitations. Health seeking behaviour including accessibility and affordability of health services considerably influence health service utilization. However, these factors were not taken into account in this study because this study was aimed to understand the changing role of socio-economic and demographic determinants (predisposing and enabling factors) to use health services. Second, in India, religion and caste are closely linked to class divisions, however, due to lack of information on religion and other backward class, the influence of these could not be determined in the 52nd round. We clubbed the religion variable considering low sample size for other religions.
The recently launched Biju Swasthya Kalyan Yojana (BSKY) in Odisha is a welcome step for universal health coverage. The experiences from the past have shown that such health insurance schemes have not yielded the desired result. Nevertheless, the new schemes in the State must recognize the unique vulnerabilities of older and widowed population for a better health finance mechanism for them. However, given that percentage share of older population in Odisha is high and expected to increase further, health system needs to prepare for gerontological care by equipping health facilities and training specialized human resources to cater to the needs of the older populations. Hospitalisation depends on epidemiological pattern, availability and access of services at different levels and therefore, it is necessary to take in to account such factors apart from the socio-economic determinants to intervene policy. The health policy of the State needs to prioritise health financing mechanism in reducing patient’s expenditure and optimising hospitalisation rates by ensuring a responsive health system.
Financial support & sponsorship: None.
Conflicts of Interest: None.
References
- Economic impacts of health shocks on households in low and middle income countries:A review of the literature. Global Health. 2014;10:21.
- [Google Scholar]
- Insured yet vulnerable:Out-of-pocket payments and India's poor. Health Policy Plan. 2012;27:213-21.
- [Google Scholar]
- Protecting households from catastrophic health spending. Health Aff (Millwood). 2007;26:972-83.
- [Google Scholar]
- Effect of payments for health care on poverty estimates in 11 countries in Asia:An analysis of household survey data. Lancet. 2006;368:1357-64.
- [Google Scholar]
- Socio-economic differentials in impoverishment effects of out-of-pocket health expenditure in China and India:Evidence from WHO SAGE. PLoS One. 2015;10:e0135051.
- [Google Scholar]
- 2017. National health policy 2017. MoHFW, GoI
- Tracking universal health coverage:First global monitoring report. Geneva: WHO; 2015.
- Emerging trends and patterns of self-reported morbidity in India:Evidence from three rounds of national sample survey. J Health Popul Nutr. 2017;36:32.
- [Google Scholar]
- Hospitalisation trends in India from serial cross-sectional nationwide surveys: 1995 to 2014. BMJ Open. 2017;7:e014188.
- [Google Scholar]
- Trends in catastrophic health expenditure in India: 1993 to 2014. Bull World Health Organ. 2018;96:18-28.
- [Google Scholar]
- Geographic variation in household and catastrophic health spending in India:Assessing the relative importance of villages, districts, and states, 2011-2012. Milbank Q. 2018;96:167-206.
- [Google Scholar]
- Inequity in out-of-pocket payments for hospitalisation in India:Evidence from the National Sample Surveys, 1995-2014. Soc Sci Med. 2018;201:136-47.
- [Google Scholar]
- Morbidity and treatment of ailments, Report no. 441. New Delhi: NSSO; 1998.
- Social consumption in India, Health (NSSO 71st Round, January-June 2014). New Delhi: NSSO; 2014.
- Revisiting the behavioral model and access to medical care:Does it matter? J Health Soc Behav. 1995;36:1-10.
- [Google Scholar]
- Does affordability matter? Examining the trends and patterns in health care expenditure in India. Health Serv Manage Res. 2020;33:207-18.
- [Google Scholar]
- International statistical classification of diseases and related health problems 10th revision. Geneva: WHO; 2010.
- The handbook of statistics on the Indian economy, 2019-20. Available from: https://rbidocs.rbi.org.in/rdocs/Publications/PDFs/0HBS202024D4CA0CC03F4674 B040F7 DEDE7E5360.PDF
- Morbidity patterns and health care seeking behavior among older widows in India. PLoS One. 2014;9:e94295.
- [Google Scholar]
- Cost of hospitalisation for non-communicable diseases in India:Are we pro-poor? Trop Med Int Health. 2016;21:1019-28.
- [Google Scholar]
- Patterns of health service utilization and perceptions of needs and services in rural Orissa. Health Policy Plan. 2005;20:176-84.
- [Google Scholar]
- Utilization of inpatient care from private hospitals:Trends emerging from Kerala, India. Health Policy Plan. 2010;25:437-46.
- [Google Scholar]
- Understanding levels of morbidity and hospitalization in Kerala, India. Bull World Health Organ. 2002;80:746-51.
- [Google Scholar]
- Factors affecting treatment-seeking for febrile illness in a malaria endemic block in Boudh district, Orissa, India:Policy implications for malaria control. Malar J. 2010;9:377.
- [Google Scholar]
- Geographical information system (GIS) in decision support to control malaria –A case study of Koraput district in Orissa, India. J Vector Borne Dis. 2009;46:72-4.
- [Google Scholar]
- Trends in malaria in Odisha, India –An analysis of the 2003 –2013 time-series data from the national vector borne disease control program. PLoS One. 2016;2013:1-16.
- [Google Scholar]
- Persistent foci of falciparum malaria among tribes over two decades in Koraput district of Odisha State, India. Malar J. 2013;12:72.
- [Google Scholar]
- Community perceptions on malaria and care-seeking practices in endemic Indian settings:Policy implications for the malaria control programme. Malar J. 2013;12:39.
- [Google Scholar]
- Road traffic accidents and injuries in India high spending on hospitalised treatment. Econ Polit Wkly. 2018;53:52-60.
- [Google Scholar]
- Burden of out-of-pocket expenditure for road traffic injuries in urban India. BMC Health Serv Res. 2012;12:285.
- [Google Scholar]


