
Translate this page into:
Genetic variations in the Dravidian population of South West coast of India: Implications in designing case-control studies
Reprint requests: Dr. Lekha Pandit, KS Hegde Medical Academy, Nitte University, Mangaluru 575 018, Karnataka, India e-mail: panditmng@gmail.com
-
Received: ,
This is an open access article distributed under the terms of the Creative Commons Attribution-NonCommercial-ShareAlike 3.0 License, which allows others to remix, tweak, and build upon the work non-commercially, as long as the author is credited and the new creations are licensed under the identical terms.
This article was originally published by Medknow Publications & Media Pvt Ltd and was migrated to Scientific Scholar after the change of Publisher.
Abstract
Background & objectives:
Indian data have been largely missing from genome-wide databases that provide information on genetic variations in different populations. This hinders association studies for complex disorders in India. This study was aimed to determine whether the complex genetic structure and endogamy among Indians could potentially influence the design of case-control studies for autoimmune disorders in the south Indian population.
Methods:
A total of 12 single nucleotide variations (SNVs) related to genes associated with autoimmune disorders were genotyped in 370 healthy individuals belonging to six different caste groups in southern India. Allele frequencies were estimated; genetic divergence and phylogenetic relationship within the various caste groups and other HapMap populations were ascertained.
Results:
Allele frequencies for all genotyped SNVs did not vary significantly among the different groups studied. Wright's FST was 0.001 per cent among study population and 0.38 per cent when compared with Gujarati in Houston (GIH) population on HapMap data. The analysis of molecular variance results showed a 97 per cent variation attributable to differences within the study population and <1 per cent variation due to differences between castes. Phylogenetic analysis showed a separation of Dravidian population from other HapMap populations and particularly from GIH population.
Interpretation & conclusions:
Despite the complex genetic origins of the Indian population, our study indicated a low level of genetic differentiation among Dravidian language-speaking people of south India. Case-control studies of association among Dravidians of south India may not require stratification based on language and caste.
Keywords
Case-control studies
Dravidian population
single nucleotide variations

Single nucleotide variations (SNVs) are the most common DNA variations in the human genome. Genome-wide association studies (GWASs) have been performed to identify risk alleles attributable to complex disease traits using subsets of common SNVs seen among European populations. Most common SNVs are likely to be found in most populations, but allele frequencies will vary. The transferability of this information to non-Europeans with inherent differences in linkage disequilibrium patterns is not clearly established. Studies on non-European populations, particularly Indians and African-Americans, suggest that disease-related SNVs previously validated in European populations may be similar12.
A case-control model is vital to the conduct of these studies. In White European population lacking significant genetic heterogeneity, it is possible to use common controls. The best example is the Wellcome Trust Case-Control Consortium which for the first time used shared controls effectively in GWASs3. This is not feasible in India which has rigid socio-cultural practices that allow division along caste and tribal and religious lines. There is also inbuilt endogamy which complicates the genetic origin4. The lack of genomic databases that have incorporated data from Indian populations is a serious drawback to designing association studies for complex disorders56. Indian population is represented in the Gujarati in Houston (GIH) subset (101 healthy Indians) in the HapMap 37. Recent studies indicate that these data may not be representative for Indians on whole, particularly for the Dravidian population of southern India8. In view of the complex genetic structure and diversity, it is likely that while designing case-control studies in India, it is important to include factors related to caste, language and geography910. The present study was conducted to evaluate some SNVs related to immune response in a carefully selected group of healthy individuals from southern India to understand if any of these factors were important in the design of case-control studies in the Indian scenario.
Material & Methods
The present study was conducted at the Center for Advanced Neurological Research, KS Hegde Medical Academy, Nitte University, Mangalore, Karnataka, India, between August 2012 and December 2015. Healthy individuals selected for this study were from the control arm of an ongoing study on genetic susceptibility to multiple sclerosis (MS) in Indian population111. They were individuals matched for ethnicity, language, caste and area of living with individual MS patients. Healthy volunteers were from within a 500 km2 radius of the investigation site based in the city of Mangalore in Karnataka. They belonged to the coastal towns of two adjoining southern States of Karnataka and Kerala in India.
In total 370 individuals were included in the study, and six prominent caste groups in the region were selected. From coastal Karnataka, there were Bunts (52) and Brahmins (50); from coastal Kerala, there were Thiyya (59) and Nairs (57). The Christians (52) and Malabar Muslims (100) from both Kerala and Karnataka were considered together. Through a previously validated screening questionnaire12, individuals with diabetes, bronchial asthma, arthritic disorders and thyroid disease were excluded. Individuals from known mixed marriages were also excluded from this study. Written informed consent was taken from all participants. The study protocol was approved by the Institutional Ethics Committee.
DNA isolation and quantification: Blood samples from 370 healthy individuals were collected in EDTA vials. Genomic DNA was extracted from the collected blood samples by conventional salting out technique13. After extraction, the DNA was quantified on a NANO DROP 2000 Spectrophotometer (Thermo Fisher Scientific Inc., USA) to determine the concentration, and its purity was examined using standard A260/A280 ratio. DNA samples were normalized to 5 ng/μl.
Single nucleotide variation (SNV) selection and genotyping: Twelve SNVs were selected1 for genotyping of samples. SNV genotyping was performed using pre-designed TaqMan SNP genotyping assays (Applied Biosystems, Foster City, CA, USA). DNA amplification was carried out on an ABI7500 Real Time PCR genotyping platform. Four microlitres of normalized genomic DNA (5 ng/μl) was aliquoted into MicroAmp® Optical 96-Well Reaction Plates (Applied Biosystems). The DNA samples were dried down completely. Each PCR contained 20 ng DNA, 12.5 μl TaqMan Universal PCR Master Mix (2×), 1.25 μl single nucleotide polymorphism (SNP) genotyping assay (20×)1 and 11.25 μl DNase-free water (Applied Biosystems). The PCR conditions were as follows: 60°C for one min, 95°C for 10 min, followed by 40 cycles of 95°C for 15 sec and 60°C for one min. After PCR amplification, endpoint plate read was performed on an Applied Biosystems 7500 Real-Time PCR System using Sequence Detection System software v 1.4.1.
Statistical analysis: Hardy-Weinberg equilibrium (HWE) and allele frequencies were determined. Wright's FST was performed to look at variation in allele frequency between populations. Analysis of molecular variance (AMOVA) was done to investigate the proportion of genetic variations within and among studied populations. The phylogenetic relationships were estimated with multidimensional scaling (MDS) analysis. HWE and Wright's FST were determined using Arlequin Program v 3.014. Allele frequency, MDS analysis (after calculating Nei's15 standard genetic distance using GDA software16) and comparison of minor allele frequency (MAF) of Dravidian with HapMap population were done using linear-by-linear association Chi- square test in SPSS software v 20.0 (SPSS, Chicago, IL, USA).
Results
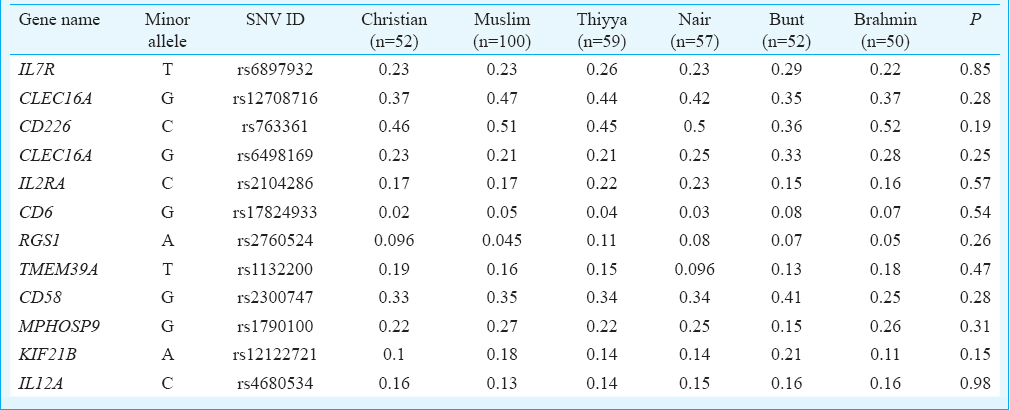
A total of 370 healthy individuals (male=171, female=199, mean age 37.4±11.90 yr) were genotyped. Among those genotyped, SNVs typed 10 were in HWE. Two SNVs (rs2760524 & rs1132200) showed a deviation which was <0.001 and were included after excluding typing error. The distribution of MAFs of all 12 gene-associated SNVs included in this study is summarized in the Table. There was no significant difference in MAF between the six different caste groups included in our study. The average Wright's FST over all loci among the six caste groups was 0.001 per cent. When all six caste groups were clumped together and compared with GIH population, the average FST was 0.38 per cent.
The AMOVA was used to study the genetic differentiation among studied population. The AMOVA results showed that irrespective of any grouping; about 97 per cent variation was attributable to differences within the studied populations. There was only a minimal variation of less than one per cent among different caste groups.
Comparison of MAF of Dravidian with HapMap population showed that majority of SNVs tested were significantly (P<0.001) different between Dravidian and HapMap population except for CLEC16A (rs12708716) and RGS1 (rs2760524).
To understand the phylogenetic relationship between our data and world populations, the present genotyped data were compared with HapMap Phase 3 populations [Yoruba people of Ibadan, Nigeria; Utah residents with Northern and Western European ancestry from the CEPH collection (CEU); Han Chinese from Beijing; Japanese from Tokyo and GIH, USA]. A MDS analysis was performed. Separation between the two Indian populations (our study populations and GIH populations) was evident in MDS plot (Figure). We observed that the south Indian Dravidian language-speaking population was clustered separately from rest of the HapMap population in both first and second dimensions. The GIH population clearly aligned closer to CEU population.
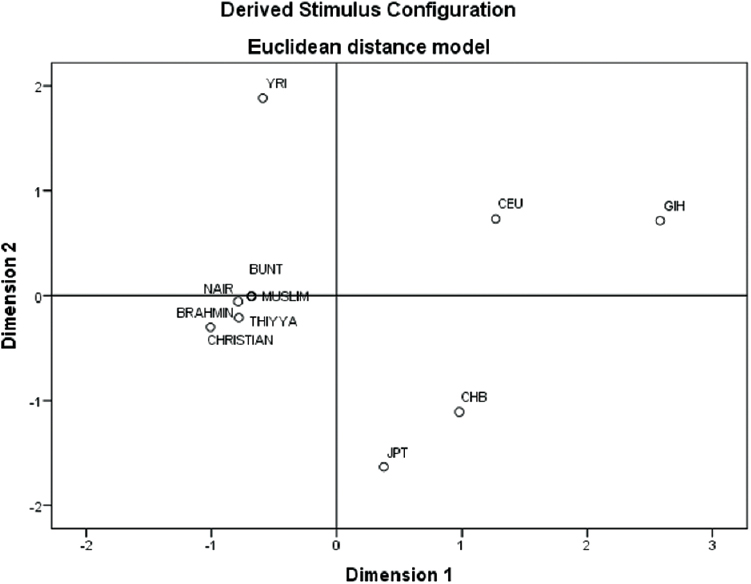
- Multidimensional scaling plot depicting genetic distances among the studied population with HapMap populations.
Discussion
Within India, two broad sub-groups exist, namely the Indo-European language-speaking (represented in the GIH population in the HapMap) and the south Indian Dravidian language-speaking populations8. Genetically, the ancestral North Indian (ANI) who had affiliations with the Middle Eastern and Europeans populations is distinct from the ancestral South Indian (ASI). The present-day populations in India are a mixture of both and have ANI ancestry of 39-71 per cent10. Allele frequencies vary among populations within India17 and are much higher than reported in Europeans18. The difference in allele frequencies may be due to many common founder effects and limited gene flow.
In our previous study1, genetic susceptibility for MS was evaluated among Indians using a case-control model. Twelve SNVs (analysis of risk allele frequency, which is most often the major allele frequency) were genotyped in this study, which were previously validated through GWASs and shown to be associated with MS among White Europeans19202122. Our study1 and others2 have shown that irrespective of ethnic diversity, there is remarkable overlap in risk allele frequencies among the populations studied and implicated genes associated with immune response.
The MAFs of all 12 SNVs included in this study showed no significant difference between the six different caste groups studied. Wright's FST showed that the genetic differentiation between the various subgroups was very low and similar to the previously published studies on Dravidian populations17. However, we observed a large variation when we compared our study population with GIH population represented in the HapMap. A similar result was obtained in another study that compared Dravidian language-speaking Tamil Indians (INS) from the Singapore Genome Variation Project with GIH population8. The AMOVA results showed that irrespective of any grouping, about 97 per cent variation was attributable to differences within the study population. There was a genetic divergence of the Dravidian population from other HapMap populations including GIH population. The Dravidian language-speaking individuals included in this study segregated distinctly into a tight cluster away from Indo-Aryan language speakers including GIH and CEU populations. In the MDS plot, the GIH population was aligned close to CEU population and supported the existing view of European influences in the genetic composition of north Indian populations.
In conclusion, our study suggested that Dravidian language-speaking populations of south India did not show significant patterns of genetic differentiation. Among non-tribal populations of south India, evaluation of risk alleles associated with disease may not require stratification for language or caste, while the same may not hold good for studies that involve mixed populations from the north and south of the country.
Our study being preliminary in nature had a limitation of small sample size. Only a few subsets of Dravidians from coastal Karnataka and Kerala were included. A larger sample size is required representing all Dravidian subsets in the region in the future to confirm these finding.
Acknowledgment
This study was supported by funding received from the Department of Science and Technology, Government of India, New Delhi (SR/SO/HS/127/2010) and senior research fellowship (SRF) to the first author (AD).
Conflicts of Interest: None.
References
- Evaluation of the established non-MHC multiple sclerosis loci in an Indian population. Mult Scler. 2011;17:139-43.
- [Google Scholar]
- An ImmunoChip study of multiple sclerosis risk in African Americans. Brain. 2015;138(Pt 6):1518-30.
- [Google Scholar]
- Wellcome Trust Case Control Consortium. Genome-wide association study of 14,000 cases of seven common diseases and 3,000 shared controls. Nature. 2007;447:661-78.
- [Google Scholar]
- Complex genetic origin of Indian populations and its implications. J Biosci. 2012;37:911-9.
- [Google Scholar]
- Whole-genome patterns of common DNA variation in three human populations. Science. 2005;307:1072-9.
- [Google Scholar]
- SNP500Cancer: A public resource for sequence validation, assay development, and frequency analysis for genetic variation in candidate genes. Nucleic Acids Res. 2006;34:D617-21.
- [Google Scholar]
- International HapMap3 Consortium. Integrating common and rare genetic variation in diverse human populations. Nature. 2010;467:52-8.
- [Google Scholar]
- Characterizing the genetic differences between two distinct migrant groups from Indo-European and Dravidian speaking populations in India. BMC Genet. 2014;15:86.
- [Google Scholar]
- Indian Genome Variation Consortium. Genetic landscape of the people of India: A canvas for disease gene exploration. J Genet. 2008;87:3-20.
- [Google Scholar]
- Environmental factors related to multiple sclerosis in Indian population. PLoS One. 2015;10:e0124064.
- [Google Scholar]
- A simple salting out procedure for extracting DNA from human nucleated cells. Nucleic Acids Res. 1988;16:1215.
- [Google Scholar]
- Arlequin (version 3.0): An integrated software package for population genetics data analysis. Evol Bioinform Online. 2007;1:47-50.
- [Google Scholar]
- Molecular evolutionary genetics. New York: Columbia University Press; 1987.
- Genetic Data Analysis: Computer Program for the Analysis of Allelic Data. Release 1.1. Connecticut, United States of America: Department of Ecology and Evolution, University of Connecticut; 2002.
- Low levels of genetic divergence across geographically and linguistically diverse populations from India. PLoS Genet. 2006;2:e215.
- [Google Scholar]
- Correlation between genetic and geographic structure in Europe. Curr Biol. 2008;18:1241-8.
- [Google Scholar]
- International Multiple Sclerosis Genetics Consortium (IMSGC). Risk alleles for multiple sclerosis identified by a genomewide study. N Engl J Med. 2007;357:851-62.
- [Google Scholar]
- Meta-analysis of genome scans and replication identify CD6, IRF8 and TNFRSFIA as new multiple sclerosis susceptibility loci. Nat Genet. 2009;41:776-82.
- [Google Scholar]
- The role of the CD58 locus in multiple sclerosis. Proc Natl Acad Sci U S A. 2009;106:5264-9.
- [Google Scholar]
- International Multiple Sclerosis Genetics Consortium (IMSGC). Comprehensive follow-up of the first genome-wide association study of multiple sclerosis identifies KIF21B and TMEM39A as susceptibility loci. Hum Mol Genet. 2010;19:953-62.
- [Google Scholar]


