
Translate this page into:
Fibroscan as a non-invasive predictor of hepatic steatosis in women with polycystic ovary syndrome
For correspondence: Dr Mohd Ashraf Ganie, Department of Endocrinology & Metabolism, All India Institute of Medical Sciences, Ansari Nagar, New Delhi 110 029, India e-mail: ashraf.endo@gmail.com
-
Received: ,
This is an open access journal, and articles are distributed under the terms of the Creative Commons Attribution-NonCommercial-ShareAlike 4.0 License, which allows others to remix, tweak, and build upon the work non-commercially, as long as appropriate credit is given and the new creations are licensed under the identical terms.
This article was originally published by Wolters Kluwer - Medknow and was migrated to Scientific Scholar after the change of Publisher.
Abstract
Background & objectives:
There is limited data on non-alcoholic fatty liver disease (NAFLD) among Indian women with polycystic ovary syndrome (PCOS), and there are no data on the utility of fibroscan in its assessment. The objective of this study was thus to investigate the frequency of hepatic steatosis in young women with PCOS and evaluate the utility of transient elastography (TE) in its assessment.
Methods:
Seventy women diagnosed with PCOS and 60 apparently healthy women (controls) were enrolled in this pilot study. These women were evaluated for clinical, biochemical and hormonal parameters, transabdominal ultrasonography, dual-energy X-ray absorptiometry and fibroscan assessing liver stiffness measure (LSM) and controlled attenuation parameter (CAP). Other indices such as liver fat score (LFS), lipid accumulation product (LAP), fibrosis-4 (FIB-4) and aspartate aminotransferase to platelet ratio index, hepatic steatosis index (HIS) scores were also calculated. The main outcome measures were the presence of NAFLD in women with PCOS and its correlation with CAP and LSM on TE.
Results:
Women with PCOS had higher frequency (38.57 vs. 6.67%) of hepatic steatosis than control women as determined by abdominal sonography. The aminotransferases were higher in PCOS group (14.28 vs. 1.7%, P=0.03) even after adjusting for body mass index implying higher non-alcoholic steatohepatitis among young PCOS patients. PCOS women had significantly higher CAP on TE compared to controls (210 vs. 196). CAP had a significant correlation with LFS, LAP and HIS.
Interpretation & conclusions:
NAFLD is common in young women with PCOS, and fibroscan using TE may be considered as a promising non-invasive diagnostic modality in its early detection.
Keywords
Fibroscan
non-alcoholic fatty liver disease
polycystic ovary syndrome
steatosis
transient elastography

Polycystic ovary syndrome (PCOS), a heterogeneous disorder commonly affecting women in their reproductive age, is a potential risk factor for the development of non-alcoholic fatty liver disease (NAFLD). Various studies have linked insulin resistance (IR) to be the common denominator in both PCOS and NAFLD123. In addition, hyperandrogenism found in PCOS has also been linked to NAFLD implying that NAFLD with its long-term consequences in PCOS should not be underestimated. Some investigators suggest early screening using either ultrasound sonography (USG) alone or in combination with the estimation of liver enzymes4; however, various societies like the Endocrine Society, do not recommend routine NAFLD screening in PCOS women5. They recommend the evaluation of serum markers of liver function in women having metabolic syndrome (MS) and IR, followed by ultrasound and liver biopsy in selected cases5. Identifying PCOS women at risk of NAFLD may help in early intervention in these women to prevent their serious long-term complications. Transient elastography (TE) estimating liver stiffness measure (LSM) and controlled attenuation parameter (CAP) in NAFLD measuring hepatic fibrosis and steatosis, respectively, has shown good correlation with histology in patients with various hepatic pathologies67 thus, obviating the need for liver biopsy. Apart from a few studies, there are limited data on NAFLD among Indian women with PCOS89 and studies using non-invasive modality of TE are sparse. Therefore, this study was aimed to evaluate the presence of NAFLD among adolescent women with PCOS by USG and evaluate the utility of non-invasive technique of TE on fibroscan as a diagnostic modality for PCOS.
Material & Methods
The present cross-sectional study was conducted in the departments of Endocrinology & Metabolism and Gastroenterology at All India Institute of Medical Sciences (AIIMS), New Delhi, India, from January 2015 to July 2016. Consequent adolescent girls and young women in the age group of 16-24 yr attending endocrine clinic for complaints suggestive of PCOS were the potential individuals for the study. Those who qualified Rotterdam 2003 criteria for the diagnosis of PCOS10 were enrolled in the study. A control group included age-matched apparently healthy, non-hirsute woman who had long-term, predictable eumenorrhoea, without any history of endocrine disorders and normal ovarian morphology on USG. The exclusion criteria were thyroid dysfunction, hyperprolactinaemia, Cushing's syndrome, non-classical congenital adrenal hyperplasia and androgen-secreting tumours. Women taking any drug(s) or hormonal preparations (e.g., metformin, oral contraceptive pills, anti-epileptics, etc.) that may influence weight or hepatic fat accumulation or those with known diabetes mellitus (DM), renal, hepatic or cardiac dysfunction, were excluded. The patients having USG suggestion of fatty liver or elevated liver enzymes (two times upper limit of normal) underwent all viral (hepatitis B surface antigen, anti-hepatitis C virus), autoimmune (AMA) and metabolic marker (serum ferritin, α1 antitrypsin) assessment to exclude other cases of hepatitis. The diagnosis of NAFLD was based on hepatic steatosis on USG or biochemistry in the absence of alcohol consumption (not more than 20 g/day), competing causes such as viral hepatitis and drug-induced hepatitis11. Women who refused to provide consent (parents in case of minor girls) were also excluded. After exclusions and consent refusals 70 drug naïve women with PCOS and 60 age-matched healthy women were prospectively studied. The study protocol was approved by the Institutional Ethics Committee.
Clinical assessment
History: A detailed history was taken from all the eligible women on a predesigned proforma with special emphasis on menstrual cyclicity (age of menarche, number of cycles per year, phases of amenorrhoea), features of hyperandrogenism (acne vulgaris, androgenic alopecia, hirsutism), weight status, any systemic sickness or drug history (glucocorticoids, insulin sensitizers, hepatotoxicagents or drugs known to interfere with insulin sensitivity or glucose tolerance).
Examination: All women in the study and control groups underwent anthropometric assessment including height (cm), weight (kg), waist-hip circumference (cm) and a proper systemic examination. Measurements were performed with patients barefoot in light clothing and by a single examiner. Height was measured with wall mount Harpenden Stadiometer (Holtain Ltd., UK) and recorded to the nearest 0.1 cm. Body weight was measured on a digital scale balance and recorded to the nearest 0.1 kg. Waist circumference (WC) was measured at midway between lowest rib margin and iliac crest while hip circumference was measured at the widest levels over the greater trochanters. Modified Ferriman-Gallwey score was used to assess the degree of hirsutism. A score of ≥8 out of 36 was taken as significant12. Women were also examined for the presence of acanthosis nigricans, the severity of acne and extent of androgenic alopecia. PCOS was defined using Rotterdam criteria (i.e., by the presence of at least two of the following three features: clinical and biochemical hyperandrogenism, chronic oligo-anovulation and polycystic ovaries, after exclusion of secondary causes).
Investigations: Women were subjected to various investigations between days 2 and 6 of their respective menstrual cycles (early follicular phase of spontaneous or medroxy progesterone-induced menstrual cycle). Oral glucose tolerance test (OGTT) was performed between 0800 h and 0900 h after overnight fasting (10-12 h). Blood samples (5 ml) were collected at 0, 60 and 120 min after an oral load of 75 g anhydrous glucose dissolved in 200-300 ml of water. Blood samples were separated in cold centrifuge at 4°C and then aliquoted. The samples for glucose, electrolytes, lipids, liver and kidney function tests were analyzed on the same day. The samples for T3 (triiodothyronine), T4 (thyroxine), thyroid-stimulating hormone (TSH), luteinizing hormone (LH), follicle-stimulating hormone (FSH), prolactin, total testosterone, insulin and cortisol (morning) were stored at −70°C until analysis.
Assays: Blood glucose was estimated by the hexokinase method13 and all the biochemical tests were done on an automated analyzer with standard commercial kits (Cobas Integra 400 plus, Roche Diagnostics, USA). Liver function tests were done in all women for abnormal aminotransferase levels [aspartate aminotransferase (AST) and alanine aminotransferase (ALT) ≥40 U/l). The assays for all hormones were done by electrochemiluminescence immunoassay (ECLIA) analyzer (Cobase 411, Roche Diagnostics, USA). Intra- and inter-assay coefficients of variations were within limits permitted by the manufacturers.
Ultrasound abdomen and body composition: A single observer performed transabdominal ultrasonography to determine features of polycystic ovaries defined as the presence of 10 or more peripheral follicles each measuring 2-9 mm in size with echogenic ovarian stroma and/or increased ovarian volume. Fatty liver on ultrasound was quantitated as grade I: increased hepatic echogenicity with visible periportal and diaphragmatic echogenicity, grade II: increased hepatic echogenicity with imperceptible periportal echogenicity, without obscuration of the diaphragm, grade III: increased hepatic echogenicity with imperceptible periportal echogenicity and obscuration of the diaphragm14.
Body composition analysis was performed in both groups using DEXA (dual X-ray absorptiometry) (Discovery A 84023, Hologic Inc., USA) to measure lean mass, total fat and regional fat mass. A coefficient of variation for replicate measurements was 1.5 per cent.
Fibroscan transient elastography: TE for estimation of LSM and CAP was done using the Fibroscan (Echosens, France) for the detection of liver fibrosis. The examination was performed in supine position starting from the mid-axillary line using 'M' probe. At least 10 valid examinations were made for each patient by a single examiner. This technique uses both ultrasound (5 MHz) and low frequency (50 Hz) elastic waves with a propagation velocity directly related to the stiffness of the liver [Young's elastic modulus E=3 pv2 (P=density, v=shear velocity)].
Other measurements: Homeostasis model assessment of IR (HOMA-IR) was calculated as fasting insulin (I0, μU/ml)×fasting glucose (G0, mol/dl)/22.5. The quantitative insulin sensitivity check index (QUICKI) was calculated as 1/(logI0+logG0)15. Low-density lipoprotein (LDL) cholesterol was calculated by the Friedewald formula16. Biochemical hyperandrogenism was diagnosed using increased levels of serum testosterone (normal range <48 ng/dl) as per kit (Elecsys Testosterone II Immunoassay, Roche Diagnostics,USA) used for assay. Non-invasive markers of liver injury were also calculated. Liver fat score (LFS) was calculated using the formula [−2.89+1.18×MS (yes=1, no=0)+0.45×type 2 DM (T2DM) (yes=1, no=0)+0.15×fasting serum insulin (mU/l+0.04×AST (U/l)−0.94×(AST/ALT)]. Lipid accumulation product (LAP) was determined as [(WC-58)×triglycerides (TGs)]. FIB-4 was calculated as [Age×AST(U/l)]/[(Platelets(N×103/μl)×ALT(U/l)1/2]. AST to platelet ratio index (APRI) was calculated: 100×(AST/upper normal limit of AST)/platelets. Hepatic steatosis index (HIS) was calculated as 8×(ALT/AST)+body mass index (BMI)+2×(female)+2×(T2DM).
Statistical analysis: All statistical analyses were performed with the Statistical Package for Social Sciences version 23.0 (SPSS Inc., Chicago, IL, USA); and the plots were generated using Stata (StataCorp LP, TX, USA). The Shapiro-Wilk statistic was used to test for normality of data. Difference between the means was analyzed using Student's t test and Mann-Whitney U-test according to the distribution of data. Multivariable analysis was used to study the difference between the groups with and without NAFLD. The correlation of CAP and LSM with parameters such as IR, hyperandrogenism, fat distribution and non-invasive indices of NAFLD was assessed.
Results
A total of 130 women (n=70 drug naïve women with PCOS and 60 age-matched healthy controls) were studied. Clinical, biochemical, hormonal, imaging and insulin sensitivity parameters of the two groups are given in Table I. The number of menstrual cycles among women with PCOS was significantly lesser than in controls (P<0.01). Women with PCOS had higher BMI, WC, waist-hip ratio and FG scores than controls (P<0.01). PCOS women demonstrated higher serum LH, total testosterone, DHEAS, triglyceride levels, fasting serum insulin, area under the curve (AUC) for insulin, HOMA, QUICKI, fasting glucose to insulin ratio (FGIR), total body fat, truncal fat and CAP (P<0.05 & <0.01). LSM values though were higher in PCOS women but did not reach at significance. There was no significant difference between the two groups regarding mean age, age at menarche, blood pressure, total body fat and high-density lipoprotein (HDL) cholesterol (Table I).
| Variable | Mean±SD | |
|---|---|---|
| PCOS (n=70) | Controls (n=60) | |
| Age (yr) | 20.41±2.49 | 21.02±1.90 |
| Number of menstrual cycles per year | 7.68±3.75** | 11.7±0.57 |
| Weight (kg) | 60.6±17.49** | 54.03±10.26 |
| BMI (kg/m2) | 25.12±4.6** | 22.3±3.91 |
| FG score | 10.5±4.49** | 3.96±1.13 |
| SBP (mm Hg) | 115.2±19 | 111.02±11.98 |
| DBP (mm Hg) | 76.38±13.23 | 73.98±7.44 |
| Blood glucose zero hour (mg/dl) | 85.89±19.07 | 84.22±8.45 |
| Blood glucose 2 h post-OGTT (mg/dl) | 95.43±25.64 | 88.55±15.63 |
| Serum total cholesterol (mg/dl) | 158.21±29.9 | 152.32±25 |
| Serum LDL cholesterol (mg/dl) | 90.36±25.99 | 84.68±24.46 |
| Serum HDL cholesterol (mg/dl) | 48.09±12.91 | 48.08±10.12 |
| Serum TGs (mg/dl) | 98.96±37.6* | 85.5±29.63 |
| Serum AST levels (IU/l) | 26.6±10.89 | 22.42±6.22 |
| Serum ALT levels (IU/l) | 26.58±19.79** | 17.17±6.05 |
| Serum LH (mIU/l) | 8.26±4.2** | 5.53±3.3 |
| Serum FSH (mIU/l) | 5.91±1.48 | 5.59±1.85 |
| Serum total testosterone (ng/dl)† | 60.45 (23.6)** | 26.62 (9.9) |
| Serum DHEAS (µg/dl) | 275.75±145.75** | 203.25±122.45 |
| Serum insulin zero hour (µU/ml)† | 12.64 (11.61)** | 9.57 (7.01) |
| Serum insulin 2 h post-OGTT (µU/ml)† | 39.86 (57.10) | 36.35 (35.78) |
| HOMA† | 4.23 (5.1)** | 2.25 (1.18) |
| QUICKI† | 0.328 (0.034)** | 0.346 (0.027) |
| FGIR† | 7.3 (4.16)** | 9.68 (4.55) |
| LSM (kPa)† | 4.5 (1.3) | 4.1 (1.25) |
| CAP (dB/m)† | 210 (82)** | 196 (50.8) |
| LFS | 0.602±0.56** | −1.66±0.12 |
| LAP | 27.31±18.41** | 12.76±10.62 |
| HIS | 36.59±5.10 | 35.41±4.86 |
| FIB-4 | 0.498±0.23 | 0.507±0.26 |
| APRI | 0.294±0.142** | 0.248±0.137 |
| Total body fat | 32.2±4.76** | 29.75±5.19 |
| Trunk fat mass (g) | 8402.83±3145.56** | 6284.59±2814.25 |
P*<0.05, **<0.01 compared to controls. †Median and IQR. BMI, body mass index; FG, Ferriman-Gallwey; SBP, systolic blood pressure; DBP, diastolic blood pressure; OGTT, oral glucose tolerance test; LDL, low-density lipoprotein; HDL, high-density lipoprotein; AST, aspartate aminotransferase; ALT, alanine transaminase; LH, luteinizing hormone; FSH, follicle-stimulating hormone; DHEAS, dehydroepiandrosterone; FGIR, fasting glucose to insulin ratio; HOMA, homeostasis model assessment; QUICKI, quantitative insulin sensitivity check index; TGs, triglycerides; IQR, interquartile range; LSM, liver stiffness measure; CAP, controlled attenuation parameter; LFS, liver fat score; LAP, lipid accumulation product; HIS, hepatic steatosis index; FIB-4, fibrosis-4; APRI, AST to platelet ratio index
NAFLD was present in 38.57 per cent (n=27) PCOS patients (95% confidence interval (CI): 27.2-50.9) and 6.67 per cent (n=4) controls (95% CI: 1.8-16.1). About 35.71 per cent (n=25) PCOS patients had grade I and 2.86 per cent (n=2) had grade II fatty liver. Serum liver enzyme profile showed AST and ALT ≥40 U/l in five (7.14%) and eight (11.43%) women with PCOS. The results of fibroscan among PCOS women showed significantly increased CAP (210 vs. 196 dB/m, P=0.01), but LSM was not different among the groups (Table I). When women were BMI matched and compared 21 obese women with PCOS had NAFLD compared to two obese controls (P=0.006), and six lean women with PCOS had hepatic steatosis compared to two lean controls (P=0.02). Of the non-invasive markers, PCOS women had significantly higher LFS, LAP and APRI scores; however, FIB-4 and HIS were not significantly different. A comparison of PCOS women with and without NAFLD is shown in Table II. MS using ATP III criteria was seen in 30 per cent (n=21) of women with PCOS as compared to 30.39 per cent (n=18) of controls (P=0.01) while as abnormal glucose tolerance was seen in 12.9 per cent (n=9) as compared to 1.67 per cent (n=1) of healthy women (P<0.01). Among women with PCOS, 5.71 per cent (n=4) had impaired fasting glucose (IFG), 2.86 per cent (n=2) had impaired glucose tolerance (IGT) and 10 per cent (n=7) had both IFG and IGT. About 61.43 per cent (n=43) had fasting serum insulin >10 μIU/ml suggesting fasting hyperinsulinemia.
| Variable | Mean±SD | |
|---|---|---|
| PCOS without NAFLD (n=43) | PCOS with NAFLD (n=27) | |
| Age (yr) | 20.81±2.67 | 19.48±2.03 |
| Number of menstrual cycles per year | 8.53±3.97 | 8.92±3.42 |
| Weight (kg) | 56.81±10.36** | 64.82±12.85 |
| BMI (kg/m2) | 24.09±4.29* | 26.74±4.67 |
| WC (cm) | 78.86±9.89* | 84.37±9.39 |
| WHR | 0.873±0.15 | 1.12±1.28 |
| Serum HDL cholesterol (mg/dl) | 49.23±11.30 | 46.63±15.59 |
| Serum TGs (mg/dl) | 89.02±34.44** | 114.78±37.59 |
| GGT (IU/l) | 23.45±8.9 | 22.71±14.4 |
| AST/ALT ratio | 1.27±0.54* | 1.04±0.3 |
| Serum total testosterone (ng/dl)† | 48.5 (24.4) | 62.1 (20.2) |
| Serum DHEAS (µg/dl)† | 259.5 (161.9) | 280.1 (123.4) |
| AUC blood glucose | 192.37±45.3* | 219.46±58.6 |
| AUC insulin† | 95.16 (119.9) | 136.85 (224.8) |
| HOMA† | 2.41 (2.02) | 2.82 (4.02) |
| QUICKI† | 0.334 (0.04) | 0.327 (0.05) |
| FGIR† | 6.9 (5.3) | 6.31 (6.09) |
| Total fat (g)† | 19227.7 (6391.2) | 20627.5 (8317.9) |
| Trunk fat (g) | 7494.1±2914.3** | 9850.1±2999.6 |
| CAP† | 208 (66.3) | 222 (85) |
| LSM† | 4.35 (1.5) | 4.59 (1.2) |
P*<0.05, **<0.01 compared to controls. †Median and IQR. WC, waist circumference; WHR, waist-hip ratio; GGT, gamma-glutamyl transferase; AUC, area under the curve
Table II compares the clinical, biochemical and hormonal parameters among PCOS women with or without NAFLD diagnosed on the basis of USG. Body weight, BMI, WC, truncal fat, ALT/AST ratio, AUC blood glucose were significantly abnormal among women with PCOS having NAFLD compared to those without NAFLD. Serum insulin levels on OGTT, HOMA-IR, QUICKI, FGIR and serum total testosterone were different between the groups but did not reach statistical significance. Similarly, CAP, LSM and total body fat showed a higher but non-significant trend in PCOS women having USG evidence of NAFLD. When lean (BMI <23 kg/m2) women with PCOS (n=22) were compared with lean controls (n=39), hepatic steatosis was significantly more among PCOS women (8.5 vs. 3.3%, P=0.02).
On multiple logistic regression analysis, only trunk fat [odds ratio (OR): 1.023; 95% CI: 1.008-1.039; P=0.01] and serum triglycerides (OR: 1.013; 95% CI: 1.001-1.027; P=0.04) were significantly related to presence of hepatic steatosis on ultrasound while parameters such as IR, serum total testosterone, plasma glucose failed to show any significance. Correlation of TE parameters with other markers of hyperandrogenism, IR, etc., is shown in Table III. CAP showed a positive correlation with trunk fat mass (r=0.349, P<0.001) but LSM showed only significant positive correlation to 1 h blood glucose in OGTT (r=0.329, P<0.01). When non-invasive markers were correlated with LSM and CAP, LAP showed a significant correlation with CAP in both cases and controls while APRI showed a significant negative correlation (r=−0.269, P=0.04) with LSM (Table III). Scatter plots showing the correlation of LFS and LAP with TE parameters is shown in the Figure.
| Parameter | Women with PCOS | Control women | ||
|---|---|---|---|---|
| CAP | LSM | CAP | LSM | |
| Blood glucose zero hour (mg/dl) | 0.012 | 0.163 | 0.091 | 0.192 |
| Blood glucose 1 h (mg/dl) | 0.123 | 0.329** | −0.074 | 0.004 |
| Blood glucose 2 h (mg/dl) | 0.082 | 0.215 | 0.002 | −0.068 |
| Insulin zero hour (µU/ml) | 0.250* | 0.125 | 0.283* | 0.317* |
| Insulin 1 h (µU/ml) | 0.246* | 0.262* | −0.132 | −0.065 |
| Insulin 2 h (µU/ml) | 0.16 | 0.06 | 0.015 | −0.055 |
| Serum HDL cholesterol (mg/dl) | −0.317* | −0.053 | −0.317* | −0.053 |
| AST (IU/l) | 0.189 | 0.515** | −0.063 | −0.159 |
| ALT (IU/l) | 0.134 | 0.21 | 0.084 | −0.118 |
| HOMA | −0.218 | −0.118 | 0.287* | 0.305* |
| QUICKI | −0.257* | −0.250* | −0.284* | −0.269* |
| FGIR | −0.310* | −0.13 | −0.288* | −0.293* |
| Serum total testosterone (ng/dl) | 0.036 | 0.018 | −0.021 | −0.067 |
| Serum DHEAS (µg/dl) | 0.109 | 0.109 | −0.004 | −0.102 |
| LAP | 0.443* | 0.113 | 0.379* | 0.220 |
| APRI | −0.064 | −0.269* | 0.017 | 0.163 |
| HIS | 0.214 | 0.035 | 0.150 | −0.143 |
| Fat mass trunk (g) | 0.349*** | 0.079 | 0.514* | 0.164 |
| Fat mass total (g) | 0.393** | −0.086 | 0.546** | −0.084 |
P*<0.05, **<0.01, ***<0.001
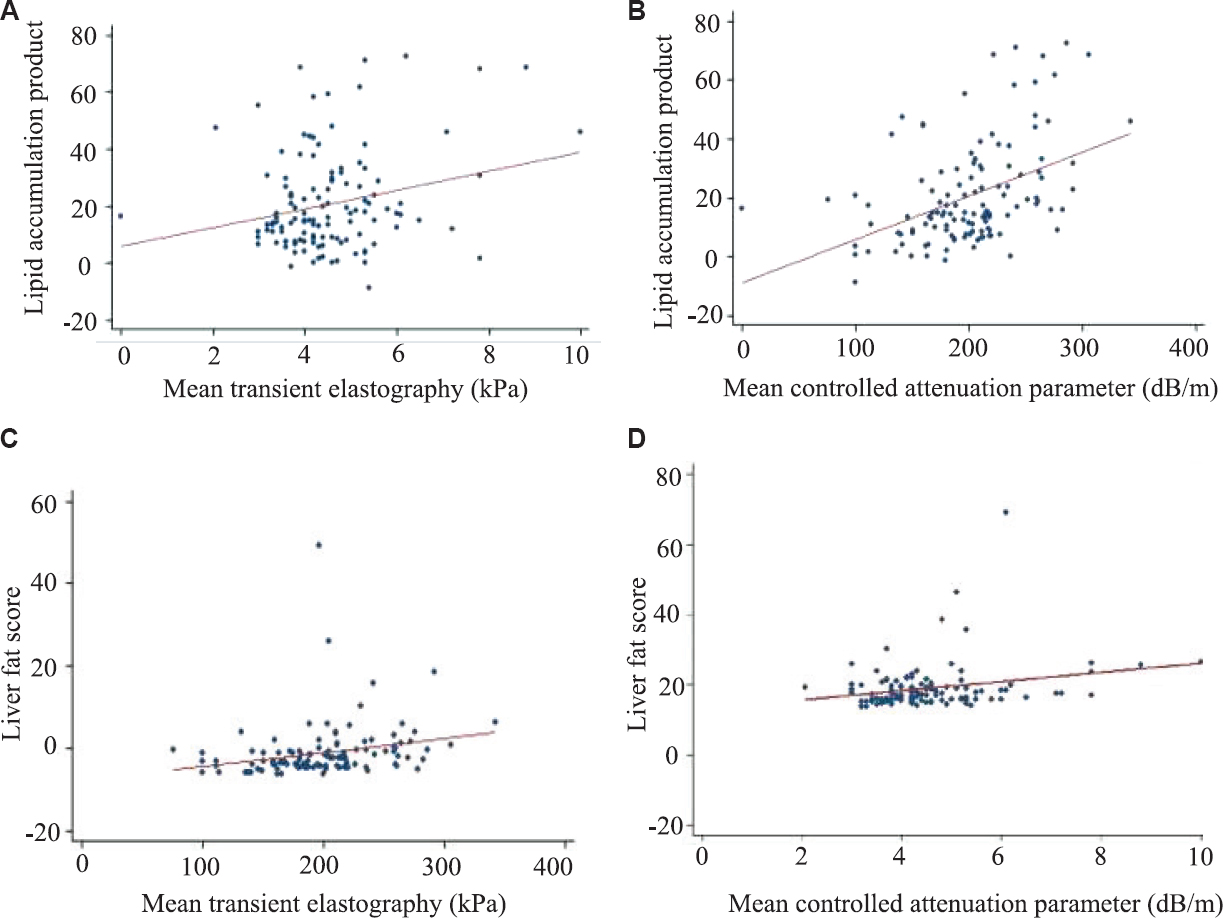
- Scatter plot showing correlation of elastography parameter with non-invasive index in women with polycystic ovary syndrome. (A) Scatter plot correlating LAP with TE, (B) Scatter plot correlating LAP with CAP, (C) Scatter plot correlating LFS with TE, (D) Scatter plot correlating LFS with CAP. LAP, lipid accumulation product; TE, transient elastography; CAP, controlled attenuation parameter; LFS, liver fat score.
Discussion
NAFLD is one of the most common causes of chronic liver disease worldwide reaching epidemic proportions with a prevalence of 25-30 per cent in general population17. Despite its high prevalence and potentially serious consequences, awareness about NAFLD is limited. Bertot et al18 reported the importance of non-invasive markers for earlier diagnosis.
A higher prevalence of NAFLD was observed in women with PCOS compared to controls in the present study. Many case-control studies from Brazil, China, Korea and also from India (in a small subset of patients) have demonstrated increased prevalence of NAFLD in young women with PCOS suggesting a link between PCOS and NAFLD812181920212223. Furthermore, NAFLD in these studies was independent of overweight/obesity and other coexisting MS features with more likelihood of having severe forms of NAFLD (non-alcoholic steatohepatitis, advanced fibrosis and cirrhosis). Accumulating evidence suggests that NAFLD, especially its necroinflammatory form, may exacerbate hepatic and systemic IR and releases multiple pro-inflammatory, pro-coagulant and pro-fibrogenic mediators that may play important roles in the pathophysiology of PCOS24.
The use of non-invasive indices of hepatic steatosis and fibrosis has gained significant attention recently since these have potential to obviate the need of liver biopsy. In our study, both significant fibrosis and steatosis were found only in two women with PCOS perhaps because these women were younger and lean. Women with PCOS were found to have higher CAP and LSM compared to controls, but the difference in LSM did not reach to significance. As LSM values are indicators of the extent of hepatic fibrosis, whereas CAP indicates the degree of hepatic steatosis in TE, these young women with PCOS may be at an early stage in the spectrum of NAFLD. This may provide a window of opportunity to institute preventive measures to protect these women from future consequences.
The results of this study were in accordance with the earlier reports indicating that women with PCOS have high prevalence of IR and obesity, which in turn are closely linked to abnormal glucose tolerance1225. Most studies have found PCOS women with NAFLD having higher IR compared to those without it2627. Qu et al28 also reported that women with PCOS having NAFLD had higher IR than their counterparts without NAFLD, but androgens levels were similar. Our study also did not show any significant difference in serum total testosterone and DHEAS levels between PCOS women with and without NAFLD. These results were similar to those of Cussons et al20 demonstrating no significant differences in circulating levels of total testosterone, sex hormone-binding globulin (SHBG) or free androgen index (FAI) between PCOS women with and without NAFLD. Jones et al29 found that hyperandrogenic PCOS women (FAI >7%) had markedly higher intrahepatic fat content on magnetic resonance spectroscopy compared to both normo-androgenic PCOS women and controls which remained significant even after adjusting for BMI and IR. Vassilatou et al21 also reported higher FAI and lower SHBG levels in PCOS women with NAFLD compared to women without NAFLD. The lipid abnormalities (low serum HDL, high TG) associated with IR, the common aetiology of both PCOS and NAFLD21, were also observed in our study PCOS women also had higher LFS and APRI. LAP showed a significant correlation with CAP in both PCOS and control women while APRI was significantly higher in PCOS women compared to controls. Higher LAP score was observed in PCOS women compared to controls similar to the observations of Macut et al30 where women with PCOS had higher prevalence of NAFLD and significantly higher concentration of triglycerides.
In this study, women with NAFLD had significantly higher trunk fat than those without NAFLD, and this correlated well with CAP shown by TE. The results were in coherence with earlier observations showing that android fat distribution among women with PCOS was a risk factor for metabolic abnormalities31. In a study, data on 113 patients with biopsy-proven NAFLD showed that LSM by fibroscan could predict liver-related complications, similar to the paired liver biopsy and might be thus useful in identifying patients at increased risk of cardiovascular events32.
The major limitations of this study were small sample size, inability to do liver biopsy and non-measurement of SHBG and FAI. Since controls were not BMI-matched, the differences identified could have partly resulted from comparing obese with non-obese women rather than owing to the hepatic effects of PCOS per se.
In conclusion, our findings indicated that women with PCOS were at a higher risk of NAFLD earlier in the natural course of the disease. The preliminary findings from this study may suggest that CAP and LSM on fibroscan can be investigated to be a potential predictor of NAFLD in these women. An extensive well-designed study with long-term follow up of PCOS women using liver biopsy, liver function tests, ultrasound and TE may unravel the correct associations.
Financial support & sponsorship: None
Conflicts of Interest: None.
References
- Insulin resistance and the polycystic ovary syndrome revisited: An update on mechanisms and implications. Endocr Rev. 2012;33:981-1030.
- [Google Scholar]
- Non-alcoholic fatty liver disease in women with polycystic ovary syndrome: Systematic review and meta-analysis. J Endocrinol Invest. 2017;40:1279-88.
- [Google Scholar]
- Clinical relevance of liver histopathology and different histological classifications of NASH in adults. Expert Rev Gastroenterol Hepatol. 2018;12:351-67.
- [Google Scholar]
- Nonalcoholic fatty liver disease and polycystic ovary syndrome. World J Gastroenterol. 2014;20:8351-63.
- [Google Scholar]
- Diagnosis and treatment of polycystic ovary syndrome: An Endocrine Society clinical practice guideline. J Clin Endocrinol Metab. 2013;98:4565-92.
- [Google Scholar]
- Transient elastography: A new non-invasive method for assessment of hepatic fibrosis. Ultrasound Med Biol. 2003;29:1705-13.
- [Google Scholar]
- Predictive factors of significant liver fibrosis in patients with PCOS evaluated by transient elastography (FibroScan®) Boston hyperandrongenic disorders and female tract. Endocrine Society's 98th Annual Meeting and Expo 2016
- [Google Scholar]
- Prevalence of hepatic steatosis in women with polycystic ovary syndrome. J Hum Reprod Sci. 2013;6:9-14.
- [Google Scholar]
- Incidence of nonalcoholic haepatic fatty infiltration in women with polycystic ovary syndrome. J Evid Based Med Healthc. 2014;1:867-75.
- [Google Scholar]
- Revised 2003 consensus on diagnostic criteria and long-term health risks related to polycystic ovary syndrome (PCOS) Hum Reprod. 2004;19:41-7.
- [Google Scholar]
- AISF position paper on nonalcoholic fatty liver disease (NAFLD): Updates and future directions. NAFLD Dig Liver Dis. 2017;49:471-83.
- [Google Scholar]
- Oral glucose tolerance test significantly impacts the prevalence of abnormal glucose tolerance among Indian women with polycystic ovary syndrome: Lessons from a large database of two tertiary care centers on the Indian subcontinent. Fertil Steril. 2016;105:194-201e1-3.
- [Google Scholar]
- Methods for estimation of blood glucose: a comparative evaluation. Med J Armed Forces India. 1998;54:131-3.
- [Google Scholar]
- Imaging of non-alcoholic fatty liver disease: A road less travelled. Indian J Endocr Metab. 2013;17:990-5.
- [Google Scholar]
- Quantitative insulin sensitivity check index: A simple, accurate method for assessing insulin sensitivity in humans. J Clin Endocrinol Metab. 2000;85:2402-10.
- [Google Scholar]
- Validation of the Friedewald formula in patients with metabolic syndrome. Cholesterol 2014:261878.
- [Google Scholar]
- Epidemiology of nonalcoholic fatty liver disease and nonalcoholic steatohepatitis in the United States and the rest of the world. Clin Liver Dis. 2016;20:205-14.
- [Google Scholar]
- Nonalcoholic fatty liver disease-related cirrhosis is commonly unrecognized and associated with hepatocellular carcinoma. Hepatol Commun. 2017;1:53-60.
- [Google Scholar]
- Prevalence of nonalcoholic fatty liver disease in women with polycystic ovary syndrome. Clin Gastroenterol Hepatol. 2007;5:496-501.
- [Google Scholar]
- Omega-3 fatty acid supplementation decreases liver fat content in polycystic ovary syndrome: A randomized controlled trial employing proton magnetic resonance spectroscopy. J Clin Endocrinol Metab. 2009;94:3842-8.
- [Google Scholar]
- Increased androgen bioavailability is associated with non-alcoholic fatty liver disease in women with polycystic ovary syndrome. Hum Reprod. 2010;25:212-20.
- [Google Scholar]
- Triglycerides to high-density lipoprotein cholesterol ratio can predict impaired glucose tolerance in young women with polycystic ovary syndrome. Yonsei Med J. 2016;57:1404-11.
- [Google Scholar]
- Evidence that non-alcoholic fatty liver disease and polycystic ovary syndrome are associated by necessity rather than chance: A novel hepato-ovarian axis? Endocrine. 2016;51:211-21.
- [Google Scholar]
- Insulin response to oral glucose in healthy, lean young women and patients with polycystic ovary syndrome. Gynecol Endocrinol. 2008;24:637-43.
- [Google Scholar]
- Long-term metformin treatment is able to reduce the prevalence of metabolic syndrome and its hepatic involvement in young hyperinsulinaemic overweight patients with polycystic ovarian syndrome. Clin Endocrinol (Oxf). 2011;75:520-7.
- [Google Scholar]
- A comparison of cardiovascular risk indices in patients with polycystic ovary syndrome with and without coexisting nonalcoholic fatty liver disease. Clin Endocrinol (Oxf). 2014;80:843-9.
- [Google Scholar]
- The clinical characteristics and etiological study of nonalcoholic fatty liver disease in Chinese women with PCOS. Iran J Reprod Med. 2013;11:725-32.
- [Google Scholar]
- Polycystic ovary syndrome with hyperandrogenism is characterized by an increased risk of hepatic steatosis compared to nonhyperandrogenic PCOS phenotypes and healthy controls, independent of obesity and insulin resistance. J Clin Endocrinol Metab. 2012;97:3709-16.
- [Google Scholar]
- Management of endocrine disease: Polycystic ovary syndrome and nonalcoholic fatty liver disease. Eur J Endocrinol. 2017;177:R145-58.
- [Google Scholar]
- Non-alcoholic fatty liver disease in women with polycystic ovary syndrome: Assessment of non-invasive indices predicting hepatic steatosis and fibrosis. Hormones (Athens). 2014;13:519-31.
- [Google Scholar]
- Repeated liver stiffness measurement compared with paired liver biopsy in patients with non-alcoholic fatty liver disease. Hepatol Int. 2018;12:44-55.
- [Google Scholar]


