
Translate this page into:
Effect of socio-economic status & proximity of patient residence to hospital on survival in childhood acute lymphoblastic leukaemia
For correspondence: Dr Amita Trehan, Department of Pediatrics, Advanced Pediatrics Center, Pediatric Hematology-Oncology Unit, Postgraduate Institute of Medical Education & Research, Chandigarh 160 012, India e-mail: trehanamita@hotmail.com
-
Received: ,
This is an open access journal, and articles are distributed under the terms of the Creative Commons Attribution-NonCommercial-ShareAlike 4.0 License, which allows others to remix, tweak, and build upon the work non-commercially, as long as appropriate credit is given and the new creations are licensed under the identical terms.
This article was originally published by Medknow Publications & Media Pvt Ltd and was migrated to Scientific Scholar after the change of Publisher.
Abstract
Background & objectives:
Survival in paediatric acute lymphoblastic leukaemia (ALL) in lower/middle income countries continues to lag behind outcomes seen in high-income countries. Socio-economic factors and distance of their residence from the hospital may contribute to this disparity. This study was aimed at identifying the impact of these factors on outcome in childhood ALL.
Methods:
In this retrospective study, file review of children with ALL was performed. Patients were treated with the modified United Kingdom (UK) ALL-2003 protocol. Details of socio-economic/demographic factors were noted from a web-based patients’ database. Modified Kuppuswamy scale was used to classify socio-economic status.
Results:
A total of 308 patients with a median age of five years (range: 1-13 yr) were studied. Patients belonging to upper, middle and lower SE strata numbered 85 (28%), 68 (22%) and 155 (50%). Nearly one-third of the patients were underweight. There was no treatment abandonment among children whose mothers were graduates. Neutropenic deaths during maintenance therapy were lower in mothers who had passed high school. In patients who survived induction therapy, the five year event-free survival (EFS) of upper SE stratum was significantly better 78.7±4.9 vs. 59±7.2 and 58.1±4.6 per cent in middle and lower strata (P=0.026). Five year overall survival was higher in the higher SE group; being 91.2±3.5, 78.3±5.6 and 78.8±3.9 per cent (P=0.055) in the three strata. Survival was unaffected by a distance of residence from treating centre or rural/urban residence. High-risk and undernourished children had a greater hazard of mortality [1.80 (P=0.015); 1.98 (P=0.027)].
Interpretation & conclusions:
Our findings showed that higher socio-economic status contributed to superior EFS in children with ALL who achieved remission. Undernutrition increased the risk of mortality.
Keywords
Area remoteness
childhood leukaemia
demographic factors
illiteracy
treatment adherence
treatment default
treatment-related mortality

With advances in risk stratification and management, survival of patients with childhood acute lymphoblastic leukaemia (ALL) has improved. However, low- and middle-income countries (LMIC) are unable to replicate the impressive survival observed in high-income countries (HIC)12. Social, cultural and economic factors, as well as the remoteness of residence, may significantly contribute to this disparity. Poor socio-economic status, illiteracy and residence in areas with poor accessibility potentially contribute to advanced disease at presentation, co-morbidities such as malnutrition, quality of medical expertise availed, as well as compliance to therapy3. Remarkably, socio-economic variables have been observed to influence outcomes in ALL in high-income countries as well45. It is imperative to recognize the influence of these elements, as these are remediable, as opposed to biological aspects of the disease. This study was undertaken to assess whether there was a significant contribution of socio-economic status, parental educational status and distance of residence from treating centre, to survival in ALL.
Material & Methods
This retrospective study was conducted in the Paediatric Haematology Oncology unit of the department of Paediatrics at the Postgraduate Institute of Medical Research, Chandigarh, India. Children with ALL, age 1-13 yr, diagnosed and treated at the centre from January 2010 to December 2012 were included. Patients who received less than one week of treatment were excluded from the analysis and patients presenting as relapsed disease were not included. Therapy was administered as per the modified United Kingdom (UK) ALL-2003 protocol67. Patients were stratified as per the National Cancer Institute (NCI) criteria8 into standard risk (SR) and high-risk (HR) patients based on the age and counts at admission [SR: age 1-10 yr and total leucocyte count (TLC) at presentation ≤ 50,000/μl, HR: age >10 yr and/or TLC >50,000/μl]. T-cell disease and Philadelphia (Ph) chromosome positivity were treated as HR. Patients received the standard and intermediate arm of the protocol for the NCI standard and HR disease67. This comprised three-drug induction for SR and four-drug induction for HR. Induction was followed by consolidation, interim maintenance, delayed intensification and maintenance phase. As per the protocol, total duration of therapy was 166 wk in boys and 114 wk in girls.
Data capture: The ’Jiv Daya Foundation’ (a non-governmental organization) has initiated a web-based database for online entry of data about children with cancer receiving treatment at referral institutes in India9. This database, namely the ’Indian Paediatric Oncology Initiative Patient Database (IndiaPOD)’ was utilized for obtaining information on the socio-economic demographic details of the family of the patient, monthly income of the family in Indian rupees, educational status of both parents and residential address9. Data regarding patients’ demographics (which include socio-economic variables) and their clinical details are entered daily into the IndiaPOD on a computerized case record form, by a trained person.
Socio-economic classification: The modified Kuppuswamy scale (KS) was employed to categorize socio-economic status in the patients10. This scale classifies families into upper, upper middle, upper lower, lower middle- and low-socio-economic groups by the use of a scoring system given to education, income and occupation. Maximal points are given to a university degree, professionals and high income10. This scoring is widely used for community- and hospital-based research in India. For the purpose of analysis, upper and upper middle classes were combined as ’upper’; the lower middle was considered ’middle’ and upper lower and lower were combined as ’lower’ classes. Parents were classified according to their educational status as graduates (having a college degree), the high school passed/diploma holders (passed class 12/possessing diploma) and not completed high school. Data were entered into an online calculator for calculating the score and KS classes11. The residential address was classified as rural (village) or urban (city/town). The distance between the district of residence and Chandigarh (city in which the hospital is located) was calculated using an online calculator12. Patients were classified based on the distance of residential district to Chandigarh in kilometres; as group 1: >200 km, group 2: 50-200 km and group 3: <50 km. The time taken to reach the hospital by public transport (bus/train) was approximately 5-6 h for patients residing between 200 and 250 km from the hospital (group 1); 3-4 h in group 2 and 1-2 h in group 3. Patients from distant states (distance from Chandigarh of 300-2000 km) travel for almost 12-36 h by train.
Nutritional status: Weight and height at the time of diagnosis were noted from the files. The World Health Organization growth charts for weight for age and body mass index13 were utilized to calculate z scores13. A weight for age z score <−2, defined “underweight” status in children <10 yr of age. In older children, a body mass index z score <−2 was considered underweight. The study protocol was approved by the Institutional Ethics Committee.
Definitions
Events: Induction failure, death and relapse were taken as events for survival analysis. Induction failure: presence of >25 per cent blasts in the bone marrow after completion of induction therapy. Treatment abandonment: cessation of therapy after completion of at least one week of induction chemotherapy. Refusal of therapy was confirmed telephonically with the family. Abandonment was not included as an event for survival analysis. Five-year survival: event-free survival (EFS) was calculated from diagnosis to event and overall survival (OS) was calculated from diagnosis to the time of the last contact.
Statistical analysis: The data were entered into IBM-SPSS software (version 20.0, 2011, IBM-SPSS, Inc., Chicago, IL, USA). Baseline variables were analyzed by descriptive statistics. Normally distributed variables were represented as mean with standard deviation. Variables with skewed distribution were represented as median with inter-quartile range. Comparison of proportions was performed using Chi-squared test. Univariate analysis was performed to evaluate the impact of various factors on the occurrence of events. Survival analysis was performed using the Kaplan-Meier method. The log-rank test was used to compare survival among different patient categories. A Cox proportional-hazard analysis was performed to evaluate the effect of different factors on mortality.
Results
A total of 308 children diagnosed with ALL were included in the study. Median age was five years (range: 1-13 yr). The male-to-female ratio was 2.5:1. Half of the study population belonged to the lower socio-economic class. Three patients had lost their fathers and two had lost their mothers. Thirty seven per cent fathers and forty three per cent mothers had not passed high school. The proportion of fathers who had passed high school was greater among the male patients as compared to female patients (72 vs. 59%, P<0.05). Proportions of mothers who had passed high school did not differ between boys and girls (56 vs. 60%). Two-third patients belonged to urban areas. Nearly two-third (64%) patients lived >50 km from the hospital. Eight per cent of the patients hailed from distant States, residing 300-2000 km from Chandigarh. Table I illustrates the baseline variables. Parents belonging to the upper socio-economic class were more likely to be of a higher educational status (P<0.001) than middle and lower classes. In addition, patients’ parents were likely to be belonging to a similar educational category (P<0.001).
| Parameter | n (%) (n=308) | Proportion of patients with events, n (%) |
|---|---|---|
| Sex | ||
| Male | 221 (72) | 83 (38) |
| Female | 87 (28) | 35 (40) |
| Weight | ||
| Underweight | 95 (31) | 81 (38) |
| Normal | 213 (69) | 37 (39) |
| Regimen | ||
| Standard risk | 189 (34) | 64 (34) |
| High-risk | 119 | 54 (45) |
| Socio-economic class | ||
| Upper | 85 (28) | 25 (29) |
| Middle | 68 (22) | 29 (43) |
| Lower | 155 (50) | 64 (41) |
| Educational statusa | ||
| Graduate (paternal) | 75 (25) | 23 (31) |
| High school passed | 118 (39) | 49 (41) |
| Not passed high school | 112 (37) | 45 (40) |
| Educational statusb | ||
| Graduate (maternal) | 62 (20) | 19 (31) |
| High school passed | 113 (37) | 50 (44) |
| Not passed high school | 131 (43) | 48 (37) |
| Residence | ||
| Urban | 198 (64) | 82 (41) |
| Rural | 110 (36) | 36 (33) |
| Distance between residence and hospital (km) | ||
| <50 | 65 (21) | 21 (32) |
| 50-200 | 133 (43) | 53 (40) |
| >200 | 110 (36) | 44 (40) |
a3 patients had lost their fathers, b2 patients had lost their mothers
Treatment intensity: There were 189 patients who were at standard risk and 119 who were at HR as per the NCI criteria. The proportions of patients in each risk group did not differ with socio-economic class, paternal educational status, maternal educational status and distance from the treating centre. A greater proportion of patients who were at standard risk hailed from urban areas, as compared to rural areas [76/110 (69%) vs. 113/198 (57%), P<0.05].
Treatment abandonment: Sixteen (5.2%) patients abandoned therapy before completion of therapy. The median duration of therapy before abandonment was 5.5 months (range: 2 wk to 33 months). Reasons for abandonment included (i) depletion of finances (n=2); (ii) inability to stay near treatment centre (n=5), (iii) early default within two weeks (n=2), and (iv) default in maintenance therapy for reasons not clear (n=7). Upper, middle and lower classes did not differ with respect to abandonment [2 (2.4%), 5 (7.4%), 9 (5.8%), P=0.34]. However, none of the 62 patients whose mothers had college education (graduate) abandoned therapy (P<0.05). Treatment abandonment did not differ between patients with fathers who were graduates compared to those who were not. It did not differ with urban/rural residence or the three distance based groups.
Treatment related mortality: A total of 58 (19%) patients, succumbed during chemotherapy. Among these patients, 27 (8.8%) died during induction therapy, 31 after achievement of remission. Among the induction deaths, three were due to intracranial haemorrhage occurring within 15 days of initiating therapy, with 24 deaths being secondary to bacterial/fungal infections. Twelve patients had treatment-related mortality after consolidation/intensification therapy. Nineteen (6.2%) died during maintenance therapy. Induction mortality did not differ with socio-economic status. However, mortality during maintenance was slightly higher in the middle and lower classes: one (1.2%) child in the upper class, six (8.8%) in the middle class and 12 (7.7%) in the lower class. Deaths during maintenance therapy were lesser among children of mothers who had passed high school as compared to mothers who had not studied up to high school, as compared to mortality during induction therapy (3.4 vs. 9.8%, P<0.05). There was no difference in mortality among patients with fathers who had passed/not passed high school. Maintenance deaths did not differ with rural/urban residence and distance based groups.
Nutritional status: Nearly one-third of the patients were underweight at the time of diagnosis (Table I). The proportions of underweight patients in the upper, middle and lower socio-economic groups were 12.9, 22.1 and 44.5 per cent (P<0.001). Proportions of underweight patients differed significantly with paternal education, graduates: 2.7 per cent, high school passed: 34.7 per cent, not high school passed: 46.4 per cent (P<0.001). Similarly, 3.2, 24.8 and 49.6 per cent of children whose mothers belonged to similar educational strata were underweight (P<0.001). Children hailing from rural areas were more likely to be underweight than their urban counterparts (37.9 vs. 18.2%, P<0.001). Treatment abandonment and induction mortality did not differ among patients who were underweight when compared to those who were not underweight.
Survival outcome: Proportions of events in the various categories are described in Table I. On univariate analysis, patients who were HR had a greater proportion of events when compared to those who were at standard risk (P=0.043). The median follow up duration in the study was 45 months (interquartile range: 16-58). The five-year EFS and OS for the entire group (n=308) was 58.1±3.1 and 74.8±2.7 per cent. Twenty three of the 308 (7.5%) patients had relapsed at the time of analysis. Five-year EFS was 69.5±5.1, 52.8±6.8 and 54.3±4.5 per cent in the higher, middle and lower SE classes, (P=0.171, Fig. 1A). Similarly, five-year OS was 80.4±4.4, 70±5.8 and 73.7±4 per cent in the higher, middle and lower socio-economic strata (P=0.428, Fig. 1B). EFS and OS did not differ between the distance based groups 1, 2 and 3 [EFS: 63.7±6.6%, 57.8±4.6% and 55.1±5.4% (P=0.557); OS: 76.4±6.2%, 75.3±3.8% and 73.4±4.6% (P=0.810)]. EFS and OS did not differ with rural or urban residence [EFS: 54.5±3.9% and 64.6±5% (P=0.166); OS: 73.6±3.3% and 76.6±4.7% (P=0.524)]. On the Cox's regression analysis (Table II), patients who were HR and undernourished had a greater hazard of mortality [1.80 (P=0.015); 1.98 (P=0.027)]. On comparing survival in the subset of patients who completed induction therapy successfully (n=281), EFS and OS were higher in patients belonging to the upper socio-economic class as compared to middle and lower classes [EFS: 78.7±4.9%, 59±7.2% and 58.1±4.6% (P=0.026); OS: 91.2±3.5%, 78.3±5.6% and 78.8±3.9% (P=0.055), Fig. 2A and B].

- Black line: Upper socio-economic status, dotted line: Middle socio-economic status, dashed line: Lower socio-economic status. (A and B) Illustrate the event-free survival and overall survival for the entire group of patients. The Tables below the figures illustrate the number of patients at the end of each year who are at risk for events.
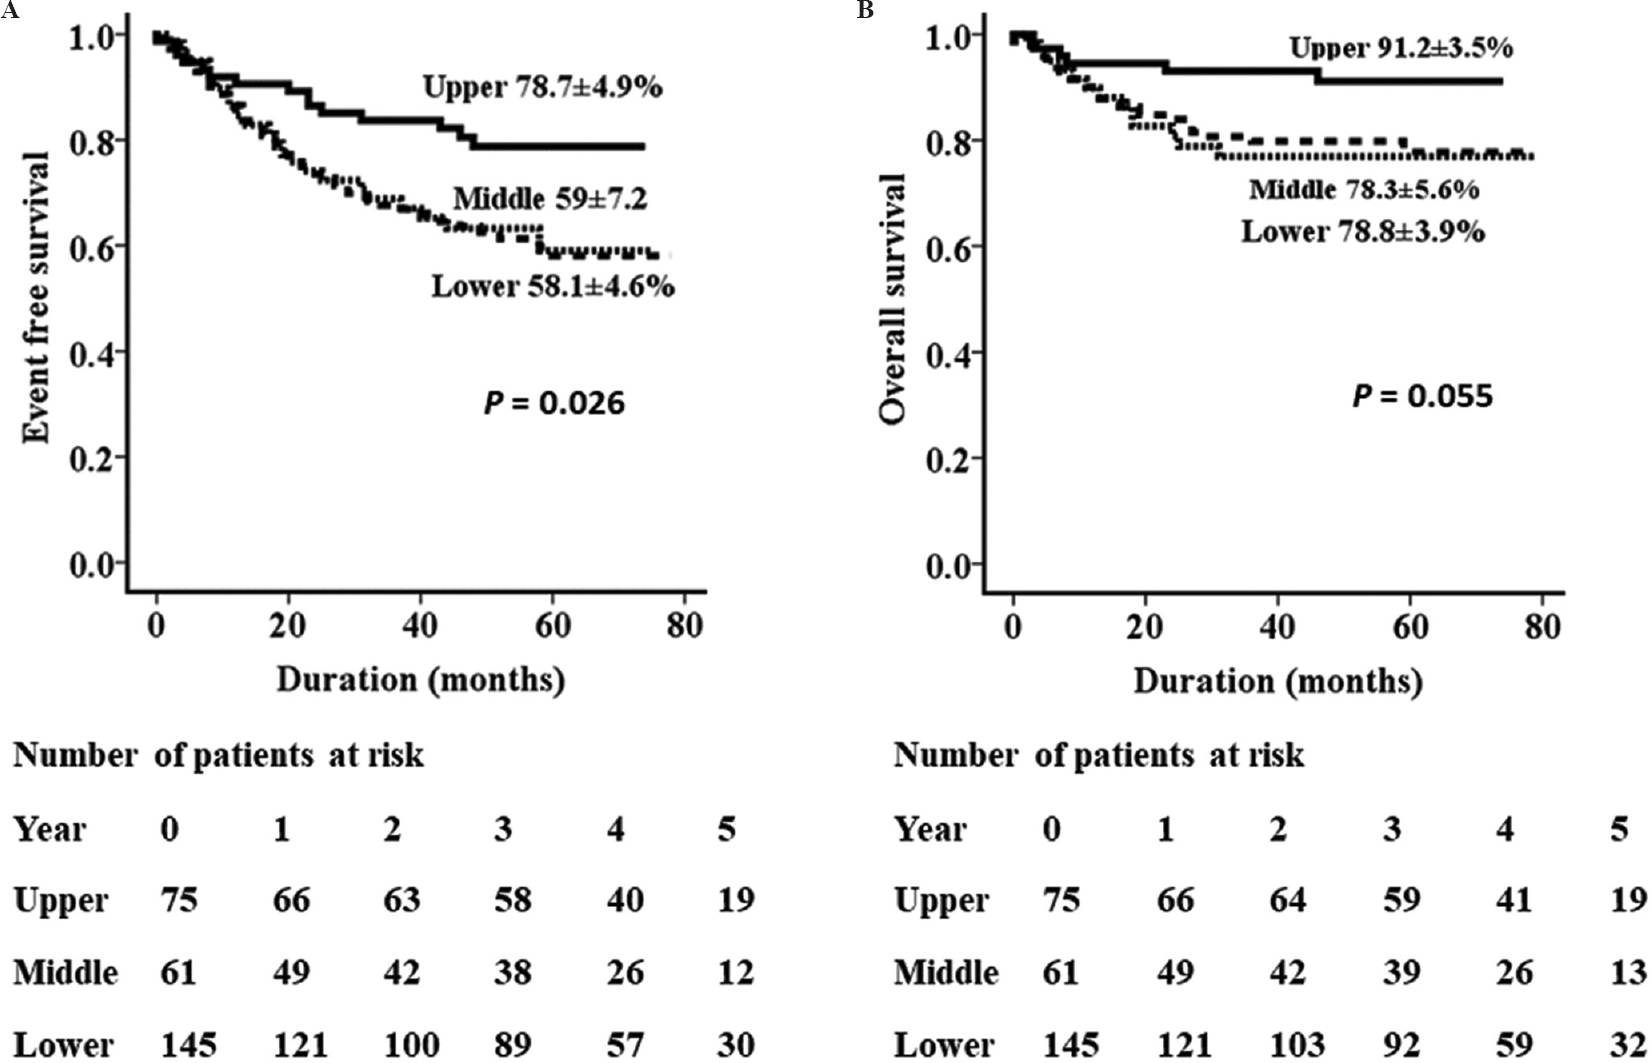
- Black line: Upper socio-economic status, dotted line: Middle socio-economic status, dashed line: Lower socio-economic status. (A and B) Illustrate the event-free survival and overall survival for the patients who achieved remission after completing induction therapy. Tables below the figures illustrate the number of patients at the end of each year who are at risk for events.
| Predictor | Reference group | Hazard ratio | 95 per cent CI | P |
|---|---|---|---|---|
| Underweight | Normal weight | 1.98 | 1.08-3.63 | 0.027 |
| High-risk regimen | Standard risk regimen | 1.80 | 1.12-2.89 | 0.015 |
| Low socio-economic status | Middle/upper socio-economic status | 0.86 | 0.51-1.44 | 0.562 |
| Residence >200 km from treating centre | Residence within 200 km of treating centre | 0.96 | 0.59-1.56 | 0.857 |
| Rural residence | Urban residence | 0.90 | 0.52-1.57 | 0.711 |
CI, confidence interval
Discussion
The Surveillance, Epidemiology and End Results (SEER) Programme of the NCI reports five-year-survival of 90 per cent in children receiving therapy for ALL14. In contrast, the EFS in most Indian studies ranges between 40 and 70 per cent2. Asian ethnicity does not appear to have a role in the outcome of studies performed in centres catering to multiracial populations1516. Most children receive therapy based on uniform, contemporary protocols, where socio-economic variables may play a critical role in influencing the outcome. Socio-economic status has been shown to have deleterious effects on outcomes in children with acute leukaemia even in HICs4516171819202122. In LMICs, socio-economic status involves a complex interplay of factors such as family income, the occupation of the breadwinner/s, socio-cultural background and educational status. The modified KS scale used in the study is an indigenous scoring system that encompasses education, occupation as well as family income used extensively in India1023.
Half of the patients in our study belonged to the low socio-economic class whereas less than a third were from the upper class. In HICs patients from lower classes/ low socio-economic status neighbourhoods constitute less than a third of the study population1721. In addition, the study populations in LMICs only constitute patients who have reached the hospital for treatment and complete therapy as per protocol. It is estimated that the number of patients who abandon treatment for childhood cancer in LMIC approximates the number of newly diagnosed cases in HIC1. An international survey has identified the following factors as potential determinants of treatment abandonment: lower socio-economic status, poor educational status, long travel time to treating centre, preference for complementary/alternative medicine, concerns regarding treatment-related toxicity, perceived poor prognosis of disease, religious beliefs and adolescent patients24.
Our study showed that fathers of girls who were treated for ALL were more likely to have passed high school as compared to fathers of boys. This discrepancy makes one ponder that lack of education may be a contributing factor in families denying standard therapy for girls with ALL. The importance of parental education is also emphasized by the observation that none of the patients with mothers who had completed their graduation had abandoned therapy. Parental education impacts the outcome of ALL significantly in LMICs7. Education deeply impacts the personal perception of cancer as a disease with a possible cure, social stigmas attached with a diagnosis of cancer in a child and appropriate interaction with health-care professionals3. Neutropenic deaths during maintenance therapy were significantly lesser in children whose mother had completed high school. Patients are under the regular scrutiny of doctors during the intensive phases of therapy when they stay close to the hospital. However, they are predominantly under parental supervision during maintenance therapy. The observation of lesser neutropenic deaths during maintenance in children whose mothers had passed high school reiterates that educated mothers are possibly more meticulous in maintaining hygiene and ensuring timely medical intervention in the event of febrile neutropenia. It is noteworthy that treatment-related mortality in maintenance was not affected by the distance of residence from the treating centre.
Lower socio-economic status has been associated with inferior outcome in children with cancer, consistently in LMIC and frequently in HIC according to a systematic review4. In our study, the upper class had a 10-15 per cent higher EFS and OS as compared to the middle and lower classes. Survival disparity between upper and lower socio-economic classes with time has been reported by a study from Northern England21. The authors hypothesized that this could be related to better treatment adherence in the upper class21. Chemotherapy in childhood ALL is peculiar with respect to its prolonged orally administered maintenance phase, supervised largely by caregivers at home. Poor compliance to oral 6-mercatopurine has been shown to be associated with inferior EFS in a large prospective study by Children's Oncology Group (COG)25. In a study from our centre, a significant association of medication errors was observed with lower socio-economic status and educational status of caregiver26. The other possible mechanism for post-induction impact of socio-economic status on mortality is delayed presentation in febrile neutropenia, especially during maintenance therapy. A significantly greater symptom to door (hospital) time interval during episodes of febrile neutropenia which occurred in non-intensive phases of therapy has been reported from India27. Furthermore, ’resource burn out’ may occur with progress of therapy which interferes with adherence and increases treatment abandonment. This has been reported in a study from Boston, which reported an incidence of increase in household material insecurity from 20 to 29 per cent after 6 months of therapy in families of children diagnosed with cancer28. Remoteness of residence from the treating centre and rural residence have been shown to adversely affect the outcome in studies from Australia and Brazil2930. Two-thirds of our patients had to travel a distance of >50 km and one-fifth >200 km to access health care. Since presenting TLC is a factor in risk allocation, one may postulate that patients from rural areas had a greater symptom diagnosis interval. However, distance from the treating centre had no bearing on treatment abandonment or treatment-related mortality.
A significant proportion of our patients (nearly one-third) were underweight at diagnosis. Undernutrition at diagnosis has been shown to affect survival outcome in childhood cancer3132. It contributes to poor tolerance to therapy, increased frequency of infections and alteration in drug pharmacokinetics33. Undernourished status emerged as a significant factor contributing to mortality, in addition to the intensity of the regimen administered in our study. Nearly half (44.5%) the children with poor nutritional status belonged to the lower socio-economic stratum and would have contributed to the adverse effect on survival outcomes.
In conclusion, this study emphasizes the need to support families who are socioeconomically less privileged. Socio-economic determinants exert their influence on aspects related to patient profile, health care received and presenting disease burden3. Patients from lower socio-economic classes are likely to have co-morbidities such as malnutrition and infections, and further lack psychosocial support and resources to enable treatment completion34. In addition, uneducated parents rely entirely on what is understood when counselled as compared to an educated family who would be able to read the prescription and details regarding disease and treatment. Intervention needs to be in the form of ensuring repeated counselling, especially in maintenance therapy with stress on the importance of safe food practices, hygiene, compliance to medications and timely presentation during complications.
Acknowledgment
Support for computerized data entry and retrieval of data with the help of the IndiaPOD from the Jiv Daya Foundation, Dallas, Texas, USA is acknowledged.
Financial support & sponsorship: None.
Conflicts of Interest: None.
References
- Magnitude of treatment abandonment in childhood cancer. PLoS One. 2015;10:e0135230.
- [Google Scholar]
- Acute leukemia in children: A review of the current Indian data. South Asian J Cancer. 2016;5:155-60.
- [Google Scholar]
- Origins of socio-economic inequalities in cancer survival: A review. Ann Oncol. 2006;17:5-19.
- [Google Scholar]
- Low socioeconomic status is associated with worse survival in children with cancer: A systematic review. PLoS One. 2014;9:e89482.
- [Google Scholar]
- Socioeconomic disparities in survival from childhood leukemia in the United States and globally: A meta-analysis. Ann Oncol. 2015;26:589-97.
- [Google Scholar]
- Treatment reduction for children and young adults with low-risk acute lymphoblastic leukaemia defined by minimal residual disease (UKALL 2003): A randomised controlled trial. Lancet Oncol. 2013;14:199-209.
- [Google Scholar]
- Improving outcome of acute lymphoblastic leukemia with a simplified protocol: Report from a tertiary care center in North India. Pediatr Blood Cancer. 2017;64 doi: 10.1002/pbc.26281
- [Google Scholar]
- Uniform approach to risk classification and treatment assignment for children with acute lymphoblastic leukemia. J Clin Oncol. 1996;14:18-24.
- [Google Scholar]
- Indian Pediatric Oncology Initiative Patient Database (India POD). Available from: http://www.indiapod.org
- Manual of socioeconomic status (urban) (1st ed). Delhi: Manasayan; 1981. p. :66-72.
- [Google Scholar]
- Online interactive calculator for real-time update of the Kuppuswamy's socioeconomic status scale. Available from: http://www.scaleupdate.weebly.com
- Distance between Cities. Available from: http://www.mapsofindia.com/distance/
- The WHO Child Growth Standards. Available from: https://www.who.int/childgrowth/standards/en/ accessed on February 25, 2017
- 2016. SEER Cancer Statistics Review, 1975-2013. Bethesda, MD: National Cancer Institute; Available from: http://www.seer.cancer.gov/csr/1975_2013/
- Genomics of racial and ethnic disparities in childhood acute lymphoblastic leukemia. Cancer. 2014;120:955-62.
- [Google Scholar]
- Influence of race and socioeconomic status on outcome of children treated for childhood acute lymphoblastic leukemia. Curr Opin Pediatr. 2004;16:9-14.
- [Google Scholar]
- Effects of race/ethnicity and socioeconomic status on outcome in childhood acute lymphoblastic leukemia. J Pediatr Hematol Oncol. 2016;38:350-4.
- [Google Scholar]
- Impact of socioeconomic status on timing of relapse and overall survival for children treated on Dana-Farber cancer institute ALL consortium protocols (2000-2010) Pediatr Blood Cancer. 2016;63:1012-8.
- [Google Scholar]
- Leukemia survival in children, adolescents, and young adults: Influence of socioeconomic status and other demographic factors. Cancer Causes Control. 2009;20:1409-20.
- [Google Scholar]
- Racial/ethnic and socioeconomic disparities in survival among children with acute lymphoblastic leukemia in California, 1988-2011: A population-based observational study. Pediatr Blood Cancer. 2015;62:1819-25.
- [Google Scholar]
- Inferior outcomes for black children with high risk acute lymphoblastic leukemia and the impact of socioeconomic variables. Pediatr Blood Cancer. 2017;64:267-74.
- [Google Scholar]
- Socioeconomic variation in survival from childhood leukaemia in Northern England, 1968-2010. Br J Cancer. 2013;108:2339-45.
- [Google Scholar]
- Kuppuswamy's socio-economic status scale: A revision of occupation and income criteria for 2016. Indian J Pediatr. 2017;84:3-6.
- [Google Scholar]
- Determinants of treatment abandonment in childhood cancer: Results from a global survey. PLoS One. 2016;11:e0163090.
- [Google Scholar]
- Systemic exposure to thiopurines and risk of relapse in children with acute lymphoblastic leukemia: A children's oncology group study. JAMA Oncol. 2015;1:287-95.
- [Google Scholar]
- Medication errors on oral chemotherapy in children with acute lymphoblastic leukemia in a developing country. Pediatr Blood Cancer. 2014;61:2218-22.
- [Google Scholar]
- Symptom to door interval in febrile neutropenia: Perspective in India. Support Care Cancer. 2013;21:1321-7.
- [Google Scholar]
- Trajectory of material hardship and income poverty in families of children undergoing chemotherapy: A prospective cohort study. Pediatr Blood Cancer. 2016;63:105-11.
- [Google Scholar]
- Differentials in survival for childhood cancer in Australia by remoteness of residence and area disadvantage. Cancer Epidemiol Biomarkers Prev. 2011;20:1649-56.
- [Google Scholar]
- Secular trends and predictors of mortality in acute lymphoblastic leukemia for children of low socioeconomic level in Northeast Brazil. Leuk Res. 2015;39:1060-5.
- [Google Scholar]
- Nutritional status at diagnosis is related to clinical outcomes in children and adolescents with cancer: A perspective from central America. Eur J Cancer. 2012;48:243-52.
- [Google Scholar]
- Nutritional status of children during treatment for acute lymphoblastic leukemia in Guatemala. Pediatr Blood Cancer. 2013;60:911-5.
- [Google Scholar]
- Children, cancer, and nutrition – A dynamic triangle in review. Cancer. 2004;100:677-87.
- [Google Scholar]


