Translate this page into:
Comprehensive cataloging of miR-363 as a therapeutic & non-invasive biomarker of prostate cancer
For correspondence: Dr Mohammad Kaleem Ahmad, Department of Biochemistry, King George’s Medical University, Lucknow 226 003, Uttar Pradesh, India e-mail: mohdkaleemahmad@kgmcindia.edu
-
Received: ,
Accepted: ,
Abstract
Background & objectives
Overcoming the challenge of early diagnosis of prostate cancer (PCa) by exploring molecular biomarkers is urgently needed. With this objective, this study was designed to explore the biomarker and therapeutic potential of miRNA (miR)-363-3p in PCa pathogenesis.
Methods
Total participants (n=188) were enrolled, and blood and tissue samples were collected from individuals categorized into the control group (n=55), benign prostate hyperplasia (BPH) group (n=60), PCa group (n=48), and castration-resistant PCa (CRPC) group (n=25). MiR expression profiling was carried out using quantitative polymerase chain reaction (qPCR), and biomarker analysis was conducted employing receiver operating characteristics (ROC) curve. The miR-363 target genes were predicted by in silico tools like Target Scan and starBasev 2.0 and its expression was validated by qPCR and association among them was established by using the STRING database.
Results
The results showed that the tumour-suppressive nature of miR-363-3p in both PCa tissues and serum were significantly higher than the control with a greater area under curve (AUC) was 0.969 (sensitivity: 85%; specificity 100%) and 0.988 (sensitivity: 97.5%; specificity: 87.5%), respectively. The targetome analysis of miR-363-3p revealed five target genes-NRAS, E2F3, PTEN, MDM2, and CCNE2 which were strongly associated with cell division and proliferation. The expression analysis of the target genes showed a significant tumour-suppression of PTEN gene and significant upregulation of oncogenic genes such as NRAS, E2F3, MDM2, and CCNE2.
Interpretation & conclusions
Collectively, the findings of this study suggest that miR-363-3p may be a potential biomarker in differentiating individuals with PCa and CRPC from healthy controls. The miR-363-3p triggers various oncogenic genes (MDM2, NRAS, E2F3, CCNE2) and tumour suppressor genes (PTEN) that are actively involved in PCa progression and development.
Keywords
Biomarker
microRNA
prostate cancer
Cancer statistics 2020 reports that among males worldwide, prostate cancer (PCa) ranks as the second most common cancer, after lung cancer, and the fifth most cause of cancer-related death1. In Asian countries like India, it is observed that over time there has been an increase in the global incidence of up to 9.3 per cent new cases, and a 13.9 per cent mortality rate with a 5.8 per cent prevalence rate2. The heterogeneous nature with the decelerated tumour growth rate of PCa in due course of time causes its early detection difficult3. Despite the availability of modern diagnostic procedures for prostate cancer (PCa), such as serum prostate specific antigen (PSA) level measurement, Digital Rectal Examination (DRE), and Gleason biopsy, these methods have been reported to produce inaccurate results at times, leading to false positive mistakes4. These can hence lead to misdiagnosis and over-treatment causing several complications of invasive methods. Therefore, to overcome the burden, researchers all around the world are focused on alteration caused by PCa at the genomics and proteomics level. Molecular biomarkers that can objectively and selectively measure the pathological state of the disease have been studied immensely4. MicroRNA (miR) is one of the possible biomarkers discussed in the present study since these can sensitively and precisely detect the early stage of PCa5.
MiRs are highly conserved non-coding regions that are post-transcriptionally involved in many biological processes like apoptosis, proliferation, differentiation, division, etc. These are 20-22 base pair long and target multiple genes to form complex networks6. These play an important role in PCa initiation and development. Several studies indicate their expression as a tumour suppressor or oncogenic depending upon the microenvironment these are present in PCa7.Their ambiguous nature of expression along with multiple target genes makes it suitable for therapeutic purposes in the management of PCa.
The miR-363 is found within a cluster of miR-106-92a. The dysregulation of miR-363 has been connected to tumour-suppressing effects in various cancers according to published studies8-11. Accumulating evidence shows that miR-363-3p plays a role in PCa tumour genesis by targeting genes like DKK312. However, only a few studies indicate its expression in PCa and its later stages. Hence, this study was undertaken to explore the biomarker potential of miR-363-3p in both solid and liquid biopsies and compare them with their clinicopathological parameters. Furthermore we undertook to perform computational analysis of miR-363-3p targetome to predict and validate the target genes significantly involved in PCa progression and development.
Material & Methods
This study was undertaken at the department of Biochemistry, King George’s Medical University (KGMU), Lucknow, and samples were taken from department of Urology, KGMU, Lucknow, after obtaining the ethical approval from the Institutional Ethical Committee (IEC). The study was conducted between December 2021 to September 2023. Voluntary informed and written consent was obtained from all the study participants to collect tissue and blood samples.
Study participants and sample collection
A total number of 188 participants who presented to the department of Urology, KGMU, Lucknow were undertaken to collect tissue samples. The individuals with age more than 40 years and pathologically confirmed for BPH and PCa by Gleason Score were enrolled for the study. The tissue samples were taken from participants with PCa (n=48) and BPH (n=60) undergoing TransRectal Ultrasound (TRUS) and Transurethral resection of the prostate (TURP), respectively. No tissues were collected from CRPC and healthy male participants. The tissue samples were maintained in RNAlater (Thermo Fischer Scientific, USA) by slicing them into 0.5 cm segments and submerging them in the solution. The blood samples collected from healthy males (n=55), CRPC (n=25), PCa, and BPH for serum isolation. Those suffering from any other chronic malignancy were excluded from the study. The plain vials underwent centrifugation at x2000 rpm for 10 min to separate serum, then stored in Qiazol reagent (Qiagen, Germany) at a 1:200 ratio at -80°C.
Isolation of miR and total RNA
MiR was extracted from serum as per the instructions provided by the manufacturer using the miRNAeasy serum/plasma kit (Qiagen, Germany) and the mirVanaTM miRNA Isolation Kit (Invitrogen, USA)13. Following the instructions provided by Takara, the microRNA was transformed into cDNA using their MiRNA-X miRNA First-Strand Synthesis Kit (TaKaRa, Japan). Subsequently, it was stored at a temperature of -80°C in preparation for expression study. Using a manual organic extraction technique, total RNA was extracted from whole blood. This RNA is then transformed into complementary DNA using Applied Biosystems’ High-Capacity cDNA Reverse Transcription Kit (ThermoScientific, USA).
Relative quantification of miR by real time-PCR
The TB Green Advantage® qPCR Premix (TaKaRa, Japan) and the iTaq™ Universal SYBR® Green Supermix (Bio-Rad, USA) were used for the quantitative real-time-PCR (qRT-PCR) measurement of target genes’ microRNA and relative mRNA expression. The sequence of primers of miR and mRNA used in this study for RT-PCR are listed in Supplementary Table. The qRT-PCR utilized the cDNA as a template. This was accomplished by means of an Applied Biosystems rapid real-time PCR equipment (7500HT, ABI, USA). Denaturation at 95°C for 10 sec, followed by 40 cycles of denaturation at 95°C for 5 sec, 60°C for 20 sec, and a dissociation curve at 95°C for 60 sec, 55°C for 30 sec, and 95°C for 30 sec were carried out under these standard conditions13. U6 expression acts as an internal control for miR, whereas GAPDH served as an internal control for mRNA, to standardize the results. Utilizing the 2-dd Ct technique for fold change expression of miRs, the Cycle of threshold (Ct) value for every sample was computed.
MiR targetome analysis by in silico tools
For prediction of target gene prediction, we used software including TargetScan ( https://www.targetscan.org/vert_72/), starBase v2.0 ( http://starbase.sysu.edu.cn/), and miRDB ( https://mirdb.org/) to locate specific genes targeted by miR14,15. A number of factors were considered for selecting target genes, including the projected target efficacy (using the context+ scores technique), the location of the putative regulatory elements, the evolutionary conservation, and the risk of off-target effects. This assisted in reducing the amount of findings that were reported as false positives. The DAVID 6.8 Bioinformatic programme was utilized in order to carry out the pathway enrichment analysis for the Kyoto Encyclopaedia of Genes and Genomes (KEGG)16. Annotation, visualization, functional analysis, and integrated discovery were all performed using DAVID version 6.8 once the predicted target genes were put in. After doing an analysis of the molecular genes that were targeted, the KEGG pathway was carried out.
Statistical analysis
The data were subjected to analysis using the Statistical Package for Social Sciences version (SPSS) 21(IBM, USA) and GraphPad Prism 5.0 (Dotmatics, USA). Mann-Whitney U test was used to analyze non-parametric data. The biomarkers for CRPC, BPH, and PCa were identified using Receiver Operating Characteristic (ROC) curves. The area under the curve (AUC), sensitivity, and specificity were calculated using Youden’s index. A result with a P value of less than 0.05 was deemed statistically significant.
Result
The demographic details of individuals enrolled in this study revealed a gradual increase in mean age with the pathogenesis of the prostate gland. Also, the PSA level was found to be >20 ng/ml only in PCa (56.2%) and CRPC (100%) group, while the PSA level between 11-20 ng/ml was found to be greater in PCa (39.6%) as compared to BPH (13.3%) group (Table I).
| Clinical characteristics | CRPC (n=25), n (%) | Prostate cancer (n=48), n (%) | Benign prostate hyperplasia (n=60), n (%) | Control (n=55), n (%) |
|---|---|---|---|---|
| Age (yr) | ||||
| Mean | 73.9 (70-81) | 68.5 (51-70) | 51.4 (40-65) | 41.6 (40-50) |
| PSA (ng/ml) | ||||
| 02-10 | 0 | 2 (4.2) | 52 (86.7) | 55 (100) |
| 11-20 | 0 | 19 (39.6) | 8 (13.3) | 0 |
| >20 | 25 (100) | 27 (56.2) | 0 | 0 |
| Prostate volume (ml) | ||||
| Mean | - | 52.8 | 42.9 | 32 |
| Gleason Score | ||||
| 7 | 0 | 22 (45.8) | - | - |
| ≥7 | 25 (100) | 26 (54.2) | - | - |
| Tumour stage | ||||
| T2a | 2 (8) | 13 (27.1) | - | - |
| T2b or T2c | 10 (4) | 29 (60.4) | - | - |
| ≥T3 | 13 (52) | 6 (12.5) | - | - |
| Lymph node status | ||||
| N0 | 8 (32) | 18 (37.5) | - | - |
| N+ | 17 (68) | 30 (62.5) | - | - |
N0/N+, lymph node absent/present
Quantitative validation of miR expression in tissue and serum
As reported previously, we reported miR-363-3p to have significantly downregulated in PCa as compared to BPH via microarray technique17. In the present study, a comparison between BPH and PCa tissue samples showed significant (P<0.0001) down regulation of miR-363 with a 2.99 fold change decrease (Fig. 1A). Similarly, expression of miR-363 in the serum of healthy control, BPH, PCa, and CRPC was found to be significantly (P<0.0001) down regulated with a 4.91, 6.11, and 6.06 fold change decrease, respectively (Fig. 1B). On applying the t-test, between the BPH and PCa, and BPH and CRPC groups, it was seen that PCa and CRPC were significantly (P<0.0001) down regulated with 1.19 and 1.14 fold change decrease, respectively, as compared with BPH.
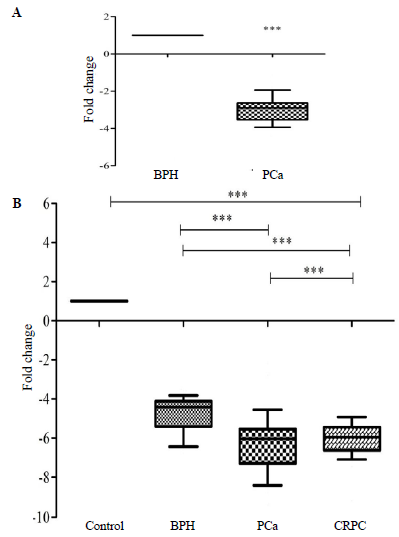
- The expression profiling of miR-363 in (A) prostate cancer (PCa) tissue (n=48) as compared to the Benign Prostate Hyperplasia (BPH) tissue (n=60) and (B) BPH (n=60), prostate cancer(n=48), and Castration-Resistant Prostate Cancer (CRPC) serum (n=25) as compared to the healthy control serum (n=55), respectively. The miR-363-3p was significantly downregulated in both tissue and serum (P***<0.0001).
Association of miR-363 with clinicopathological parameters
The expression of miR-363 was correlated with clinicopathological parameters like Gleason Score, prostate volume, and PSA level. It was found that the miR-363 expression in the serum of the PCa group was negatively and significantly correlated with Gleason Score (P<0.05) and prostate volume (P<0.01) (Table II). Likewise, the Gleason Score was negative and significantly (P<0.01) correlated with miR 363-3p in the CRPC serum group (Table II). This observation suggests that as the Gleason Score increased and the disease progressed, miR-363 expression decreases. While other parameters including lymph node distribution showed no significant association with miR-363 expression in BPH, PCa, and CRPC (Fig. 2).
| Clinicopathological parameters | BPH | PCa | CRPC | ||
|---|---|---|---|---|---|
| Serum | Tissue | Serum | Tissue | Serum | |
| Gleason Score | -0.31* | -0.293 | -0.395** | ||
| PSA level | -0.177 | -0.065 | -0.071 | 0.0013 | 0.128 |
| Prostate volume | 0.128 | -0.243 | -0.37** | 0.045 | |
P*>0.05; **>0.01
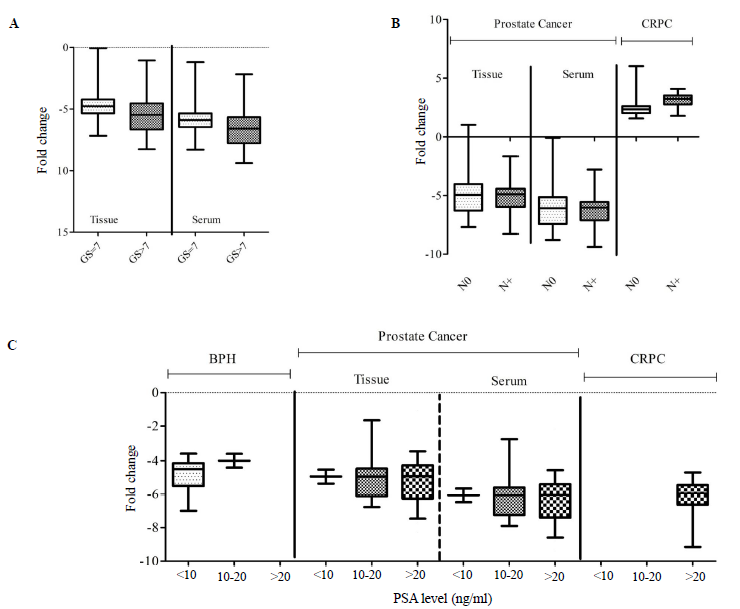
- The relative expression (fold change) of miR-363-3p with (A) Gleason Score (GS) in PCa group, (B) lymph node (N) distribution in PCa and CRPC groups, and (C) PSA level in BPH, prostate cancer and CRPC. PSA, prostate specific antigen.
Diagnostic potential of miR-363
According to ROC curve analysis, miR-363 covered a highly significant (P<0.0001) area in both PCa tissue (0.969; sensitivity: 85%; specificity 100%) as well as serum (0.988; sensitivity: 97.5%; specificity: 87.5%) (Fig. 3A & B). Similarly, for CRPC, miR showed a significant (P<0.0001) AUC with 0.894, 85 per cent sensitivity, and 87.5 per cent specificity (Fig. 3B). However, for BPH, miR has the least AUC (0.144) but is significant (P=0.002) and has 87.5 per cent sensitivity and 10 per cent specificity (Fig. 3B).
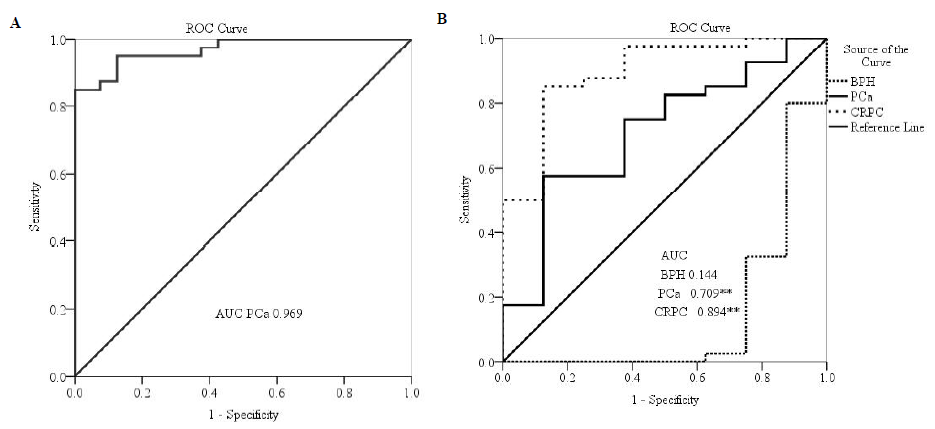
- The biomarker analysis of miR-363 in (A) prostate cancer tissue, (B) BPH, prostate cancer, and CRPC serum. The AUC lying between 0.8 to 0.9 is considered excellent and denotes high potential as diagnostic biomarker since it can differentiate between BPH, PCa and CRPC from healthy controls.
Targetome analysis of miR-363
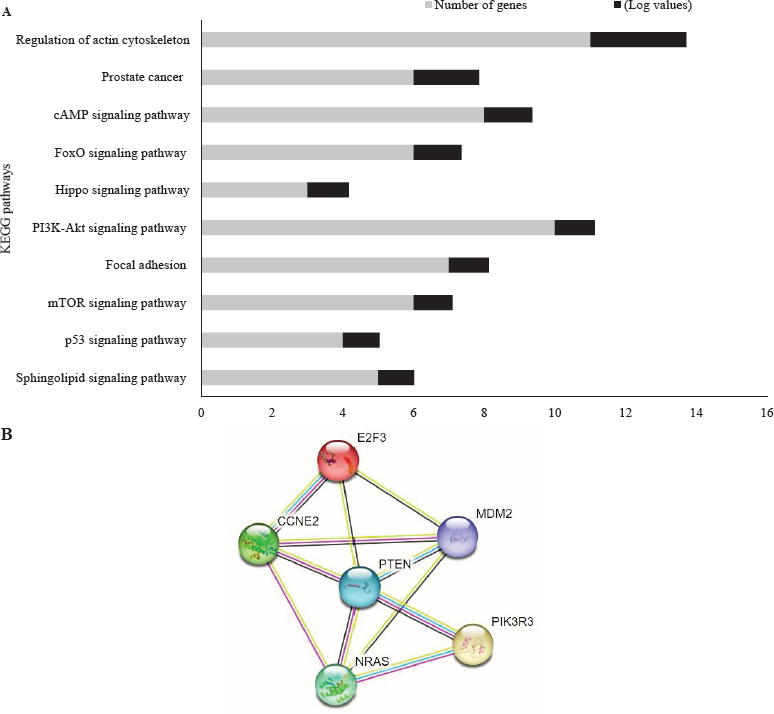
In silico targetome analysis of miR-363 to predict target genes involved in PCa pathogenesis was performed. The Venn diagram (Supplementary Fig. 1) shows the 257 commonly targeted genes. All the common target genes were used for KEGG pathway analysis. Upon analyzing the enrichment scores, significant P value and the number of genes involved, it was seen that maximum target genes were part of regulation of actin cytoskeleton, PCa, PI3-Akt pathway, followed by other pathways like FoxO signaling pathway, Hippo signalling (Fig. 4A). Also, among several pathways, it was found that a handful number of target genes like CCNE2, E2F3, PTEN, MDM2, and other were directly involved in PCa pathway as seen in the enrichment graph and KEGG map (Fig. 4B; Supplementary Fig. 1). All the genes were evaluated further by ENCORI database, to evaluate their in silico correlation and binding with miR-363-3 (P<0.5) using Pan-Cancer and miR-mRNA interaction, respectively. We found that out of six genes, five genes have a significant correlation with miR-363-3p. However, PIK3R3 did not have a significant correlation with miR-363-3p (Supplementary Fig. 2).
-
(A) KEGG pathway analysis of miR-363 target genes as predicted by in silico tools. Potential target genes are involved in prostate cancer pathway. (B) The target genes (E2F3, MDM2, CCNE2, PTEN, and NRAS) association using String database with a enrichment value 0.00171. The stronger association and combination is shown by more number of colored line. KEGG, Kyoto encyclopedia of genes and genome.
Gene expression
The expression analysis of NRAS, E2F3, CCNE2 and MDM2 showed a significant up-regulation with 5.46, 5.26, 3.11 and 3.3 fold change increase, respectively, in PCa tissues as compared with BPH tissues (Fig. 5A). On the contrary, a significant down-regulation of PTEN gene, a tumour suppressor was observed with a 5.61 fold change decrease in PCa tissues as compared with BPH tissues (Fig. 5A).
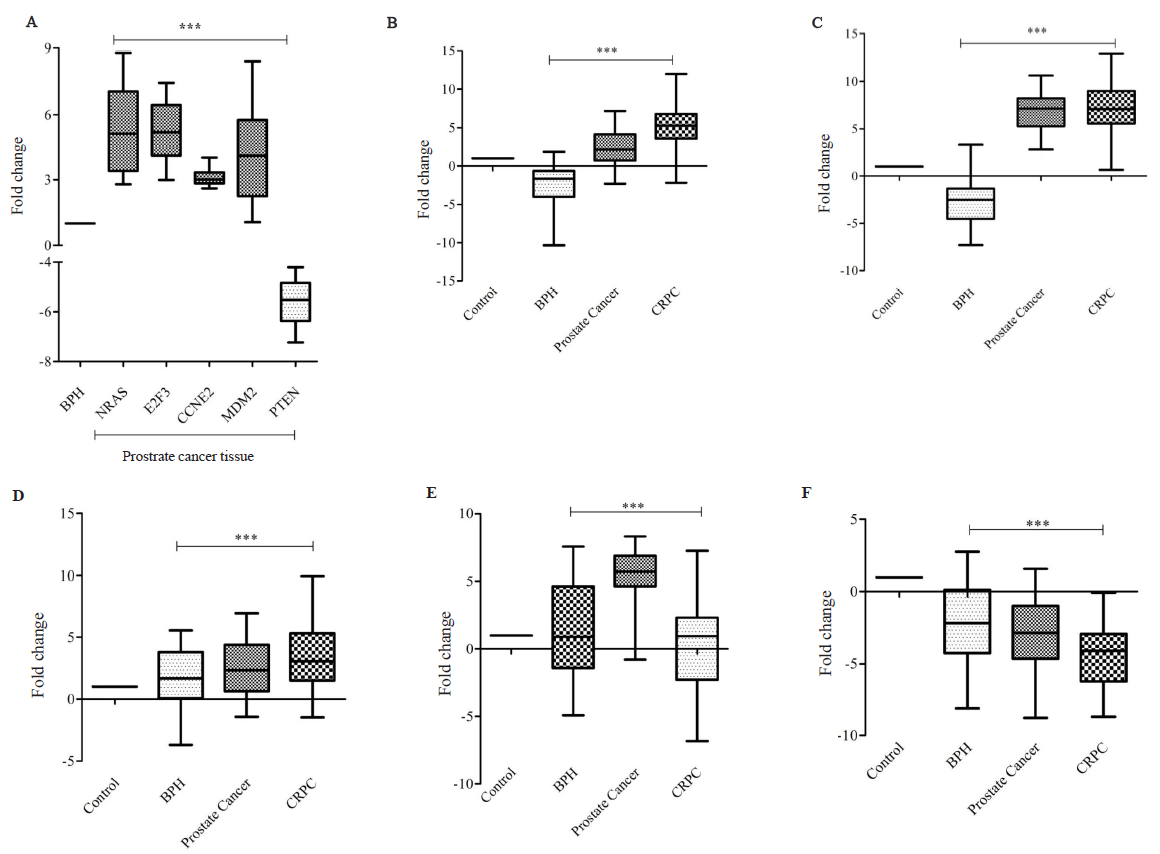
- The expression analysis of Targetome of miR-363. (A) Target genes in prostate cancer tissue (n=48), (B) NRAS, (C) E2F3, (D) CCNE2, (D) MDM2, and (E) PTEN in BPH (n=60), prostate cancer (n=48), and castration resistant prostate cancer (CRPC) (n=25) as compared with healthy control (n=55). The NRAS, E2F3, CCNE2, and MDM2 gene was significantly upregulated in both tissue and serum while PTEN was significantly down-regulated (significant values P***<0.0001).
The gene expression in serum samples for the PCa group revealed a significant upregulation of NRAS, E2F3, CCNE2 and MDM2 with 2.32, 6.81, 2.66, and 5.46 fold change increase, respectively, and significant downregulation of PTEN with 2.93 fold change decrease as compared to the healthy males (Fig. 5B-F). Similarly, significant (P<0.0001) pattern of upregulation of CCNE2 (3.46 fold change), E2F3 (7.14 fold change), MDM2 (0.22 fold change), and NRAS (5.51 fold change) and down-regulation of PTEN (4.27 fold change) for CRPC group was observed as compared with healthy males (Fig. 5B-F).
The association between miR-363-3p and target genes indicates that CCNE2 was notably and positively associated with CRPC out of the five genes. Heat map revealed that the target genes exhibited the highest negative correlation with NRAS, CCNE2, E2F3, and a slightly lower correlation with MDM2. Conversely, PTEN showed a positive correlation with miR-363 in BPH, PCa, and CRPC serum (Fig. 6). This suggests that as the expression of miR-363-3p decreased during PCa progression, PTEN expression also decreased simultaneously.
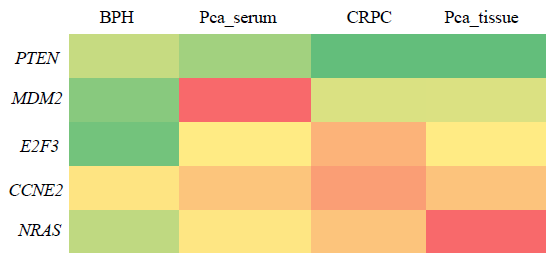
- The heatmap of correlation of miR-363 with target gene expression (NRAS, E2F3, CCNE2, MDM2, PTEN and PIK3R3). Red indicates the lowest value, orange indicates mid percentile at 50 and green indicates the highest value (Significance at P*> 0.05).
Discussion
The decelerated growth rate of tumours and lack of precise and accurate diagnostic methods for PCa require advances in the early detection of PCa. Recently, there has been a lot of research ongoing to evaluate the aberrant expression of miRs to explore the biomarker potential. The dysregulation of miR has commonly been seen in many cancers, as both oncogenic and tumour suppressors, depending upon the tumour microenvironment. Exploring the role of miR in PCa aims to improve diagnostic accuracy by identifying specific miR signatures that can differentiate these conditions from healthy individuals. Our prior investigation identified the diagnostic potential of miR-141, miR-335, miR-1290, miR-100, miR-4510, miR-183, and miR-329 as key biomarkers supported by bioinformatic analysis and statistical validation13,18. Besides these miRs, the microarray profiling on the PCa and BPH tissue samples revealed miR-363-3p as one of the significantly downregulated miR17. In this study, the expression profiling of miR-363-3p on an independent set of tissue and serum and validated the significant down regulation of miR-363-3p.
The miR-363 is found on the Xq26.2 chromosome within a cluster of miR106-92a. This cluster has two autosomal paralogs miR-17–92 and miR-106b–25, that show oncogenic behaviour in various cancer19. This cluster consists of miR-106a, miR-18b, miR-19b-2, miR-20b, miR-92a-2 and miR-36320. Unlike five miRs having their seed sequences in oncogenic expression, miR-363-3p has been found to be dysregulated with tumour-suppressive effects on various cancers like breast, colorectal, and others21,22. Although there have been only a few studies exploring the role of miR-363-3p in PCa, some studies suggest a significant down regulation of miR-363-3p in both tissue as well as serum23. Similarly, this study showed a significant (P<0.0001) down-regulation of miR-363-3p in PCa and CRPC with 1.19 and 1.14 fold change decrease as compared with BPH. Moreover, the ROC curve analysis of miR suggested good biomarker potential because with significant AUC, high sensitivity, and high specificities. Furthermore study also showed miR-363-3p having significant non-invasive biomarker potential to distinguish PCa and CRPC from healthy controls.
The targetome analysis revealed that miR-363 was significantly involved in the many biological processes like cell cycle, proliferation, and cell survival via targeting PTEN, MDM2, NRAS, CCNE2, and E2F3, as predicted by in silico tools. These genes form a strong association with the genes in PCa network as seen in KEGG pathway map (map05215). There are three main phenotypes that describe cancer, namely, proliferation, migration, and invasive, which are evidently related to miR-363 as its functional role suggested by various studies8,24. He et al25 suggested miR-363 as tumour suppressor in osteosarcoma in vitro and in vivo by targeting PDZD2 and PCNA affecting the tumour growth, apoptosis, and EMT phenotypes25. Xie et al8, suggested the involvement of miR-363 in renal cell carcinoma by suppressing proliferation, migration, and invasion by directly targeting S1PR18. Conversely, study showed that upregulated miR-363 in PC3 cells induced cell proliferation through c-MYC, a downstream target9. Among the target genes of miR-363-3p, in this study, PTEN was significantly downregulated in PCa and CRPC due to its tumour suppressive properties. Loss of PTEN activity is evidently categorized as one of the most common driving events for PCa pathogenesis due to its 70 per cent incidence in PCa patients10. It is a major part of the PI3-AKT and mTOR pathways11. It is involved in triggering signals to cells for proliferation, apoptosis, migration, adhesion, and angiogenesis. The other target genes like E2F3, CCNE2, MDM2, and NRAS were significantly upregulated in PCa and CRPC as compared to healthy controls.
CCNE2 is a cyclin that binds to Cyclin-dependent kinases (CDK) for the progression of the cell cycle26. Our findings suggest that CCNE2 and E2F3 were significantly upregulated in PCa and CRPC. CCNE2 and CDK2 phosphorylate retinoblastoma (RB1) are key factors triggering E2F3, a transcription factor. E2F3 has been reported to be significantly upregulated in cancers by regulating proliferation and cell-cycle processes26. This whole mechanism helps G1/S phase transformation during cell division. During PCa tumorigenesis, the CCNE2 and E2F3 gene anomalies cause their upregulation27.
The next target gene MDM2 is an oncogene, was also upregulated in PCa tissue and serum in this study. This gene forms an oncogenic-tumour suppressor relation with PTEN. It was previously observed that PTEN downregulates in aberrant conditions and PI3-AKT phosphorylates to activate AKT, which targets the localization and movement of MDM2 in the nucleus28. Inside the nucleus, MDM2 regulates the negative feedback loop with p53. MDM2 transcriptionally targets p53 and ubiquitinates p53 for proteasomal degradation. In this manner, cell cycle (G1 and G2 phase) arrest and apoptosis are disrupted leading to uncontrolled cell proliferation. p53 is generally expressed during metastasis or androgen-independent growth29. The latter condition is CRPC where the cancer cell resists androgen depletion therapy and continues to express its activity. In an independent manner, MDM2 is reported to interact with FoxO3A (a transcription factor for cell cycle regulatory proteins), epithelial-mesenchymal transition via E-cadherin and slug proteins, and pRB. The MDM2 binds with pRB to trigger E2F transcriptional factors responsible for G1/S phase progression that cause an effect on tumour growth. It is reported to be increased in PCa patients with radiotherapy29. For therapeutics, it is suggested that as PTEN interacts with p53, MDM2 association with chemotherapy reverses to provide better treatment possibilities.
NRAS gene is a protooncogene that belongs to Ras family and is rarely found mutated in PCa, estimated at 0.41 per cent approximately30. Our study indicates its upregulation as the disease progresses to the CRPC stage. NRAS and other Ras family members are activated by a series of signal transduction with GTPase as energy exchange. These activate RAF by phosphorylating it at Ser338 and Thr341. This complex initiates and triggers cellular proliferation and differentiation at the end31. Due to its rarity of mutation, there are only a few studies indicating their involvement in PCa. Other cancers like colorectal cancer have reported the synergist effect of EGFR-Ras in therapeutic interventions.
Overall this study highlights the tumour suppressive function of miR-363-3p and its potential as a non-invasive diagnostic biomarker in the progression of PCa from BPH to CRPC. The findings suggest a negative correlation between miR-363-3p levels and increasing Gleason Score as the disease advances. Additionally, there was an inverse relationship observed between miR-363-3p expression and serum PSA levels in PCa and BPH affected individuals. However, it is a larger sample size, a more robust association between miR-363-3p and clinicopathological parameters such as lymph node involvement and metastasis could be established. Apart from its association with clinicopathological factors, miR-363-3p also modulates the expression of various oncogenes (MDM2, NRAS, E2F3, CCNE2) and tumour suppressor genes (PTEN) that play crucial roles in disease progression, suggesting their potential as therapeutic targets for improved diagnosis and management of PCa.
Financial support & sponsorship
The study was supported by the grant received from the Indian Council of Medical Research, New Delhi (5/4/7-13/2019-NCD-II).
Conflicts of Interest
None.
Use of Artificial Intelligence (AI)-Assisted Technology for manuscript preparation
The authors confirm that there was no use of AI-assisted technology for assisting in the writing of the manuscript and no images were manipulated using AI.
References
- Global cancer statistics 2020: GLOBOCAN estimates of incidence and mortality worldwide for 36 cancers in 185 Countries. CA Cancer J Clin. 2021;71:209-49.
- [Google Scholar]
- Biomarkers in prostate cancer diagnosis: From current knowledge to the role of metabolomics and exosomes. Int J Mol Sci. 2021;22:4367.
- [Google Scholar]
- MicroRNAs as biomarkers for prostate cancer prognosis: A systematic review and a systematic reanalysis of public data. Br J Cancer. 2022;126:502-13.
- [Google Scholar]
- Oncogenic and tumor-suppressive microRNAs in prostate cancer. Curr Opin Endocr Metab Res. 2020;10:50-9.
- [Google Scholar]
- miR-363 suppresses the proliferation, migration and invasion of clear cell renal cell carcinoma by downregulating S1PR1. Cancer Cell Int. 2020;20:227.
- [Google Scholar]
- MicroRNA 363 mediated positive regulation of c-myc translation affect prostate cancer development and progress. Neoplasma. 2015;62:191-8.
- [Google Scholar]
- PTEN genomic deletion is associated with p-Akt and AR signalling in poorer outcome, hormone refractory prostate cancer. J Pathol. 2009;218:505-13.
- [Google Scholar]
- MiR-363-3p promotes prostate cancer tumor progression by targeting Dickkopf 3. J Clin Lab Anal. 2022;36:e24360.
- [Google Scholar]
- Screening and validation of novel serum panel of microRNA in stratification of prostate cancer. Prostate Int. 2023;11:150-8.
- [Google Scholar]
- Predicting effective microRNA target sites in mammalian mRNAs. Elife. 2015;4:e05005.
- [Google Scholar]
- starBase v2.0: Decoding miRNA-ceRNA, miRNA-ncRNA and protein-RNA interaction networks from large-scale CLIP-Seq data. Nucleic Acids Res. 2014;42:D92-7.
- [Google Scholar]
- DAVID: A web server for functional enrichment analysis and functional annotation of gene lists (2021 update) Nucleic Acids Res. 2022;50:W216-W221.
- [Google Scholar]
- Evaluation of miR-711 as novel biomarker in prostate cancer progression. Asian Pac J Cancer Prev. 2017;18:2185-91.
- [Google Scholar]
- Discovery and validation of novel microRNA panel for non-invasive prediction of prostate cancer. Cureus. 2024;16:e58207.
- [Google Scholar]
- Circulating microRNAs from the miR-106a-363 cluster on chromosome X as novel diagnostic biomarkers for breast cancer. Breast Cancer Res Treat. 2018;170:257-70.
- [Google Scholar]
- Export of microRNAs and microRNA-protective protein by mammalian cells. Nucleic Acids Res. 2010;38:7248-59.
- [Google Scholar]
- Circulating microRNAs as biomarkers of colorectal cancer: Results from a genome-wide profiling and validation study. Clin Gastroenterol Hepatol. 2013;11:681-8.e3.
- [Google Scholar]
- Clinical relevance of circulating cell-free microRNAs in cancer. Nat Rev Clin Oncol. 2014;11:145-56.
- [Google Scholar]
- Circulating microRNAs as stable blood-based markers for cancer detection. Proc Natl Acad Sci USA. 2008;105:10513-8.
- [Google Scholar]
- MiR-363 restrain the proliferation, migration and invasion of colorectal carcinoma cell by targeting E2F3. J Cancer. 2023;14:1362-70.
- [Google Scholar]
- miR-363 acts as a tumor suppressor in osteosarcoma cells by inhibiting PDZD2. Oncol Rep. 2019;41:2729-38.
- [Google Scholar]
- Distinct and redundant functions of cyclin E1 and cyclin E2 in development and cancer. Cell Div. 2010;5:2.
- [Google Scholar]
- Cdc6 and cyclin E2 are PTEN-regulated genes associated with human prostate cancer metastasis. Neoplasia. 2009;11:66-76.
- [Google Scholar]
- The PTEN, Mdm2, p53 tumor suppressor-oncoprotein network. Trends Biochem Sci. 2002;27:462-7.
- [Google Scholar]
- AACR Project GENIE: Powering precision medicine through an international consortium. Cancer Discov. 2017;7:818-31.
- [Google Scholar]
- Ptenloss and RAS/MAPK activation cooperate to promote EMT and metastasis initiated from prostate cancer stem/progenitor cells. Cancer Res. 2012;72:1878-89.
- [Google Scholar]


