
Translate this page into:
Clinical spectrum & changing presentation of celiac disease in Indian children
For correspondence: Dr Sadhna Bhasin Lal, Division of Paediatric Gastroenterology, Hepatology & Nutrition, Postgraduate Institute of Medical Education & Research, Sector 12, Chandigarh 160 012, India e-mail: sadhnalal2014@gmail.com
-
Received: ,
This article was originally published by Wolters Kluwer - Medknow and was migrated to Scientific Scholar after the change of Publisher.
Abstract
Background & objectives:
Celiac disease (CD) is a genetic immune mediated disorder characterised by gluten intolerance. This single centre study, from north India was aimed to assess the clinical, serological and histological profile of CD in a large cohort of children and the changing trends in its presentation.
Methods:
A review of clinical details of CD children diagnosed between 2000 and 2019 and currently on follow up was performed. Information on demography, symptoms, associated conditions, serology, biopsy findings and gluten-free diet were analyzed.
Results:
The mean age (±standard deviation) of 891 children included in the study, at onset and at diagnosis was 4.0±2.7 and 6.2±3.1 yr, respectively. Growth faltering, abdominal pain, abdominal distension and diarrhoea were presenting symptoms in 70, 64.2, 61.2 and 58.2 per cent, respectively. A positive family history of CD was present in 14 per cent and autoimmune conditions in 12.3 per cent of children. Thyroid disorders were seen in 8.5 per cent of children and Type 1 diabetes mellitus (T1DM) in 5.7 per cent. The duration of breastfeeding had a weak positive correlation with age at onset and diagnosis of CD (P<0.001). Non-classical CD was significantly more common in children aged >10 yr and in those presenting after 2010 (P<0.01). T1DM and hypothyroidism occurred more frequently in non-compliant children.
Interpretation & conclusions:
This was the largest single centre study, pertaining to the presentation and follow up of CD in children. Infants and young children were more likely to present with classical symptoms of diarrhoea, abdominal distension and growth failure while older children presented with non-classical CD. There was a trend towards non-classical forms of CD in recent years.
Keywords
Celiac disease
children
diarrhoea
gluten-free diet

Celiac disease (CD) is a lifelong gluten dependent, immune mediated disorder, occurring in genetically predisposed individuals. The reported prevalence in the West ranges from one to three per cent1-3. Once considered uncommon in India, CD is now increasingly reported4. CD children may present with abdominal or extra-abdominal manifestations or may remain asymptomatic. The gastrointestinal manifestations of CD include chronic diarrhoea, distension, pain, vomiting, constipation and the extra-intestinal manifestations include poor growth, short stature, anaemia, dermatitis herpetiformis, arthritis/arthralgia, osteoporosis, etc1. Over the past few years, non-classical and asymptomatic forms of CD are being increasingly recognized. A strict lifelong adherence to gluten-free diet (GFD) remains the key to management.
A recent meta-analysis reported a global prevalence of 1.4 per cent and India was among the countries with high prevalence rates of CD5. Although a few investigators have estimated the prevalence of CD in Indian children, the literature on various clinical presentations, their correlation with serology and histopathological findings and the results of long term follow up after GFD in CD children are limited4,6,7. Hence, this study was conceived to analyze the clinical spectrum, changing trends and post GFD outcome on long term follow up, to bridge the knowledge gap. Data were collected from CD children attending a paediatric celiac disease clinic (CDC), running for more than 20 yr now. This clinic is located in one of the largest public sector hospitals, in north India, in the wheat eating belt of the country.
Material & Methods
This retrospective, cross-sectional study was carried out in the division of Paediatric Gastroenterology & Hepatology, Postgraduate Institute of Medical Education & Research (PGIMER), Chandigarh. The study conformed to the Ethical guidelines of the 1975 Helsinki Declaration and was approved by the Institutional Ethics Committee (IEC/2020/592-1223).
A dedicated celiac disease clinic (CDC) for children was started at PGIMER in 1984 and from the year 2000, formal structured file based medical records including details of clinical presentation, feeding practices, examination findings, investigations and follow up information were maintained. Since the inception of the CDC, more than 10,000 children have been diagnosed and managed. The file based medical records of children diagnosed with CD, who had physically attended the CDC between April 2018 and March 2020, along with their parents were reviewed. This allowed a convenient access to files (of two years duration) in which there had been a recent evaluation of current status. The details of feeding history and presentation were recorded in the file at the time of initial registration in the clinic. The diagnosis of CD had been made between 2000 and 2019. Children with a confirmed diagnosis were included if they had been on a gluten free diet (GFD) for at least one year. Newly diagnosed children (GFD < one year), those with unconfirmed or wrongly labelled CD and those with inadequate details at presentation were excluded.
Demographic information and details regarding clinical presentation, age at onset of symptoms, age at diagnosis, family history, associated conditions, anthropometry at presentation and follow up were recorded and analyzed. Underweight was defined as weight for age <−2 standard deviation (SD) and stunting as height for age <−2 SD from the median of the WHO child growth standards. Details of serological tests for CD: tissue transglutaminase antibody (TTGA) and endomysial antibody (EMA) were noted at baseline and follow up. Upper gastrointestinal endoscopy and duodenal biopsy details were recorded.
Diagnosis of celiac disease (CD): Disease diagnosis was based on the revised criteria for diagnosis of CD 19908. After the European Society of Paediatric Gastroenterology Hepatology and Nutrition (ESPGHAN) 2012 guidelines9, biopsy was offered to all patients. Those, in whom biopsy could not be done, were confirmed to have CD, if the TTGA was >10 times above the upper limit and the symptoms responded on GFD. The changes in duodenal biopsy were graded as per the modified Marsh classification10. The various presentations of CD were classified as per the Oslo consensus definitions11. Children with Type 1 diabetes mellitus (T1DM) and positive serology were considered to have CD, and started on GFD, if they had at least Marsh Grade 2/3 on biopsy and/ or symptoms and signs attributable to CD.
Serological tests: TTGA estimation was done by indirect solid- phase ELISA (enzyme immunosorbent assay) kits (Binding Site, Birmingham, UK and Celikey IgA, Phadia GmbH, Freiburg, Germany; Phadia 100, Thermofisher Scientific, Sweden). Several of the baseline TTGA estimations were done before visiting our hospital by a variety of kits. Therefore, the results of each patient were categorized according to elevation above the upper limit of normal (ULN). Anti endomysial antibody (EMA) was done by indirect immunofluorescence, in house, using human umbilical cord as substrate and fluorescein isothiocyanate (FITC) tagged rabbit anti-human IgA (Dako, Germany). It was considered positive if there was a bright apple green fluorescence detected in a single serum dilution of 1:10 and antibody dilution of 1:100.
Gluten free diet (GFD): Details of GFD, namely, age at initiation, compliance, use of commercial GFD products, if any were analyzed. As per the standard departmental protocol, detailed counselling was carried out at diagnosis and dietary compliance and knowledge was assessed and reinforced at every follow up visit by a clinical nutritionist and a clinician. As per the protocol, children were encouraged to take home ground cereal based GFD due to a lack of formal testing for the safety, of the packaged, commercially available GFD in India. Compliance was assessed by resolution of symptoms, standard dietary review at every follow up visit and by repeat TTGA estimation (six monthly during the first year of GFD and annually thereafter). The GFD compliance was graded as good (home based GFD, ≥80 per cent negative TTGA reports, after the first year of starting GFD) and poor (deliberate dietary non-compliance ≥1 time every week, <80 per cent negative TTGA reports).
Statistical analysis: Analysis was performed using the Statistical Package for the Social Sciences software version 20.0 (SPSS Inc., IBM Corp., Armonk, NY, USA). Mean±standard deviation (SD) and proportions were used to summarize the variables. The Chi-square test was used to compare different categorical variables between the groups and t test was used for comparing the continuous variables. Pearson’s correlation coefficient was used to find the correlation between continuous variables; P<0.05 was considered significant.
Results
A total of 2430 patients attended the CDC during the study period were evaluated. Of these 1539 were excluded (532 newly diagnosed, 405 due to incomplete records pertaining to presentation, 62 unconfirmed/ mislabelled CD and 540 one or more revisits).
Thus, data from 891 children (mean age±SD; 12.9±5.1 yr; 54% boys) were analyzed. The mean age at the time of diagnosis and the onset of symptoms was 6.2±3.1 and 4.0±2.7 yr, respectively, with a mean diagnostic delay of 2.2 yr. Growth faltering was the most common (70%) presenting symptom followed by abdominal pain (64.2%), abdominal distension (61.2%) and diarrhoea (58.2%). Family history of CD and other autoimmune conditions were present in 14 (n=124) and 12.3 (n=109) per cent, respectively. Underweight at presentation was seen in 400 (45%) children and 365 (41%) were stunted. TTGA elevation ≥10 ULN was seen in 67 per cent (n=593) of children. Biopsy findings were available in 783 children, and of these, Marsh grade 3 changes were present in 681 (87%). Marsh 3 changes were seen in 79 per cent (468 of 593) of children with TTGA >10 ULN.
Early infant feeding details: History of any breastfeeding was present in 92.3 per cent (n=822), whereas exclusive breast feeding for ≥6 months was seen in 76 per cent (n=676) children. The mean duration of breastfeeding was 17±12 months and the mean age at cereal introduction was 8.4±4.4 months. There was a weak positive correlation between age at cereal introduction and age at onset of symptoms (r=0.13, P<0.001) and age at diagnosis (r=0.14, P<0.001) of CD. Similarly, duration of breastfeeding also had a weak positive correlation with age at onset (r=0.13, P<0.001) as well as at diagnosis of CD (r=0.13, P<0.001).
Presentations: More than half of the children (58.2%) presented with a classical form of CD and 30.3 per cent were classified as non-classical CD. About a tenth of the children (11.5%) had asymptomatic CD. On subgroup analysis of children with different presentations, those with non-classical CD had higher age at onset and diagnosis as well as higher haemoglobin levels compared to the children with classical CD (P<0.001). Presentation as celiac crisis (defined as acute onset diarrhoea with a combination of hypoproteinaemia/metabolic disturbances) was seen in 28 (3.1%) children and majority (n=23, 82.1%) were below six years at presentation. Furthermore, children aged >10 yr were more likely to present with non-classical rather than classical CD (54.2 vs. 39.3%, P<0.01). There were no significant differences in biopsy findings and rates of compliance among children with different presentations. The comparison of various parameters between the presentations is summarized in Table I and the trend in presentations over years is depicted in Fig. 1.
| Characteristics | Classical (n=519) | Non-classical (n=270) | Asymptomatic (n=102) |
|---|---|---|---|
| Age (yr), mean±SD | |||
| At onset | 3.3±2.3 | 4.7±2.7*** | - |
| At diagnosis | 5.6±3 | 6.8±2.9*** | 8.1±2.8 |
| Delay in diagnosis (yr), mean±SD | 2.34±2.3 | 2.1±2 | - |
| Gender - Boys, n (%) | 278 (53.6) | 145 (53.7) | 56 (55) |
| Early infant feeding details | |||
| Any breastfeeding, n (%) | 465 (89.6) | 260 (96.3)*** | 97 (95.1) |
| Exclusive breastfeeding ≥6 months, n (%) | 367 (70.7) | 223 (82.6) | 86 (84.3)*** |
| Total duration of breastfeeding in months, mean±SD | 15.8±11.8 | 18.8±11.8*** | 18.6±12.9 |
| Age of cereal introduction in months, mean±SD | 8.3±4.3 | 8.3±4.4 | 8.9±4.6 |
| Haemoglobin (g/dl), mean±SD | 8.7±1.9 | 9.0±1.9*** | 9.7±2.1 |
| TTGA, n (%)* | |||
| 2-5 ULN | 71 (13.7) | 26 (9.6) | 12 (11.8) |
| 5-10 ULN | 65 (12.5) | 26 (9.6) | 8 (7.8) |
| >10 ULN | 321 (61.8) | 195 (72.2) | 77 (75.5) |
| Negative | 62 (12) | 23 (8.5) | 5 (4.9) |
| HPE (n=783), n (%) | |||
| Marsh 1 | 15 (3.3) | 10 (4.1) | 3 (3.5) |
| Marsh 2 | 35 (7.6) | 28 (11.6) | 11 (13) |
| Marsh 3a | 105 (23) | 56 (23.2) | 25 (29.4) |
| Marsh 3b | 264 (57.8) | 133 (55.2) | 40 (47) |
| Marsh 3c | 38 (8.3) | 14 (5.8) | 6 (7.1) |
| GFD compliance (n=810), n (%) | |||
| Good | 184 (39) | 111 (45.1) | 42 (45.1) |
| Poor | 287 (61) | 135 (54.9) | 51 (54.9) |
P *<0.05, **<0.01, ***<0.001. SD, standard deviation; GFD, gluten free diet, TTGA, tissue transglutaminase antibody; ULN, upper limit of normal; HPE, histopathology examination
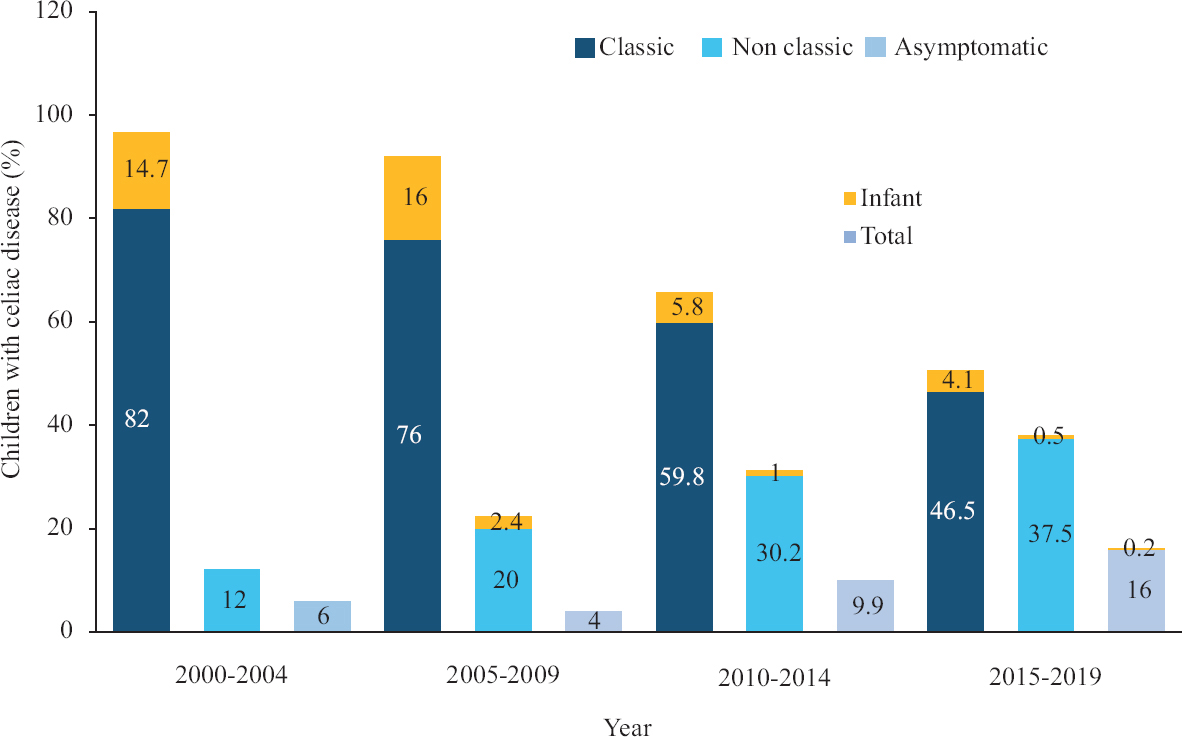
- Trend in presentations of celiac disease in children over the years. The yellow portion of the bars represents the percentage of children <2 yr of age at diagnosis (infant CD).
Infant CD: Children aged less than two year (infant CD) constituted eight per cent (n=72); TTGA >10 ULN was seen 46 per cent (n=33) and Marsh grade 3 changes were seen in 76.4 per cent (n=55). Among those with TTGA >10 ULN (n=33), 28 children (85%) had Marsh 3 changes on biopsy. Ten children (14%) presented with celiac crisis. A comparison between infant CD and those with older age at onset (late-onset CD) showed that children with infant CD presented with a significantly higher proportion of diarrhoea, abdominal distension, vomiting and crisis, whereas those with later onset CD presented more with non-classical symptoms such as constipation and abdominal pain (Table II). There were no significant differences in Marsh grades and compliance rates between these two sub groups. Children with infant CD had significantly lower (mean±SD) breastfeeding duration (12.2±10.4 vs. 17.5±12.1 months; P<0.001) and earlier age at cereal introduction (6.7±2.5 vs. 8.6±4.5 months; P<0.001) compared to older onset CD.
| Characteristics | Infant CD (n=72) | Later onset CD (n=819) |
|---|---|---|
| Gender - Boys, n (%) | 39 (54.2) | 440 (53.7) |
| Presentation, n (%) | ||
| Diarrhoea | 63 (87.5)*** | 456 (55.7) |
| Abdominal pain | 34 (47.2) | 538 (65.7)** |
| Abdominal distension | 59 (81.9)*** | 486 (59.3) |
| Growth faltering | 46 (63.9) | 579 (71)*** |
| Constipation | 7 (9.7) | 165 (20.1)* |
| Vomiting | 26 (36.1)* | 201 (24.5) |
| Crisis | 10 (13.9)*** | 18 (2.2) |
| Type of presentation, n (%) | ||
| Classical | 63 (87.5)*** | 456 (55.7) |
| Non-classical | 8 (11.1) | 262 (32)*** |
| Asymptomatic | 1 (1.4) | 101 (12.3)*** |
| Early infant feeding details, n (%) | ||
| Any breast feeding | 58 (80.6)*** | 764 (93.3) |
| Exclusive breastfeeding ≥6 months | 44 (61.1) | 632 (77.2)** |
| Total duration of breast feeding (in months), mean±SD | 12.2±10.4 | 17.5±12.1*** |
| Age of cereal introduction (in months), mean±SD | 6.7±2.5*** | 8.6±4.5 |
| Haemoglobin (g/dl), mean±SD** | 8.4±1.4 | 8.9±2.0 |
| TTGA, n (%)*** | ||
| 2-5 ULN | 13 (18.1) | 96 (11.7) |
| 5-10 ULN | 8 (11.1) | 91 (11.1) |
| >10 ULN | 33 (45.8) | 560 (68.4) |
| Negative | 18 (25) | 72 (8.8) |
| HPE (n=783), n (%) | ||
| Marsh 1 | 4 (6) | 24 (3.3) |
| Marsh 2 | 7 (10.7) | 67 (9.3) |
| Marsh 3a | 13 (19.7) | 173 (24.2) |
| Marsh 3b | 38 (57.6) | 399 (55.6) |
| Marsh 3c | 4 (6) | 54 (7.6) |
| GFD compliance (n=810), n (%) | ||
| Good | 26 (41.3) | 311 (41.6) |
| Poor | 37 (58.7) | 436 (58.4) |
P *<0.05, **<0.01, ***<0.001
Decade wise comparisons: The comparison of characteristics between children diagnosed before and after 2010 is summarized in Table III. Children with CD diagnosed before 2010 presented with significantly higher percentage of classical symptoms and signs such as diarrhoea, abdominal distension, growth faltering and anaemia (P<0.05). The breastfeeding rates also significantly differed between these groups with higher rates in those diagnosed after 2010 (P<0.05). Proportion of children with infant CD was significantly lower in those diagnosed after 2010 (5.8 vs. 14.5%; P<0.05). There was a trend towards higher age at onset and diagnosis, higher proportion of non-classical CD in those diagnosed after 2010 (Fig. 2).
| Characteristics | Before 2010 (n=235) | After 2010 (n=656) |
|---|---|---|
| Age (yr), mean±SD | ||
| At onset | 3.2±2.4 | 4.2±2.7*** |
| At diagnosis | 5.5±3.1 | 6.5±3.1*** |
| Gender - Boys, n (%) | 123 (52.3) | 356 (54.3) |
| Presentation, n (%) | ||
| Diarrhoea | 180 (76.6)*** | 339 (51.7) |
| Abdominal pain | 148 (63) | 424 (64.6) |
| Abdominal distension | 185 (78.7)*** | 360 (54.9) |
| Growth faltering | 177 (75.3)** | 448 (68.3) |
| Constipation | 34 (14.5) | 138 (21)* |
| Vomiting | 71 (30.2) | 156 (23.8) |
| Crisis | 15 (6.4)** | 13 (2) |
| Signs, n (%) | ||
| Pallor | 208 (88.5)* | 538 (82) |
| Rickets | 63 (26.8) | 197 (30) |
| Water soluble vitamin deficiencies | 74 (31.5)*** | 108 (16.5) |
| Anthropometry, mean±SD | ||
| Weight z score | −2.11±1.*** | −1.63±1.6 |
| Height z score | −2.32±1.4*** | −1.74±1.2 |
| BMI z score | −1.57±1.3*** | −1.1±1.2 |
| Underweight, n (%) | 120 (51.1)*** | 245 (37.3) |
| Stunting, n (%) | 142 (60.4)*** | 258 (39.3) |
| Type of presentation, n (%) | ||
| Classical | 180 (76.6)*** | 339 (51.7) |
| Non-classical | 41 (17.4) | 229 (34.9)*** |
| Asymptomatic | 14 (6) | 88 (13.4) |
| Early infant feeding details | ||
| Any breastfeeding, n (%) | 206 (88) | 616 (94)*** |
| Exclusive breastfeeding ≥6 months, n (%) | 166 (71) | 510 (78)*** |
| Total duration of breastfeeding (in months), mean±SD | 15.5±10.8 | 17.7±12.3** |
| Age of cereal introduction (in months), mean±SD | 8.6±4.1 | 8.3±4.4 |
| Haemoglobin (g/dl), mean±SD | 8.4±1.9*** | 9.1±1.9 |
| Serology, n (%) | ||
| TTGA*** | ||
| 2-5 ULN | 45 (19.1) | 64 (9.8) |
| 5-10 ULN | 32 (13.6) | 67 (10.2) |
| >10 ULN | 130 (55.3) | 463 (70.6) |
| Negative | 28 (12) | 62 (9.5) |
| EMA (n=494), n (%) | ||
| Positive | 120 (51.1) | 298 (45.4) |
| Negative | 18 (7.7) | 58 (8.8) |
| HPE (n=783), n (%) | ||
| Marsh 3 | 190 (86.4) | 491 (87.2) |
P *<0.05, **<0.01, ***<0.001. BMI, body mass index; EMA, endomysial antibody
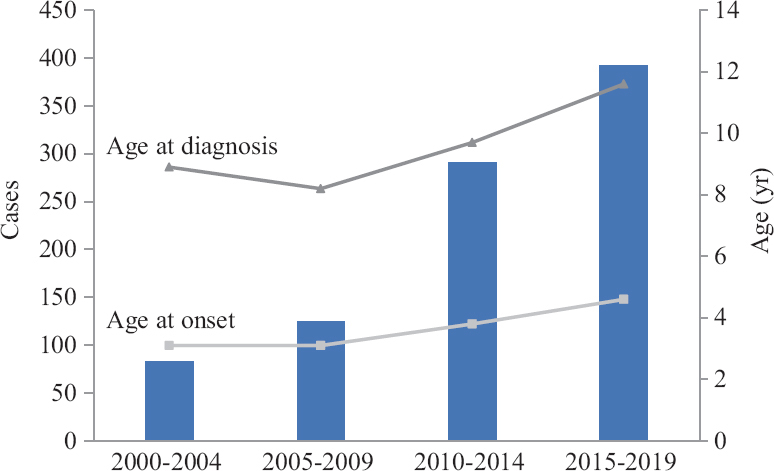
- Number of newly diagnosed cases and mean age at onset as well as at diagnosis of celiac disease in children according to the year groups.
Associated conditions: Thyroid disorders were seen in 76 (8.5%) children (22 at/before and 54 after the diagnosis of CD) and T1DM in 51 (5.7%) children (43 at/before and 8 after the diagnosis of CD). Of the 43 children who had T1DM at/before the diagnosis of CD, 21 children (48.8%) had Marsh 3 changes on biopsy. Nine children (1%) had IgA deficiency. A spectrum of liver involvement was seen in our cohort. Among this, elevated transaminases (>ULN) were the most common (51%) followed by autoimmune hepatitis (AIH 1%) and Budd-Chiari syndrome (0.3%).
GFD and follow up: Of the 891 children, details regarding GFD and compliance could be confirmed in 810 children. The mean (±SD) duration on GFD was 7.2±4.6 yr. Good and poor compliance to GFD was seen in 41.6 and 58.4 per cent, respectively. About 29 per cent reported the use of one or the other commercially available GFD products. After institution of GFD, symptoms subsided in all. Of the children who were stunted and underweight at diagnosis, 70.6 and 74.7 per cent recovered after one year of GFD, respectively irrespective of the compliance status. Similarly of those who were anaemic at diagnosis, 46 per cent showed increase in haemoglobin to normal levels after six months of GFD and another 45 per cent improved after one year of GFD irrespective of the compliance. A comparison of the characteristics with respect to compliance is summarized in Table IV. On follow up screening for associated autoimmune conditions, 54 (6.2%) children developed thyroid disorders (52 hypothyroid and 2 hyperthyroid) over a median duration of nine (6.7, 11) yr and eight children (0.9%) developed T1DM over a median duration of six (1.7, 10.5) yr after the initial diagnosis of CD.
| Characteristics | Good compliance (n=337) | Poor compliance (n=473) |
|---|---|---|
| Gender (boys), n (%) | 202 (60)** | 232 (49) |
| Type of CD, n (%) | ||
| Classical | 184 (54.6) | 287 (60.7) |
| Non-classical | 111 (33) | 135 (28.5) |
| Asymptomatic | 42 (12.4) | 51 (10.8) |
| Children who had stunting at diagnosis (n=337) | n=135 | n=202 |
| Recovery in height, n (%) | 106 (78.5)** | 132 (65.3) |
| Children who were underweight at diagnosis (n=365) | n=144 | n=221 |
| Recovery in weight, n (%) | 123 (85.4)*** | 150 (67.8) |
| Children who were anemic at diagnosis (n=655) | n=269 | n=386 |
| Improvement in haemoglobin, n (%) | 248 (92.2)*** | 265 (68.6) |
P **<0.01, ***<0.001. CD, Celiac disease
Discussion
The reported prevalence of paediatric CD in India ranges from one in 310 to one in 1004,6. Over the past few years, various studies across the globe reported a change in presentations of CD in children, from the classical form, which presents with diarrhoea, abdominal distension and growth failure to non-classical forms12,13. In a previous study from our centre7, 84 per cent of children had diarrhoea but this decreased to 58.2 per cent in the present study. A retrospective multicentre study of 1030 children by Tapsas et al14 reported an increase in mean age at diagnosis, milder clinical symptoms, more asymptomatic patients detected through screening and fewer patients with severe villous atrophy in the recent decades. Another questionnaire-based study of 559 children from Finland found that those who were diagnosed at ≥3 yr of age had more often gastrointestinal presentation, growth disturbances, severe symptoms and total villous atrophy15. We observed a similar trend towards increasing age at diagnosis and non-classical presentation as also observed by other studies14-17. While the classical form was the most common in those diagnosed before 2010, non-classical forms dominated in those diagnosed after 2010. Furthermore, children, of less than two year, presented predominantly with classical CD similar to the reports from previous studies15,16,18. A comparison between those diagnosed before two years of age (infant CD) and those diagnosed later (older onset CD) showed that the older children tended to present with non-classical forms of CD.
This changing trend of presentation over the years could be due to several reasons. Besides, increased awareness, the widespread availability of serological testing for CD such as TTGA and EMA has helped clinicians to detect clinically asymptomatic patients, those with a family history of celiac and at-risk groups like children with T1DM and autoimmune thyroid disorders.
The protective role of breastfeeding against CD is also debatable. Few randomized trials and a position paper by ESPGHAN in 2016 showed breastfeeding as unable to reduce the risk of CD in children19-22. However, other studies reported that increased duration of breastfeeding led to later age at diagnosis rather than complete prevention of CD23,24. Similarly, the age at gluten introduction was also shown to have an effect on the development of CD21,22,25. We found that those with infant CD had a significantly lower duration of breastfeeding and earlier introduction of gluten compared to those with older onset CD (P<0.05). Furthermore, we observed higher breastfeeding rates and higher duration of breastfeeding in those diagnosed after 2010 compared to those diagnosed before 2010. In addition to the increased awareness and use of serological tests, the changes in infant feeding practices over the years could have contributed to the changing spectrum of CD in our study group.
It is well known that children with CD are at increased risk of other autoimmune conditions, especially thyroid disorders and T1DM. The frequency of thyroid disorders after the diagnosis of CD ranges from 7.3 to nine per cent26,27 and that of T1DM from 0.5 to seven per cent28,29. There is limited literature on the subsequent development of thyroid disorders and T1DM in children with CD on GFD. A recent population based study by Canova et al27 reported a 4.6 times increased risk of subsequent hypothyroidism in children with CD. We observed that while 2.5 per cent had thyroid disorders at or before the diagnosis of CD, screening during follow up identified 54 (6.2%) children who developed thyroid disorder (52 hypothyroid, 2 hyperthyroid) over a median duration of nine (6.7, 11) year after initial diagnosis of CD. Of these 54 children, majority (72%) were poorly compliant to GFD. Similarly, while 4.8 per cent had T1DM at or before the diagnosis of CD, during follow up, eight children (0.9%), seven of whom were non-compliant developed T1DM. The most common liver abnormality in CD is the elevation of transaminases reported to the tune of 10-57 per cent across various studies and AIH in children with CD is reported in 1-2 per cent30-34. We had similar results in our study. We also had three children (0.3%) with Budd Chiari syndrome (BCS), which is a rare association with CD; the literature regarding this is restricted to few case reports35.
Despite the inherent limitation of being a retrospective study, our study elucidates the clinical presentations, associated conditions and trends in presentation over the years in a very large cohort of children and adolescents, from a single centre. Although a possible role of age at cereal introduction was observed in our study, quantification of the amount of cereal introduced was not done. Admittedly also, the value of TTGA as a good tool for assessing compliance has been recently questioned. However, short of availability of other parameters, such as urine or faecal gluten immunogenic peptides, we used the stringent criteria of >80 per cent TTGA records being negative, during follow up period, to differentiate good versus poor compliance. We observed that despite poor compliance to GFD, only a fraction of children (one-fourth) failed to recover from anaemia and regain their age-appropriate height/weight on follow up. Logically, some unexplored genetic and/or environmental factors probably determine why some children with CD tend to do better despite ongoing gluten consumption. However, we currently do not have data pertaining to these factors in the cohort studied. Another limitation in our study was the lack of HLA status, which might have given further insights into individual disease behaviour.
To conclude, in India, the presentation of CD in children is varied, with a trend towards non-classical forms in recent years, as seen in the West. Infants and young children are more likely to present with classical, whereas older children present with non-classical CDs. Age at cereal introduction and duration of breastfeeding may affect the future age at the diagnosis of CD and this aspect needs to be studied further. Normalization of growth can occur despite suboptimal compliance to GFD, but there is frequent occurrence of subsequent thyroid disorders and T1DM in non-compliant as compared to compliant children.
Financial support and sponsorship
None.
Conflicts of interest
A part of the findings of the study were presented as an abstract at the European Society for Paediatric Gastroenterology Hepatology and Nutrition, 2019 conference, Glasgow; UK.
Acknowledgments
Authors acknowledge late Prof Saroj Mehta, who conceived the Celiac Disease Clinic at PGIMER and the late Prof B. R. Thapa for their valuable inputs over the years.
References
- Indian task force for celiac disease: Current status. World J Gastroenterol. 2009;15:6028-33.
- [Google Scholar]
- Prevalence of Celiac disease among children in Finland. N Engl J Med. 2003;348:2517-24.
- [Google Scholar]
- An iceberg of childhood coeliac disease in the Netherlands. Lancet. 1999;353:813-4.
- [Google Scholar]
- Prevalence of celiac disease among school children in Punjab, North India. J Gastroenterol Hepatol. 2006;21:1622-5.
- [Google Scholar]
- Global prevalence of celiac disease: Systematic review and meta-analysis. Clin Gastroenterol Hepatol. 2018;16:823-36.e2.
- [Google Scholar]
- Prevalence of celiac disease in north Indian children. Indian Pediatr. 2009;46:415-7.
- [Google Scholar]
- Clinical features of celiac disease in Indian children: Are they different from the West? J Pediatr Gastroenterol Nutr. 2006;43:313-7.
- [Google Scholar]
- Revised criteria for diagnosis of coeliac disease. Report of Working Group of European Society of Paediatric Gastroenterology and Nutrition. Arch Dis Child. 1990;65:909-11.
- [Google Scholar]
- European Society for Pediatric Gastroenterology, Hepatology, and Nutrition guidelines for the diagnosis of coeliac disease. J Pediatr Gastroenterol Nutr. 2012;54:136-60.
- [Google Scholar]
- The histopathology of coeliac disease: Time for a standardized report scheme for pathologists. Eur J Gastroenterol Hepatol. 1999;11:1185-94.
- [Google Scholar]
- Clinical spectrum of paediatric coeliac disease: A 10-year single-centre experience. Eur J Pediatr. 2018;177:593-602.
- [Google Scholar]
- Changing pattern of childhood celiac disease epidemiology: Contributing factors. Front Pediatr. 2019;7:357.
- [Google Scholar]
- The clinical presentation of coeliac disease in 1030 Swedish children: Changing features over the past four decades. Dig Liver Dis. 2016;48:16-22.
- [Google Scholar]
- Clinical characteristics and long-term health in celiac disease patients diagnosed in early childhood: Large cohort study. Dig Liver Dis. 2020;52:1315-22.
- [Google Scholar]
- Increasing incidence and altered presentation in a population-based study of pediatric celiac disease in North America. J Pediatr Gastroenterol Nutr. 2017;65:432-7.
- [Google Scholar]
- Childhood coeliac disease diagnoses in Scotland 2009-2010: The SPSU project. Arch Dis Child. 2013;98:52-6.
- [Google Scholar]
- Spanish national registry of celiac disease: Incidence and clinical presentation. J Pediatr Gastroenterol Nutr. 2014;59:522-6.
- [Google Scholar]
- Introduction of gluten, HLA status, and the risk of celiac disease in children. N Engl J Med. 2014;371:1295-303.
- [Google Scholar]
- Randomized feeding intervention in infants at high risk for celiac disease. N Engl J Med. 2014;371:1304-15.
- [Google Scholar]
- Early feeding and risk of celiac disease in a prospective birth cohort. Pediatrics. 2013;132:e1202-9.
- [Google Scholar]
- Gluten introduction and the risk of coeliac disease: A Position Paper by the European Society for Pediatric Gastroenterology, Hepatology, and Nutrition. J Pediatr Gastroenterol Nutr. 2016;62:507-13.
- [Google Scholar]
- Does breast feeding protect against the development of clinical symptoms of celiac disease in children? J Pediatr Gastroenterol Nutr. 1983;2:428-33.
- [Google Scholar]
- Systematic review: Early infant feeding and the prevention of coeliac disease. Aliment Pharmacol Ther. 2012;36:607-18.
- [Google Scholar]
- Prevalence of autoimmune thyroiditis in children with celiac disease and effect of gluten withdrawal. J Pediatr. 2009;155:51-55. 55.e1
- [Google Scholar]
- Celiac disease and risk of autoimmune disorders: A population-based matched birth cohort study. J Pediatr. 2016;174:146-52.e1.
- [Google Scholar]
- Celiac disease and risk of subsequent type 1 diabetes: A general population cohort study of children and adolescents. Diabetes Care. 2006;29:2483-8.
- [Google Scholar]
- Celiac disease increases risk of thyroid disease in patients with type 1 diabetes: A nationwide cohort study. Diabetes Care. 2016;39:371-5.
- [Google Scholar]
- Changing epidemiology of liver involvement in children with celiac disease. J Pediatr Gastroenterol Nutr. 2019;68:547-51.
- [Google Scholar]
- Pediatric celiac disease, cryptogenic hypertransaminasemia, and autoimmune hepatitis. J Pediatr Gastroenterol Nutr. 2013;56:663-70.
- [Google Scholar]
- Hypertransaminasemia in newly diagnosed pediatric patients with celiac disease. J Pediatr Gastroenterol Nutr. 2016;63:340-3.
- [Google Scholar]
- Autoimmune liver diseases in a paediatric population with coeliac disease –A 10-year single-centre experience. Aliment Pharmacol Ther. 2010;31:253-60.
- [Google Scholar]
- Budd-Chiari syndrome associated with coeliac disease: Case report and literature review. Gastroenterol Rep (Oxf). 2018;6:308-12.
- [Google Scholar]


