
Translate this page into:
Economic evaluation of hepatitis A vaccines by income level of the country: A systematic review
For correspondence: Dr Montarat Thavorncharoensap, Faculty of Pharmacy, Mahidol University, 447 Sri Ayudhaya Road, Rajathevi, Phyathai, Bangkok 10400, Thailand e-mail: montarat.tha@mahidol.ac.th
-
Received: ,
This article was originally published by Wolters Kluwer - Medknow and was migrated to Scientific Scholar after the change of Publisher.
Abstract
Background & objectives:
Although several reviews of economic evaluation (EE) studies on hepatitis A virus (HAV) vaccine exist, there remains a need to corroborate such data from time to time. This study aimed to systematically review the literature for reports on EE of HAV vaccination by type of population, characteristics of intervention and income level of the country.
Methods:
PubMed and Scopus were searched to identify relevant studies from inception up to May 2021 using topic-specific key words in various combinaiton. Full EE studies comparing HAV vaccination to no vaccine or immunoglobulin were included. The risk of bias was assessed by using the ECOBIAS checklist.
Results:
Among the 1984 identified studies, 43 were found eligible. Of these, 27 were from high-income countries (HICs), 15 from middle-income countries (MICs), and one from low income country. Majority of the studies used Markov model and/or decision tree (n=26). Eight studies used a dynamic model. The discount rate, perspective and time horizon varied across the studies. Universal HAV vaccination without screening was cost-effective among children (14/16, 87.5%) and adolescents (1/5, 20%) but not in adults (0/4, 0%). Analysis by the level of income found that universal HAV vaccination among children without screening was cost-effective in 81.8 per cent of the studies conducted in MICs (9/11) as compared to 66.7 per cent in HICs (4/6). About one-third of the studies conducted among children found that screening and HAV vaccination were cost-effective compared to no vaccination.
Interpretation & conclusions:
The finding of this review suggest that universal vaccination of children without screening was likely to be cost-effective, especially in MICs. Nevertheless, it should be noted that the methodology varied across studies. Several aspects should also be considered in transferring the EE results across jurisdictions.
Keywords
Cost-effectiveness
economic evaluation
hepatitis A virus
vaccination
vaccine
systematic review

Hepatitis A is a liver disease caused by hepatitis A virus (HAV) infection, which belongs to the Picornaviridae family1. HAV is transmitted through the ingestion of contaminated food and water or even by close physical contact with an infected person2. Once a person gets infected with HAV, lifelong immunity develops3,4. A person with hepatitis A infection may have an asymptomatic state, or may develop symptoms such as fever, nausea or vomiting, abdominal discomfort, jaundice and acute liver failure. Nevertheless, it does not progress to chronic hepatitis2. Unlike hepatitis B and C, hepatitis A is rarely fatal2.
The World Health Organization (WHO) estimates have suggested an increase in the number of acute hepatitis A cases from 117 million in 1990 to 126 million in 2005 with increase in deaths due to hepatitis A from 30,283 (in 1990) to 35,245 (in 2005)5,6. A global seroprevalence study on hepatitis A estimates an intermediate or low, level of endemicity in middle-income countries (MICs) from Asia, Eastern Europe, Latin America and the Middle East6. On the other hand, high-income countries (HICs) generally have low levels of HAV endemicity7.
The severity of hepatitis A infection increases with age, leading to a higher rate of severe disease and death in adults2. In low-income countries (LICs), which usually have a high level of endemicity, nearly all children get infected at an early age and are usually asymptomatic2.
In regions with intermediate endemicity, improved sanitary conditions may lead to the accumulation of adults who have never been infected, hence, have no immunity. These individuals in older age groups, therefore, are at a high risk of symptomatic hepatitis A infection8. Recently, the increasing burden of hepatitis A disease is noted in the regions with intermediate endemicity; thus, the countries in these regions may benefit from new/expanded vaccination programmes8.
HAV vaccination is considered as an effective and safe method to prevent hepatitis A infection2. Worldwide, two types of HAV vaccines (formaldehyde inactivated and live attenuated vaccines) are available2. The WHO recommends HAV vaccination to be integrated into the national immunization schedule for children aged more than one year based on the incidence of hepatitis A, change in endemicity from high to intermediate and considering the cost-effectiveness of the vaccination strategy8.
Economic evaluation (EE) is the comparative analysis of two or more interventions in terms of their costs and consequences9. Three main types of EE methods are cost-effectiveness analysis (CEA), cost-utility analysis (CUA) and cost-benefit analysis (CBA)9. In CEA, cost of each intervention is measured against its effectiveness (e.g. cost per case prevented, cost per life year gained). For CUA, cost incurred in the intervention is measured against the common unit, called quality-adjusted life year (QALY) (e.g. cost per 1 QALY gained). One QALY means one year in full health. For CBA, both cost and consequences of an intervention are expressed in monetary units. Then, the net benefit can be calculated as the difference between cost and consequences9.
To compare the alternative intervention over a long timeframe, modelling techniques have been adopted. Modelling offers several advantages including extrapolation beyond data generated through a trial, synthesizing head-to-head comparisons wherever relevant and linking intermediate endpoint to final outcomes. The most common modelling approaches used in EE studies are decision tree and Markov model10. Unlike decision tree model, Markov model is suitable when timeframe is long, process of disease is complex and events may repeat10.
Evidence generated through EE is important to inform effective healthcare resource allocation. Nevertheless, the capacity to conduct economic studies in many countries is limited11. To date, three systematic reviews on EE of HAV vaccination have been published12–14. The most comprehensive study12 published in 2018 included four studies from MICs and 27 studies from HICs. Another systematic review included nine studies conducted in MICs, which were published till 201213. The other identified 11 EE studies, were published between 1995 and 201014. It should also be noted that methodological characteristics were not fully described in the previous reviews, making it challenging to assess the transferability of the results. Therefore, the aim of this study was to systematically review evidences on cost-effectiveness of hepatitis A vaccination along with epidemiologic parameters and methodological characteristics. Cost-effectiveness evidences were also summarized by the types of population, intervention and income level of the countries.
Material & Methods
This systematic review was conducted as per the Preferred Reporting Items for Systematic Reviews and Meta-analyses (PRISMA) guidelines15. The protocol for this review was registered with the International Prospective Register of Systematic Reviews (PROSPERO; CRD42018105279).
Search strategy: Relevant studies were identified from PubMed and Scopus database without language restriction from inception to May 31, 2021. For studies other than the English language, help of the language translator from Mahidol University, Bangkok, Thailand was sought. Reference lists of the included studies and previous systematic reviews12–14,16 were also screened. Search terms were constructed based on intervention (I), outcome (O) and study design (S). These were combined using Boolean operators ‘OR’, ‘AND’ for within the same and between the domains, respectively. Both keywords and MeSH terms were used. The full details of search terms and strategies are given in Supplementary Appendix I.
Selection criteria: Duplicate articles were removed by EndNoteX9 software [Camelot UK Bidco Lmtd. (Clarivate analysis), Bangalore, Karnataka, India]. Study selection was performed independently by two authors. Titles and abstracts were screened for potential eligibility. The following criteria were used for screening: (i) full EE comparing HAV vaccine (inactivated or attenuated) to no vaccine or immunoglobulin and, (ii) reported findings in terms of cost per case prevented or incremental cost-effectiveness ratio (ICER) or benefit-to-cost ratio. Studies were excluded if HAV vaccine was investigated in combination with other vaccines, animal studies or studies which reported only clinical effectiveness or disease burden or outbreak investigations or if their fulltext were unavailable. In addition, narrative reviews, systematic reviews, editorial publications, and conference proceedings were also excluded.
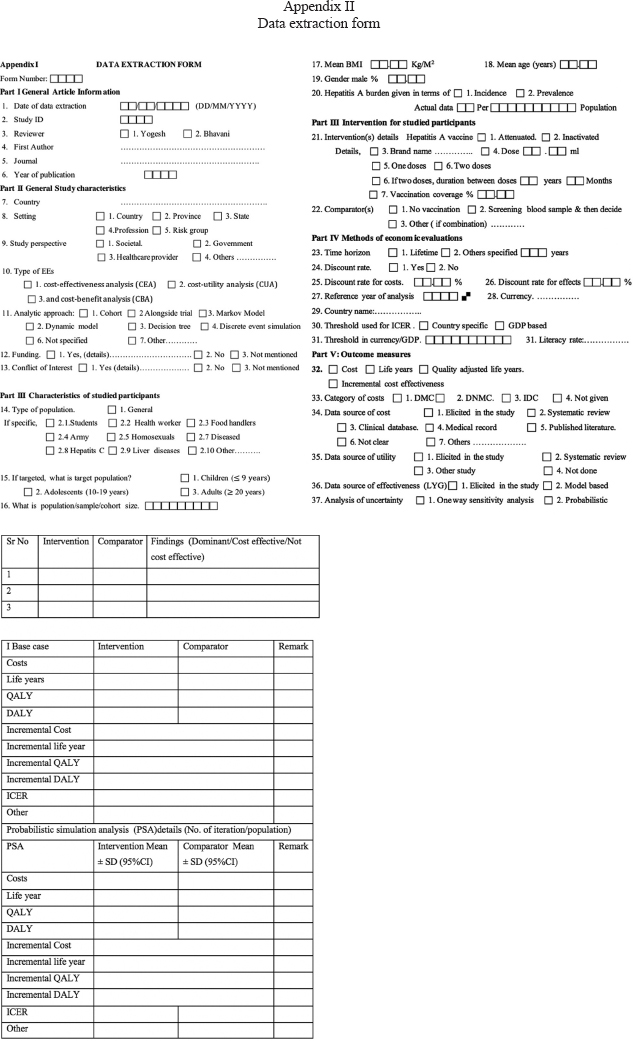
Data extraction and quality assessment: Data were extracted independently by two authors using a predesigned data extraction form (Supplementary Appendix II). Any disagreement was resolved by discussion and consensus with a third author. The data extracted included were study and population characteristics, vaccination and comparator details (i.e. vaccine efficacy, vaccination approach), epidemiological parameters (i.e. incidence of HAV), methodological details (i.e. perspective, time horizon, discounting and sensitivity analysis) and EE results.
Risk of bias assessment was performed using the ECOBIAS checklist, which was developed for assessing bias in EE studies17. This 22-item checklist consists of two parts. Part A is related to overall bias, while Part B focusses on model-specific aspects of bias. Results for each item were recorded as ‘yes’, ‘partly addressed’, ‘unclear’, ‘no’ and ‘not applicable’.
Statistical analysis: Descriptive synthesis and narrative summary of study characteristics, participants, interventions, methodology and EE findings were reported according to the income level of the country studied as per the World Bank Report18. Countries were also classified into regions according to the WHO19. According to the World Bank Report 2017, the world’s economies were classified into four income groups based on Gross National Income per capita (current US $) as: LICs (<1005 $), lower-middle-income countries (LMICs) (1006-3955 $), upper-middle income countries (3956-12,235 $) and HICs (>12,235 $)18.
Results
Search results and study characteristics: Of the 1984 studies identified, a total of 43 eligible studies (40 English language and 3 Chinese language) were included in this review. The PRISMA flow diagram for study selection is shown in the Figure with preferred reporting items (Supplementary Appendix III). Selected studies were from 17 different countries: Argentina (2)20,21, Belgium (3)22–24, Brazil (1)25, Canada (1)26 Chile (2)27,28, China (4)29–32, France (1)33, Germany (1)34, Indonesia (1)35, Israel (3)36–38, Jordan (1)39, Mexico (2)40,41, Netherlands (2)42,43, Spain (1)44, Thailand (2)45,46, United Kingdom (1)47, USA (15)25,48–61 and a multi-country study from developed countries62. One study25 was conducted in the USA and Brazil (Table I). Among these, the majority (27/43, 62.8%) were from HICs, followed by MICs (15/43, 34.9%) and LICs (1/43, 2.3%) (Table I).
| Study | Type of economic evaluation | Country classification | Country | Funding agency (name) | Population group | Time horizon (yr) | Discount rate of cost and effect (%) | Perspective | Type of model used (decision tree/Markov/dynamic) | Sensitivity analysis |
|---|---|---|---|---|---|---|---|---|---|---|
| Ramsay et al26, 2019 | CUA | HIC | Canada | No funding | Traveller | Life time | 1.5 | Healthcare provider | Markov | One-way and probabilistic |
| Luyten et al24, 2012 | CUA | HIC | Belgium | Health care (Belgium) | High-risk adult (traveller, healthcare workers, soldiers, teachers) | 100 | 3 | Societal | Markov | Probabilistic |
| Chapko et al50, 2010 | CUA | HIC | USA | Veternas affairs (USA) | Adults with hepatitis C | NS | 3 | Payer and private sector, veteran affairs | Decision tree and Markov | One-way |
| Armstrong et al49, 2007 | CUA | HIC | USA | NS | Children | 10 | 3 | Societal | NS | Not mentioned |
| Hankin-Wei et al60, 2016 | CUA | HIC | USA | Government | Children (2-17 yr) | Life time | 3 per cent | NS | Markov | One-way, probabilistic |
| Wilson et al59, 2020 | CEA | HIC | USA | NS | Adults | 20 | NS | Payer | Markov | One-way |
| Dhankhar et al61, 2015 | CEA | HIC | USA | No funding | Children | 100 | 3 | Societal | Dynamic | One-way and probabilistic |
| Ghildayal25, 2019 | CUA | HIC UMIC | USA Brazil | NS | All age group (general population) | 20 | 3 | Societal | Dynamic | One-way, two-way and three way |
| Rein et al57, 2007 | CEA/CUA | HIC | USA | NS | Children | Life time | 3 | Societal | Markov | One-way |
| Postma et al42, 2004 | CEA | HIC | Netherlands | NS | Children of ethnic minorities | NS | NS | Societal | NS | NS |
| Jacobs et al55, 2003 | CEA/CUA | HIC | USA | Pharma (GSK) | Children | Life time | 3 | Both societal and healthcare provider | Markov | One-way |
| Arguedas et al48, 2002 | CUA | HIC | USA | NS | Adults with hepatitis B | Life time | 3 | Societal | Markov | One-way and two-way |
| Chodick et al38, 2002 | CUA | HIC | Israel | Government (National Institute of Health Policy, Israel) | Physicians, Nurses, Paramedical | Life time | 3 | Healthcare provider | Decision tree and Markov | One-way |
| Jacobs et al54, 2000 | CEA | HIC | USA | Pharma (SKB) | Adolescent | NS | 3 | Both societal and healthcare provider | Decision tree | One-way |
| Jacobs et al52, 2002 | CEA | HIC | USA | Pharma (SKB) | Chronic hepatitis C adults 30 yr, 45 yr, 60 yr | NS | 3 | Both societal and health care provider | Markov | One-way |
| Chodick et al37, 2001 | CBA | HIC | Israel | Non-government organization (full bright) | Day-care persons | 20 | 5 | Societal | Markov | One-way |
| Diel et al34, 2001 | CEA | HIC | Germany | NS | Children, adolescents | 30 | 5 | Societal | Other | One-way |
| Ginsber et al36, 2001 | CBA | HIC | Israel | NS | Children | 45 | 4 | Both societal and health care provider | Other | One-way |
| Jacobs et al51, 2000 | CEA | HIC | USA | Pharma (SKB) | Food handlers | NS | 3 | Both societal and healthcare provider | Decision tree | One-way |
| Jacobs and Meyerhoff53, 1999 | CEA | HIC | USA | Pharma (SKB) | Homosexuals | Life time | 3 | Societal | Decision tree | One-way |
| O’Connor et al56, 1999 | CEA | HIC | USA | NS | Adults #x003E;50 yr | Life time | 3 | Societal | Markov | One-way and two-way |
| Buma et al43, 1998 | CEA and CBA | HIC | Netherland | NS | Military personals | NS | NS | NS | Decision tree with Markov | NS |
| Arnal et al44, 1997 | CEA | HIC | Spain | Government (Health Research Funds, Spain) | Children, adolescents, adults | NS | 6 | NS | Decision tree and Markov | One-way |
| Smith et al58, 1997 | CEA/CUA | HIC | USA | NS | Medical students | Life time | 5 | Societal | Markov | One-way |
| Severo et al33, 1995 | CEA | HIC | France | NS | Military personals, travellers, healthcare workers | 10 | 5 | Societal | Decision tree | One-way |
| Van Doorslaer et al23, 1994 | CEA | HIC | Belgium | NS | Travellers | 10 | 5 | NS | Decision tree | One-way |
| Jefferson et al47, 1994 | CEA and CBA | HIC | United Kingdom | NS | Army personals | 5 | 3 | NS | NS | NS |
| Tormans et al22, 1992 | CEA | HIC | Belgium | Pharma (SKB) | Travellers | 10 | 5 | NS | Decision tree | One-way |
| Hayajneh et al39, 2018 | CUA | UMIC | Jorden | Pharma industry (MSDC) | Children | 50 | 3 | Societal | Dynamic | Probabilistic and deterministic |
| Curran et al40, 2016 | CUA | UMIC | Mexico | Pharma industry (GSK) | All ages (general population) | 25 | 5 | Health care provider | Dynamic and decision tree | Other |
| Carlos et al41, 2016 | CUA | UMIC | Mexico | Pharma (GSK) | Children | 25 | 5 | Mexican public health system and societal | Dynamic and dicision tree | One-way, probabilistic |
| Pan et al32, 2012 | CUA | UMIC | China | University (Henan) | Children | NS | 3 | Both societal and health care provider | Decision tree and Markov | One-way |
| Quezada et al28, 2008 | CEA | UMIC | Chile | NS | Children | 100 | 3 | Both societal and healthcare provider | Dynamic | One-way |
| Ellis et al21, 2007 | CUA | UMIC | Argentina | Pharma (GSK) | Children | 50 | 3 | Societal | Markov | One-way |
| Lopez et al20, 2007 | CEA and CBA | UMIC | Argentina | NS | Children | 100 | 3 | Societal | Dynamic | One-way |
| Valenzuela et al27, 2005 | CUA | UMIC | Chile | Pharma (GSK) | Children | 50 | 3 | Both societal and healthcare provider | Markov | One-way |
| Das62, 1999 | CUA | UMIC | Developed countries | NS | Children | Life time | 3 | Societal | Decision tree with Markov | One-way and two-way |
| Suwantika et al35, 2014 | CUA | LMIC | Indonesia | NS | Children | 70 | 3 | Both societal and healthcare provider | Markov | One-way and probabilistic |
| Zhuang et al31, 2008 | CUA | LMIC | China | NS | Children | NS | 5 | Both societal and healthcare provider | Markov | Other |
| Soogarun and Wiwanitkit45 2002 | CBA | LMIC | Thailand | NS | Adolescent | NS | NS | NS | NS | NS |
| Teppakdee et al46, 2002 | CBA | LMIC | Thailand | NS | Children, adolescent, adults | NS | NS | NS | NS | NS |
| Chen et al30, 1999 | CBA | LMIC | China | NS | General population | 10 | NS | NS | NS | NS |
| Li et al29, 1998 | CUA | LIC | China | Government (Chines Medical Foundation) | General population | NS | NS | Societal | NS | NS |
CBA, cost benefit analysis; CDC, Centers for Disease Control; CEA, cost-effective analysis; CUA, cost utility analysis; GSK, GlaxoSmithKline Pharmaceuticals; HIC, high-income countries; LIC, low-income countries; LMIC, lower-middle-income countries; MSDC, Merck Sharp and Dohme Corp; NS, not specified; SKB, SmithKline Beecham pharmaceuticals; UMIC, upper-middle-income countries
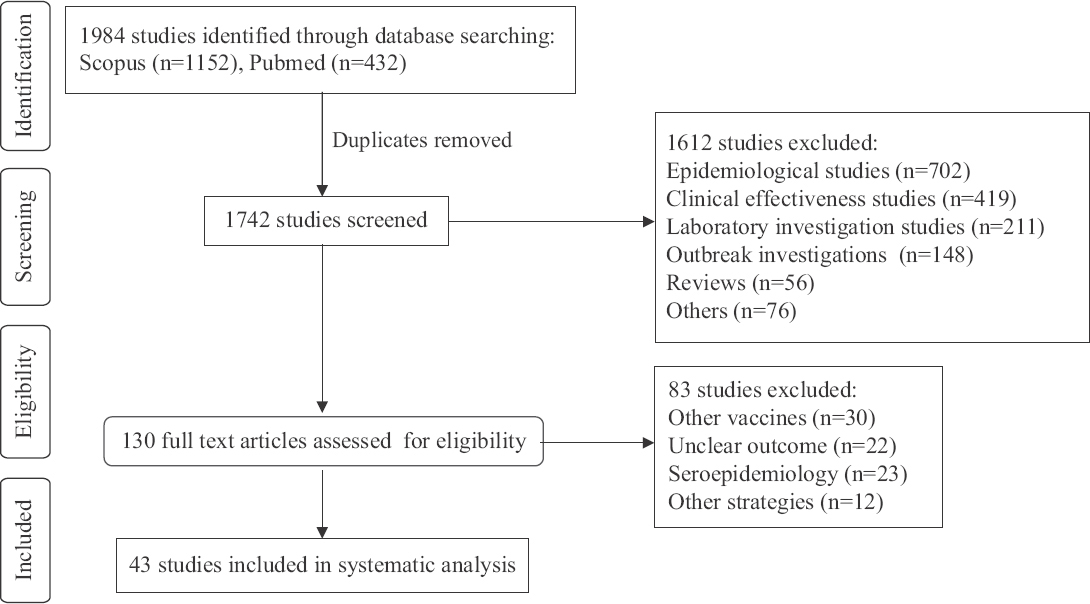
- PRISMA flow diagram for study selection.
As per the WHO regions, the majority of the studies were from America (21/43, 48.8%) followed by Europe (9/43, 20.9%), Eastern Mediterranean (4/43, 9.3%), Western Pacific (4/43, 9.3%) and South-East Asia (3/43, 7.0%). It was not possible to classify a multi-country study from developed countries (1/43, 2.3%). Four studies were published before the licensure of hepatitis A vaccine in 1995 (Table I).
In terms of population, 27 studies were conducted in the general population while 16 were conducted in the specific risk group populations. Of those conducted in the general population, 19, five and three focused on children, adolescents and adults, respectively. Studies conducted among specific risk group population included military personnel (n=4), travellers (n=5), medical students (n=1), healthcare workers (n=3), people with hepatitis B infection (n=1), people with hepatitis C infection (n=2), day-care personnel (n=1), food-handlers (n=1) and homosexuals (n=1) (Table I).
Type of EE studies were CUA (18/43, 41.9%), CEA (14/43, 32.6%), both CUA and CEA (3/43, 7%), CBA (5/43, 11.6%) and CBA and CEA (3/43, 7%). Most studies used Markov model (13/43, 30.2%) followed by Markov model with decision tree (6/43, 14.0%), decision tree (7/43, 16.3%), dynamic model (6/43, 14.0%) and decision tree with dynamic model (2/43, 4.7%) (Table I). Most studies adopted societal (28/43, 65%) and healthcare provider perspective (14/43, 33%). However, nine studies (21%) did not mention the perspective.
Vaccine intervention: The summary of vaccination parameters is reported in Table II. All studies used attenuated hepatitis A vaccine as an intervention. Ten studies disclosed the name of the manufacturer. Vaccine efficacy ranged from 87.3 to 100 per cent (Table II).
| Study | Hepatitis A | Vaccination approach | Vaccine type | Vaccine brand | Vaccine efficacy | Herd effect | Vaccine price/dose (currency) | Vaccination coverage | |
|---|---|---|---|---|---|---|---|---|---|
| Incidence per 100,000 population | Sero-prevalence (%) | ||||||||
| Ramsay et al26, 2019 | NS | 5 | Targeted | Inactivated | NS | 93.5 per cent | No | 45.5 (USD) | NS |
| Luyten et al24, 2012 | NS | 91-94 | Targeted | Inactivated | Havrix | 95 per cent | No | 46.7 (euro) | 95 per cent, 95 per cent (2-dose) |
| Chapko et al50, 2010 | 17.5-34.9 per 100,000 | NS | Targeted | Inactivated | Vaqta | 99 per cent | Yes | 24.9-58.2 (USD) | 64 per cent, 16 per cent (2-dose) |
| Armstrong et al49, 2007 | NS | NS | Universal | Inactivated | NS | NS | Yes | NS | NS |
| Hankin-Wei et al60, 2016 | NS | NS | Targeted | NS | NS | NS | No | No | 50 per cent |
| Wilson et al59, 2020 | NS | NS | Universal | Inactivated | NS | NS | No | NS | NS |
| Dhankhar et al61, 2015 | 1.8-8.9 per 100,000 | NS | Universal | NS | NS | 100 per cent | Yes | NS | 64.4 per cent |
| Ghildayal25, 2019 | 25-132 per 100,000 | NS | Universal | Inactivated | NS | 94 per cent | No | 17 (USD) 60 (USD) | 90 per cent, 77 per cent |
| Rein et al57, 2007 | 6.7-22.7 per 100,000 | NS | Universal | Inactivated | NS | 91-100 per cent | No | 55.5 (USD) | 93 per cent, 87 per cent (2-dose) |
| Postma et al42, 2004 | NS | NS | Targeted | Inactivated | Havrix | 90 per cent | No | 21 (euro) | NS |
| Jacobs et al55, 2003 | NS | 3 | Universal | Inactivated | NS | 98-99 per cent | No | 14.2 USD | 69 per cent, 20 per cent (2-dose) |
| Arguedas et al48, 2002 | NS | 34 | Targeted | Inactivated | NS | NS | No | NS | NS |
| Chodick et al38, 2002 | 21.7-87.6 per 100,000 | NS | Targeted | Inactivated | Havrix | 95 per cent | No | 35 (USD) | 90 per cent |
| Jacobs et al54, 2000 | NS | NS | Universal | Inactivated | NS | 94 per cent | Yes | NS | NS |
| Jacobs et al52, 2002 | 17.7-109 per 100,000 | NS | Targeted | Inactivated | NS | 93-95 per cent | No | 11.8 (USD) | 80 per cent |
| Chodick et al37, 2001 | 66.7-98.9 per 100,000 | NS | Targeted | Inactivated | Havrix | 95 per cent | No | 35 (USD) | 89 per cent |
| Diel et al34, 2001 | 7 per 100,000 | NS | Universal | Inactivated | NS | 99 per cent | No | 158 (DM) | 20-80 per cent |
| Ginsber et al36, 2001 | 54 per 100,000 | NS | Universal | Inactivated | Havrix | 94-95 per cent | Yes | 7.47 (USD) | 95 per cent, 92 per cent (2-dose) |
| Jacobs et al51, 2000 | 157 per 100,000 | NS | Targeted | Inactivated | NS | 93-95 per cent | No | 43 (USD) | 100 per cent, 50 per cent (2-dose) |
| Jacobs and Meyerhoff53 1999 | 210-1130 per 100,000 | NS | Targeted | Inactivated | Havrix | 90-95 per cent | No | 43 USD | 70 per cent |
| O’Connor et al56, 1999 | 5 per 100,000 | 63 | Universal | Inactivated | NS | 94-99 per cent | No | 57 (USD) | 100 per cent, 80 per cent (2-dose) |
| Buma et al43,1998 | 3.2-70.3 per 100,000 | NS | Targeted | Inactivated | NS | 95 per cent | No | 35 (USD) | 100 per cent |
| Arnal et al44, 1997 | NS | 0.1-4 | Universal | Inactivated | NS | 90 per cent | No | NS | 70 per cent |
| Smith et al58, 1997 | 9 per 100,000 | NS | Targeted | Inactivated | Havrix | 94 per cent | No | 40 (USD) | NS |
| Severo et al33, 1995 | 1.5-39.6 per 100,000 | NS | Targeted | Inactivated | Havrix | NS | No | 115 (FF) | 100 per cent |
| Van Doorslaer et al23, 1994 | NS | 20-45 | Targeted | Inactivated | NS | 90-99 per cent | No | 15 pound | 100 per cent |
| Jefferson et al47, 1994 | 21 per 100,000 | NS | Targeted | Inactivated | NS | NS | No | 11.7 (pounds) | 100 per cent |
| Tormans et al22, 1992 | NS | NS | Targeted | Inactivated | NS | 90 per cent | No | 24 (USD) | NS |
| Hayajneh et al39, 2018 | NS | NS | Universal | Inactivated | NS | 97-99 per cent | Yes | NS | NS |
| Curran et al40, 2016 | NS | NS | Universal | Inactivated | NS | 87.3-100 per cent | Yes | 10 (USD) | 95 per cent, 70 per cent (2-dose) |
| Carlos et al41, 2016 | NS | NS | Universal | Inactivated | Havrix | 97 per cent (1st dose), 99 per cent (2nd dose) | No | 194.5 MXN (per dose) | 80 per cent, 85 per cent (2nd dose) |
| Pan et al, 201232 | 15 per 100,000 | NS | Universal | Inactivated | NS | 90-100 per cent | No | 69 (USD) | 80 per cent (2-dose) |
| Quezada et al28, 2008 | NS | 92.3 | Universal | Inactivated | NS | 95 per cent | Yes | 11 (USD) | 95 per cent |
| Ellis et al21, 2007 | NS | 2-60 | Universal | Inactivated | NS | 98 per cent | No | 8.50 (USD) | 95 per cent, 80 per cent (2-dose) |
| Lopez et al20, 2007 | NS | NS | Universal | Inactivated | NS | 95 per cent | Yes | 7 (USD) | 95 per cent |
| Valenzuela et al27, 2005 | 10-90 per 100,000 | NS | Universal | Inactivated | NS | 96-99 per cent | Partially | 11 (USD) | 96 per cent |
| Das62,1999 | NS | 0.01 | Universal | Inactivated | Havrix | NS | No | 55.6 USD | 80 per cent |
| Suwantika et al35, 2014 | 11-81 per 100,000 | NS | Universal | Inactivated | NS | 93-95 per cent | No | 3.21 (USD) | 80 per cent |
| Zhuang et al31, 2008 | NS | 50-90 | Universal | Inactivated | NS | 93-95 per cent | No | 30 (RMB Yuan) | 80 per cent |
| Soogarun and Wiwanitkit45, 2002 | NS | 8 | Universal | Inactivated | NS | 98-100 per cent | No | 1430 (BHT) | NS |
| Teppakdee et al46, 2002 | 9.4-70 per 100,000 | NS | Universal | Inactivated | NS | 94-100 per cent | No | 920 (BHT) | 97 per cent |
| Chen et al30, 1999 | 10-101 per 1,000,000 | NS | Universal | Inactivated | NS | NS | No | 18 (RMB Yuan) | NS |
| Li et al,29 1998 | 17-93 per 100,000 | NS | Universal | Inactivated | NS | NS | No | NS | NS |
BHT, Baht from Thailand; DM, Deutsche Mark from Germany; Euro, European Euros; FF, French Franks; MXN, Mexican pesos; NS, not specified; ND, not done; RMB, RMB Yuan from China; USD, US dollar; Pound, UK Pound
Epidemiological parameters: As shown in Table II, the incidence of HAV was reported in about half of the studies (22/43), while the seroprevalence was reported in 12 studies. The incidence of HAV varied widely from 1.5 per 100,00033 to 1130 per 100,000 population53. The seroprevalence varied from 0.1-4 per cent44 to 91-94 per cent24. Only 10 studies considered herd immunity in the analysis20,27,28,36,39,40,49,50,54,61.
Risk of bias assessment: The risk of bias assessment for this study is shown in Supplemantary Appendix IV. All included studies had adequate comparators. Only 23.3 per cent (10/43) of the studies adopted a lifetime horizon, while 27.9 per cent (12/43) did not specify a time horizon. In terms of perspective, only 67.4 per cent (29/43) adopted a societal perspective, while about 16.3 per cent (7/43) did not specify the perspective. The discounting rate was not specified in 18.8 per cent of the studies (8/43). Of the 20 studies that disclosed funding sources, 11 were funded by pharmaceutical companies. Eight studies were subjected to risk of bias related to sensitivity analysis. One-way sensitivity analysis was adopted in 72.1 per cent (31/43) of the studies, while probabilistic sensitivity analysis was conducted in only 16.3 per cent (7/43) of the studies. Among CUA studies, 85.7 per cent (18/21) had a partial risk of bias related to quality of life weight. Eleven studies (25.6%) had an unclear risk of double-counting biases. Double-counting occurred when a parameter was counted more than once. It usually occurs in CUA, when consequences of an intervention (i.e. productivity loss/time loss) get incorporated on the cost side (numerator) as well as on the consequences side, i.e. QALY (denominator). All studies in this review had an unclear risk of biases related to internal consistency.
Cost-effectiveness findings: These are summarized in Table III. Summary of cost-effectiveness results by income level of the country, type of population and vaccination strategies is shown in Table IV.
| Study | Intervention versus comparator | Currency, yr | Threshold | ICER from base case with perspective | Conclusion | |
|---|---|---|---|---|---|---|
| Health care | Societal | |||||
| Ramsay et al26, 2019 | Two doses versus no vaccination (Status Quo) | Canadian $, 2017 | $50,000 | $ 3,391,504 per QALY | ND | Expanded vaccination for traveller was not cost-effective |
| Luyten et al24, 2012 | Two dose vaccination versus no vaccination Screening and vaccination versus no vaccination Two dose versus screening and vaccination |
€, 2008 | €50,000 | € 203,454 per QALY € 231,227 per LYs € 2,048,623 per QALY € 282,041 per LYs € 103,649 per QALY € 117,651 per LYs |
€ 192,338 per QALY € 218,580 per LYs € 237,507 per QALY € 269,394 per LYs € 92,533 per QALY € 110,462 per LYs |
Expanded vaccination strategies to adult traveller were not cost-effective for all three strategies |
| Chapko et al50, 2010 | Screening and vaccination versus no vaccination | $, 2006 | $100,000 | $ 82,022 per QALY (private sector cost) $ 184,088 per QALY (veterans affairs cost) | ND | Not cost-effective |
| Armstrong et al49, 2007 | Vaccination versus no vaccination | $, 2005 | GDP per capita | ND | $ 1000 per QALY saved $ -29,000 per Lys saved |
Cost-effective |
| Hankin-Wei et al60, 2016 | Catch up versus no catch up vaccination | $, 2015 | $50,000 | ND | $ 189,000 per QALY gained at age 12 yr | Catch up vaccination campaign was not cost-effective, given low incidence |
| Wilson et al59 2020 | Vaccination versus no vaccination | $, NS | $50,000 | $ 1,208,660 per LYs | ND | Not cost-effective |
| Dhankhar et al61, 2015 | Regional versus universal | $, NS | GDP per capita | ND | $ 21,223 per QALY | Cost saving |
| Ghildayal25, 2019 | Vaccination versus no vaccination | $, NS | $100,000 | $ 55,778.5 per QALY saved for USA $ 8193.6 per QALY saved for Rio de Janerio | ND | Cost-effective |
| Rein et al57, 2007 | Two doses versus no vaccination | $, 2005 | GDP per capita | ND | $ 28,000 per QALY $ 199,000 per LYs |
Cost-saving |
| Postma et al42, 2004 | Vaccination versus no vaccination | €, 1999 | GDP per capita | ND | € 13,500 per averted HAV infection | Not cost saving |
| Jacobs et al55, 2003 | Two doses versus no vaccination | $, 2002 | GDP per capita | $ 9100 per QALY gained $ 14,100 per LYs saved |
$ 1400 per QALY gained $ 2200 per LYs saved |
Cost-effective |
| Arguedas et al48, 2002 | Screen and vaccinate versus no vaccination Universal vaccination versus screening and vaccination |
$, 1999 | GDP per capita | ND | $ 51,000 per QALY $ 3,900,000 per QALY |
Cost-effective |
| Chodick et al38, 2002 | Vaccination versus no vaccination | $, 2001 | $60,000 | ND | $ 318,418 per QALY (physicians); $ 717,056 per QALY (nurses); $323, 283 per QALY (paramedical staff) | Selective vaccination is cost-effective |
| Screening and vaccinate (selective vaccination) versus no vaccination | $ 39,619 per QALY (physicians); $ 70,531 per QALY (nurses); $50,166 per QALY (paramedical staff) | |||||
| Jacobs et al54, 2000 | Vaccination versus no vaccination | $, 1997 | GDP per capita | $ 13,722 per YOLS | #x003C;0 per YOLS | Cost-effective |
| Jacobs et al52, 2002 | Vaccination versus no vaccination | $, 2000 | GDP per capita | $ 22,266 per LY saved (age 30 yr); $50,391 per LY saved (age 45 yr); $ 102,064 per LY saved (age 60 yr) | ND | Cost-effective at younger age (30 and 45 yr) |
| Chodick et al37, 2001 | Screening and vaccination versus immunoglobulins Vaccination versus immunoglobulins |
$, 2000 | GDP per capita | ND | 1.50 benefit to cost ratio 0.04 benefit to cost ratio |
Selective vaccination is cost-effective |
| Diel et al34, 2001 | Vaccination versus no vaccination | DM, 1998 | GDP per capita | ND | 53,052 DM per case averted for children 83,247 DM per case averted for adolescent | Not cost effective among children and adolescent |
| Ginsber et al36, 2001 | Vaccination versus no vaccination | $, 1997 | GDP per capita | ND | 2.54:1 benefit to cost ratio | Cost-effective |
| Jacobs et al51, 2000 | Vaccination versus no vaccination | $, 1997 | GDP per capita | ND | $ 13,969 per LYs saved | Cost-effective |
| Jacobs and Meyerhoff53 1999 | Vaccination versus no vaccination | $, 1997 | GDP per capita | ND | −213 yr of life lost and ratio of cost reduction to vaccination is 10.72:1 | Cost-effective |
| O’Connor et al56, 1999 | Vaccination versus no vaccination Screening and vaccination versus no vaccination | $, 1997 | GDP per capita | ND | $ 20,119,000 per extra LY $ 230,113 per extra LYs | Not cost-effective for both strategies |
| Buma et al43, 1998 | Vaccination versus no vaccination Immunoglobulin versus no vaccination Screening and vaccination versus no vaccination Mass vaccination versus no vaccination |
$, 1998 | GDP per capita | ND | Cost saving $295 Cost saving | Cost-saving with two or more missions per 10 yr in all interventions Vaccination without prior screening was the most optimum strategy |
| Arnal et al44, 1997 | Immunoglobulins versus no vaccination | ECU, 1994 | GDP per capita | ND | Cost per prevented infection ECU 6394 (children), ECU 6394 (adolescent) | |
| Screening and vaccination versus no vaccination | Cost per prevented infection ECU 18,863 (adolescent), ECU 9169 (young adults), 3696 (adults) Cost per prevented infection ECU 6701 (adolescent), ECU 2264 (young adults), 2986 (adults) |
All strategies were not cost-effective among children, adolescents and adults | ||||
| Smith et al58, 1997 | Vaccination versus no vaccination Screening and vaccination versus no vaccination Vaccination versus no vaccination |
$, 1994 | GDP per capita | ND | $ 22,000 for case prevented, $ 58,000 per LY saved and $ 47,000 per QALY saved $ 34,000 per case prevented $ 92,000 per LY save, $ 75,000 per QALY saved Cost saving 4.72 million FF (military staff); 278,263 FF cost per case avoided travellers); 107,910 FF per case avoided (hospital worker) |
Routine vaccination was cost-saving. Screening versus vaccination was not cost-effective |
| Severo et al33, 1995 | Immunoglobulins versus no vaccination | FF, 1993 | GDP per capita | ND | Cost saving of - 2.89 million FF (military staff) | Both systemic and selective vaccination is cost-effective among military personals |
| Screening and vaccination (selective) versus no vaccination | Cost saving 4.17 millions FF (military staff); 174,412 FF cost per case avoided (travellers); 59,303 FF per case avoided (hospital worker) | |||||
| Van Doorslaer et al23, 1994 | Vaccination/versus no vaccination | £, 1994 | GDP per capita | ND | £ 4705-£ 556 per infection prevented by Havrix 720 and Havrix 1440 | Cost-effective among passive immunization |
| Immunoglobulins versus no vaccination | £ 304 per infection prevented | |||||
| Screening and vaccination versus no vaccination | £ 470-£ 551 per infection prevented for Havrix 720 and Havrix 1440 | |||||
| Jefferson et al47, 1994 | Vaccination versus no vaccination | £, 1994 | GDP per capita | ND | Cost benefit ratio=7.2 (vaccine) | Vaccination is cost-effective |
| Immunoglobulins versus no vaccination | Cost benefit ration=13.4 (immunoglobulin) | |||||
| Tormans et al22, 1992 | Vaccination (three doses) no vaccination | $, 1992 | GDP per capita | ND | $ 4880 per case prevented | Vaccination cost-effective, Screening and vaccination more cost-effective, immunoglobulin not cost-effective |
| Immunoglobulins versus no vaccination | $ 29,932 per case prevented | |||||
| Screening and vaccination versus no vaccination | $ 5621 per case prevented | |||||
| Hayajneh et al39, 2018 | Vaccination versus no vaccination | $, 2015 | GDP per capita | ND | $ 37,502 per QALY gained | Cost-effective |
| Curran et al40, 2016 | Vaccination versus no vaccination | MXN, 2012 | GDP per capita | ND | MXN -2198 per QALY for single dose MXN -14,829 per QALY for two doses | Cost-effective in single dose vaccination |
| Carlos et al41, 2016 | Two doses versus no vaccination One dose versus no vaccination | MXN, 2012 | 1 GDP (132, 465 MXN) | 2270 MXN per QALY 14,961 MXN per QALY | Dominant 3752 MXN per QALY | Routine vaccination among infants either with one dose or two doses was cost-effective |
| Pan et al32, 2012 | Vaccination versus no vaccination | RMB Yuan, 2009 | GDP per capita | RMB Yuan 4,560,814 cost per case saved | RMB Yuan 5,840,430 cost per case saved | Cost-effective |
| Quezada et al28, 2008 | Vaccination versus no vaccination | $, 2009 | GDP per capita | ND | $ 4984 per LYs gained; $ 18,665,808 incremental cost | Cost-effective |
| Ellis et al21, 2007 | Vaccination (one dose) versus no vaccination | $, 2004 | GDP per capita | ND | $ 2481 per lost QALY for birth cohort vaccination $ 2402 per lost QALY for personal contact vaccination | Most cost-effective |
| Vaccination (two dose) versus one dose vaccination | ND | $ 1137 per lost QALY for birth cohort vaccination $ 1150 per lost QALY for personal contact vaccination | Cost-effective | |||
| Lopez et al20, 2007 | Vaccination versus no vaccination | $, 2004 | GDP per capita | ND | $ 3429 per LY gained | Cost-effective |
| Valenzuela et al27, 2005 | Vaccination [two doses (18-54 months)] versus no vaccination | $, 2004 | GDP per capita | $ 460 per LY saved $ 281 per QALY gained | #x003C;0 per LY saved #x003C;0 per QALY gained | Cost-effective |
| Vaccination [two doses (18 and 24 months)] versus no vaccination | 882 per LY saved $ 503 per QALY gained | #x003C;0 per LY saved #x003C;0 per QALY gained | ||||
| Das62, 1999 | Vaccination versus no vaccination Screening and vaccination versus no vaccination |
$, 1999 | GDP per capita | ND | 12,833 marginal cost-effectiveness ratio 7267 marginal cost effectiveness ratio |
Screening of vaccination is cost-effective |
| Suwantika et al35, 2014 | Vaccination (one dose) versus no vaccination | $, 2014 | GDP per capita | $ 5025 per QALY gained | $ 4933 per QALY gained | One dose vaccination is cost-effective |
| Vaccination (two dose) versus one dose vaccination | $ 7510 per QALY gained | $ 7421 per QALY gained | ||||
| Zhuang et al31, 2008 | Vaccination (two dose) versus no vaccination | RMB Yuan, 2005 | GDP per capita | RMB Yuan 1673 per QALY gained RMB Yuan 21,955 per LY gained | RMB Yuan -2268 per QALY gained RMB Yuan -29,764 per LY gained | Cost-effective |
| Soogarun and Wiwanitkit45 2002 | Vaccination (two dose) no vaccination Screening and vaccination versus no vaccination |
Baht, 2002 | NS | ND | BHT -2866 total cost BHT -3149 total cost |
Both strategies were not cost-effective |
| Teppakdee et al46, 2002 | Vaccination versus no vaccination Screening and vaccination versus no vaccination |
Baht, 2002 | NS | ND | BHT -1258 benefits in children. BHT -1325 in adolescents and BHT -3255 in adults BHT -1967 benefits in children. BHT -1871 in adolescents and BHT -1732 in adults |
Both strategies were not cost-effective among children, adolescent and adults |
| Chen et al30, 1999 | Vaccination/screening and vaccination versus no vaccination Vaccination/screening and vaccination versus no vaccination |
RMB Yuan, 1999 | GDP per capita | ND | 2.13 (cost benefit ratio) NS |
Most cost-effective among screening and vaccination than only vaccination |
| Li et al29, 1998 | Vaccination versus no vaccination | RMB Yuan 1998 | GDP per capita | ND | 153,277 RMB Yuan per QALY | Cost-effective |
*Study conducted in developed and developing country.BHT, Baht from Thailand; DM, Deutsche Mark from Germany; ECU, European currency unit; €, Euros; FF, French Franks; MXN, Mexican pesos; NS, not specified; ND, not done; RMB, Yuan from China; $, US dollar; £, UK Pound; YOLS, year of life saved; GDP, gross domestic product; QALY, quality-adjusted life year
| Variables (n=number of studies) | Cost-effective findings; number of cost effective studies/number of studies, n (%) | ||
|---|---|---|---|
| High income (n=27) | Middle income (n=15) | Low income (n=1) | |
| Universal vaccination (n=26) | 7/10 (70.0) | 13/15 (86.7) | 1/1 (100.0) |
| Children (n=19) | 6/8 (75.0) | 11/11 (100.0) | 0 |
| Vaccination vs. no vaccination (n=19) | 5/7 (71.4) | 10/12 (83.3) | 0 |
| Screening and vaccination vs. no vaccination (n=3) | 0/1 (0) | 1/2 (50.0) | 0 |
| Adolescents (n=5) | 1/3 (33.3) | 0/2 (0) | 0 |
| Vaccination vs. no vaccination (n=5) | 1/3 (33.3) | 0/2 (0) | 0 |
| Screening and vaccination vs. no vaccination (n=3) | 0/1 (0) | 0/2 (0) | 0 |
| Adult (n=4) | 1/3 (33.3) | 0/1 (0) | 0 |
| Vaccination vs. no vaccination (n=4) | 0/3 (0) | 0/1 (0) | 0 |
| Screening and vaccination vs. no vaccination (n=2) | 0/1 (0) | 0/1 (0) | 0 |
| Immunoglobulins vs. no vaccination (n=1) | 1/1 (100.0) | 0 | 0 |
| General population (n=4) | 1/1 (100.0) | 2/2 (100.0) | 1/1 (100.0) |
| Vaccination vs. no vaccination (n=4) | 1/1 (100.0) | 1/2 (50.0) | 1/1 (100.0) |
| Screening and vaccination vs. no vaccination (n=1) | 0 | 1/1 (100.0) | 0 |
| Targeted vaccination (n=17) | 13/17 (76.5) | 0 | 0 |
| Traveller (n=5) | 3/5 (60.0) | 0 | 0 |
| Vaccination vs. no vaccination (n=5) | 2/5 (40.0) | 0 | 0 |
| Screening and vaccination vs. no vaccination (n=4) | 2/4 (50.0) | 0 | 0 |
| Vaccination vs. screening and vaccination (n=1) | 0/1 (0) | 0 | 0 |
| Passive immunization vs. no vaccination (n=3) | 2/3 (66.7) | 0 | 0 |
| Health care staff (n=3) | 1/3 (33.3) | 0 | 0 |
| Vaccination vs. no vaccination (n=3) | 1/3 (33.3) | 0 | 0 |
| Screening and vaccination vs. no vaccination (n=2) | 1/2 (50.0) | 0 | 0 |
| Vaccination vs. screening and vaccination (n=1) | 0/1 (0) | 0 | 0 |
| Military (n=4) | 3/4 (75.0) | 0 | 0 |
| Vaccination vs. no vaccination (n=4) | 3/4 (75.0) | 0 | 0 |
| Vaccination vs. screening and vaccination (n=1) | 0/1 (0) | 0 | 0 |
| Screening and vaccination vs. no vaccination (n=3) | 2/3 (66.7) | 0 | 0 |
| Immunoglobulins vs. no vaccination (n=3) | 2/3 (66.7) | 0 | 0 |
| HCV adults (n=2) | 1/2 (50.0) | 0 | 0 |
| Vaccination vs. no vaccination (n=1) | 1/1 (100.0) | 0 | 0 |
| Screening and vaccination vs. no vaccination (n=1) | 0/1 (0) | 0 | 0 |
| Students (n=2) | 1/2 (50.0) | 0 | 0 |
| Vaccination vs. no vaccination (n=1) | 1/1 (100.0) | 0 | 0 |
| Screening and vaccination vs. no vaccination (n=1) | 0/1 (0) | 0 | 0 |
| Children of ethnic minority (n=1) | 0/1 (0) | 0 | 0 |
| Vaccination vs. no vaccination (n=1) | 0/1 (0) | 0 | 0 |
| Day care workers (n=1) | 1/1 (100.0) | 0 | 0 |
| Immunoglobulin vs. no vaccination (n=1) | 1/1 (100.0) | 0 | 0 |
| Selective vaccination vs. immunoglobulins (n=1) | 0/1 (0) | 0 | 0 |
| Food handlers (n=1) | 1/1 (100.0) | 0 | 0 |
| Vaccination vs. no vaccination (n=1) | 1/1 (100.0) | 0 | 0 |
| Homosexuals (n=1) | 1/1 (100.0) | 0 | 0 |
| Vaccination vs. no vaccination (n=1) | 1/1 (100.0) | 0 | 0 |
| HBV adults (n=1) | 1/1 (100.0) | 0 | 0 |
| Universal vaccination vs. screening and vaccination (n=1) | 1/1 (100.0) | 0 | 0 |
| Screening and vaccination vs.no vaccination (n=1) | 1/1 (100.0) | 0 | 0 |
| Children (n=1) | |||
| Catch up vaccine vs. no catch up vaccine (n=1) | 1/1 (100.0) | 0 | 0 |
HCV, hepatitis C virus; HBV, hepatitis B virus
For universal vaccination strategy, 70 (7/10), 86.7 (13/15) and 100 per cent (1/1) of the studies conducted respectively, in HICs, MICs and LICs were found to be cost-effective. When examining the types of population, universal vaccination among children was more likely to be cost-effective than the other age groups. About 63 per cent (17/27) of the studies conducted in HICs found that universal vaccination more cost-effective as compared to no vaccination, i.e. 86.7 per cent (13/15) in MICs in contrast to the adult population where, universal vaccination was not found to be cost-effective in both HICs (0/3) and MICs (0/1). Only 50 per cent (1/2) of the studies, comparing screening and vaccination to no vaccination among children in MICs, were found to be cost-effective. On the other hand, screening and vaccination among children in HICs were not cost-effective (0/1).
Hepatitis A vaccine was proven to be cost-effective as compared to no immunization among hepatitis C virus patients, food handlers and the homosexual population in studies conducted in high-income nations that used a targeted vaccination strategy. The results from travellers, healthcare staff and military personnel were mixed. In studies comparing the cost-effectiveness of vaccines vs. no vaccine among travellers, healthcare workers and military people, 40, 33 and 75 per cent were shown to be cost-effective, respectively. In studies comparing screening and vaccination versus no vaccination, 50, 50 and 66.7 per cent were found to be cost-effective among the same categories, respectively (Table IV).
Discussion
The present study revealed that universal hepatitis A vaccination without screening among children, especially in MICs, was more likely to be cost-effective than no vaccine strategy. This finding was consistent with that of earlier studies12,14. This might probably be due to the fact that countries such as Argentina20, Brazil25, Chile28, China30–32, and Indonesia35 have intermediate endemicity. Only half of the studies with data from MICs found that screening and vaccination among children were cost-effective. However, only two such studies were identified in this review. Because of the high seroprevalence of HAV infection among children in MICs, the cost-effectiveness of screening and immunisation was less favoured. In both HICs and MICs, universal hepatitis A vaccination among adults either with or without screening was less likely to be cost-effective. Consistent findings as that was seen in the previous study12, cost-effectiveness evidences among specific risk group populations varied widely depending on the risk of HAV infectivity. It was found that among people with greater risk of acquiring an infection due to a particular occupation or lifestyle, hepatitis A vaccination was found to be economically attractive22,23,43,44,51–53,63,64.
Vaccine considered in the analysis, it should be noted that all studies used inactivated hepatitis A vaccine. However, live-attenuated hepatitis A vaccine has been developed in China since 200765. The vaccine is mainly marketed in China and India65. It was shown to have similar efficacy to that of inactivated vaccine66, but only one dose was required. With the assumption of similar price per dose and similar efficacy, cost-effectiveness evidence would likely favour live-attenuated vaccine.
The present review found that the most common biases identified were related to internal inconsistency in terms of methodological quality. This is similar to other studies67,68, which found that mathematical logic was not evaluated in most of the investigations. Although experts generally recommend using societal perspective, as it is more comprehensive69, a societal perspective was adopted only in 68 per cent of the studies; hence, the direct non-medical cost was not included in the analysis. In addition, we found that only 23 per cent of the studies adopted lifetime horizons. Furthermore, probabilistic sensitivity analysis was rarely conducted.
It should be noted that most of the studies did not use a dynamic model. Furthermore, herd immunity was not taken into account. In fact, a dynamic model was a necessity in deciding on implementing realistic universal vaccination strategies70. However, due to the unavailability of large epidemiological parameters in a local context, complex study design and lack of expertise, the dynamic models were not used widely by researchers. In addition, it should be noted that when herd immunity is not taken into account, cost-effectiveness evidences of vaccine may be underestimated.
Our review found that most included studies had partial bias related to quality of life weight. This was because most of the studies used secondary data with limited information on the methods used to estimate utility weight, as well as characteristics of the sample. In addition, data on utility weights for symptomatic and asymptomatic hepatitis A infection were limited.
It should be noted that cost-effectiveness studies need to be conducted using locally available epidemiological data as such data from other settings have low transferability13. Although the age-specific incidence of hepatitis A infection had a significant impact on cost-effectiveness finding12, we found that many included studies20,21,27,28,31 adopted such data from the US study54,55,71. However, it was suggested that if the hepatitis A incidence data were not available, seroprevalence data of the country could be used to estimate the incidence71,72. In the absence of local data, it is recommended that data from countries with similar endemicity may be used cautiously73. On the other hand, some parameters could be adopted from other countries or other studies. As the natural history of hepatitis A infection is similar across the countries, the probability of symptomatic infection (presented with jaundice) among infected individuals may be transferable from other studies13. Since the efficacy of HAV vaccination was not affected by ethnicity variation, vaccine efficacy data could be adopted from other studies.
In terms of study perspective, most of the studies with societal perspective indicated that HAV vaccination was cost-effective. Studies with societal perspectives, in which HAV vaccination was not found to be cost-effective, were conducted in HICs24,34,42,56,58. For the studies that used both societal perspective and healthcare provider perspective, the results from societal perspective were more favourable towards cost-effectiveness or even cost-saving.
The present systematic review could not identify any EE study on HAV conducted in India. India is considered as a LMIC with wide variation in terms of socio-economic status. Due to rapid improvement in sociodemographic development in India during the past decade, there is evidence of a shift from high to intermediate endemicity, especially in the high-income region. In such region, with the decreasing number of adolescents with prior exposure to HAV, several hepatitis A outbreaks have been reported74–76. According to our review, almost all studies conducted among children in MICs, which were also facing improvement in sociodemographic development, found that HAV vaccination was cost-effective. Therefore, it is likely that HAV vaccination would be cost-effective in India, especially in the regions with reported shift from high to intermediate endemicity. In these regions, policymakers working on HAV vaccination may consider inclusion of HAV vaccination in public insurance schemes.
In summary, our study provides updated cost-effectiveness evidences of hepatitis A vaccination. Based on the existing evidence, we found that universal vaccination among children was more likely to be cost-effective, especially in MICs. Nevertheless, our study had some limitations. First, evidences on LICs and live-attenuated vaccines were limited. Second, as the presented ICERs varied by type of currency, year of valuation and types of outcome, direct comparisons could not be made. Third, most studies had partial biases on both epidemiological parameters and quality of life weights; therefore, further studies that aim to estimate such parameters are warranted to ensure the accuracy of cost-effectiveness evidences. Finally, transferability of the cost-effectiveness findings of hepatitis A vaccine should be made after careful consideration of epidemiological parameters, resource utilization, unit cost data, as well as structure of healthcare delivery system, and country-level income.
Acknowledgment:
Authors acknowledge Ms Zhijuan He, Mahidol University, Bangkok, Thailand, for the translation of Chinese papers in the English language.
Financial support & sponsorship: Authors YKG and BSB received financial support through the long term fellowship (R.12011/05/2017-HR) in foreign institute provided by Department of Health Research, Ministry of Health and Family Welfare, Government of India. Authors YKG and BSB received the scholarship from International Decision Support Initiative (www.idsihealth.org), through the training course in Health Technology Assessment’s Master degree at Mahidol University. iDSI received funding support from the Bill and Melinda Gates Foundation, the UK Department for International Development and the Rockefeller Foundation.
Conflicts of Interest: None.
References
- Hepatitis A virus. In: Fields BN, Knipe DM, Howley PM, eds. Fields virology (3rd ed). Philadelphia: Lippincott-Raven; 1996. p. :735-82.
- [Google Scholar]
- World Health Organization Hepatitis A:2018. Available from: http://who.int/mediacentre/factsheets/fs328/en/
- World Health Organization. Evidence based recommendations for use of hepatitis A vaccines in immunization services: Background paper for sage discussions; 2011. Available from: http://www.who.int/immunization/sage/1_HepABackground_17Oct_final2_nov11.pdf
- Hepatitis A virus seroprevalence by age and world region, 1990 and 2005. Vaccine. 2010;28:6653-7.
- [Google Scholar]
- World Health Organization. The global prevalence of hepatitis A virus infection and susceptibility: A systematic review. Available from: https://apps.who.int/iris/bitstream/handle/10665/70180/ WHO_IVB_10.01_eng.pdf;jsessionid=625E9126160FF3B47B2EE3E93CC60799 ?sequence=1
- World Health Organization. World Health Organization position paper on hepatitis A vaccines – June 2012. Available from: http://www.who.int/wer/2012/wer8728_29.pdf?ua=1
- Methods for the economic evaluation of health care programmes (4th ed). Oxford: Oxford University Press; 2015.
- Decision modelling for health economic evaluation. Oxford: Oxford University Press; 2006.
- The role of health technology assessment on pharmaceutical reimbursement in selected middle-income countries. Health Policy. 2010;95:174-84.
- [Google Scholar]
- Cost-effectiveness analyses of hepatitis A vaccine: A systematic review to explore the effect of methodological quality on the economic attractiveness of vaccination strategies. Pharmacoeconomics. 2008;26:17-32.
- [Google Scholar]
- Contributions from the systematic review of economic evaluations: The case of childhood hepatitis A vaccination in Brazil. Cad Saude Publica. 2012;28:211-28.
- [Google Scholar]
- Economic evaluations of hepatitis A vaccination in middle-income countries. Expert Rev Vaccines. 2013;12:1479-94.
- [Google Scholar]
- Preferred reporting items for systematic review and meta-analysis protocols (PRISMA-P) 2015:Elaboration and explanation. BMJ. 2015;350:g7647.
- [Google Scholar]
- Systematic review of health economic evaluation studies developed in Brazil from 1980 to 2013. Front Public Health. 2018;6:52.
- [Google Scholar]
- Risk of bias in model-based economic evaluations:The ECOBIAS checklist. Expert Rev Pharmacoecon Outcomes Res. 2016;16:513-23.
- [Google Scholar]
- The World Bank. New country classifications by income level: 2017-2018. Available from: https://blogs.worldbank.org/opendata/new-country-classifications-income-level-2017-2018
- World Health Organization. Health statistics and information systems: WHO; 2018. Available from: https://www.who.int/healthinfo/global_burden_disease/definition_regions/en/
- The cost-effectiveness of universal vaccination of children against hepatitis A in Argentina: Results of a dynamic health-economic analysis. J Gastroenterol. 2007;42:152-60.
- [Google Scholar]
- Cost-effectiveness of childhood hepatitis A vaccination in Argentina: A second dose is warranted. Rev Panam Salud Publica. 2007;21:345-56.
- [Google Scholar]
- Cost-effectiveness analysis of hepatitis A prevention in travellers. Vaccine. 1992;10((Suppl 1)):S88-92.
- [Google Scholar]
- Cost-effectiveness analysis of vaccination against hepatitis A in travellers. J Med Virol. 1994;44:463-9.
- [Google Scholar]
- Cost-effectiveness of hepatitis A vaccination for adults in Belgium. Vaccine. 2012;30:6070-80.
- [Google Scholar]
- Cost-effectiveness of hepatitis A vaccination in a developed and developing country. Int J Health Care Qual Assur. 2019;32:1175-99.
- [Google Scholar]
- Economic evaluation of a publicly funded hepatitis A travel vaccination program in Ontario, Canada. Vaccine. 2019;37:1467-75.
- [Google Scholar]
- Cost-effectiveness of universal childhood hepatitis A vaccination in Chile. Vaccine. 2005;23:4110-9.
- [Google Scholar]
- Universal vaccination of children against hepatitis A in Chile: A cost-effectiveness study. Rev Panam Salud Publica. 2008;23:303-12.
- [Google Scholar]
- Epidemiology and cost-effectiveness analysis of hepatitis A vaccination in Liuzhou City. Zhonghua Liu Xing Bing Xue Za Zhi. 1998;19:93-6.
- [Google Scholar]
- Cost-benefit analysis for hepatitis A vaccine. Zhonghua Liu Xing Bing Xue Za Zhi. 1999;20:224-7.
- [Google Scholar]
- A cost-effectiveness analysis of universal childhood hepatitis A vaccination in China. Vaccine. 2008;26:4608-16.
- [Google Scholar]
- Cost-utility analysis on universal childhood hepatitis A vaccination in regions with different anti-HAV prevalence rates of China. Zhonghua Liu Xing Bing Xue Za Zhi. 2012;33:862-6.
- [Google Scholar]
- Cost effectiveness of hepatitis A prevention in France. Pharmacoeconomics. 1995;8:46-61.
- [Google Scholar]
- Cost-effectiveness of hepatitis A immunization of children and adolescents in Germany. HEPAC. 2001;2:96-103.
- [Google Scholar]
- Cost-effectiveness of hepatitis A vaccination in Indonesia. Hum Vaccin Immunother. 2014;10:2342-9.
- [Google Scholar]
- Cost-benefit analysis of a nationwide infant immunization programme against hepatitis A in an area of intermediate endemicity. J Hepatol. 2001;34:92-9.
- [Google Scholar]
- Cost-benefit analysis of active vaccination campaigns against hepatitis A among daycare centre personnel in Israel. Pharmacoeconomics. 2001;19:281-91.
- [Google Scholar]
- Cost-utility analysis of hepatitis A prevention among health-care workers in Israel. J Occup Environ Med. 2002;44:109-15.
- [Google Scholar]
- Public health impact and cost effectiveness of routine childhood vaccination for hepatitis a in Jordan:A dynamic model approach. BMC Infect Dis. 2018;18:119.
- [Google Scholar]
- The impact of assumptions regarding vaccine-induced immunity on the public health and cost-effectiveness of hepatitis A vaccination: Is one dose sufficient? Hum Vaccin Immunother. 2016;12:2765-71.
- [Google Scholar]
- Health economic assessment of universal immunization of toddlers against hepatitis A virus (HAV) in Mexico. Hum Vaccin Immunother. 2016;12:52-63.
- [Google Scholar]
- Pharmaco-economic evaluation of targeted hepatitis A vaccination for children of ethnic minorities in Amsterdam (The Netherlands) Vaccine. 2004;22:1862-7.
- [Google Scholar]
- An economic evaluation of hepatitis A vaccination in Dutch military personnel. Mil Med. 1998;163:564-7.
- [Google Scholar]
- Cost effectiveness of hepatitis A virus immunisation in Spain. Pharmacoeconomics. 1997;12:361-73.
- [Google Scholar]
- Vaccinating Thai adolescents against hepatitis A:Is it cost-effective? Southeast Asian J Trop Med Public Health. 2002;33((Suppl 3)):145-8.
- [Google Scholar]
- Cost-benefit analysis of hepatitis a vaccination in Thailand. Southeast Asian J Trop Med Public Health. 2002;33:118-27.
- [Google Scholar]
- Should British soldiers be vaccinated against hepatitis A?An economic analysis. Vaccine. 1994;12:1379-83.
- [Google Scholar]
- The cost-effectiveness of hepatitis A vaccination in patients with chronic hepatitis C viral infection in the United States. Am J Gastroenterol. 2002;97:721-8.
- [Google Scholar]
- The economics of routine childhood hepatitis A immunization in the United States: The impact of herd immunity. Pediatrics. 2007;119:e22-9.
- [Google Scholar]
- Cost-effectiveness of hepatitis A vaccination for individuals with chronic hepatitis C. Vaccine. 2010;28:1726-31.
- [Google Scholar]
- Cost effectiveness of vaccinating food service workers against hepatitis A infection. J Food Prot. 2000;63:768-74.
- [Google Scholar]
- The cost-effectiveness of vaccinating chronic hepatitis C patients against hepatitis A. Am J Gastroenterol. 2002;97:427-34.
- [Google Scholar]
- Vaccination of sexually active homosexual men against hepatitis A:Analysis of costs and benefits. J Gay Lesbian Med Assoc. 1999;3:51-8.
- [Google Scholar]
- The cost-effectiveness of adolescent hepatitis A vaccination in states with the highest disease rates. Arch Pediatr Adolesc Med. 2000;154:763-70.
- [Google Scholar]
- Regional variation in the cost effectiveness of childhood hepatitis A immunization. Pediatr Infect Dis J. 2003;22:904-14.
- [Google Scholar]
- Cost-effectiveness analysis of hepatitis A vaccination strategies for adults. Hepatology. 1999;30:1077-81.
- [Google Scholar]
- Cost-effectiveness of routine childhood vaccination for hepatitis A in the United States. Pediatrics. 2007;119:e12-21.
- [Google Scholar]
- Cost-effectiveness of hepatitis A vaccination in healthcare workers. Infect Control Hosp Epidemiol. 1997;18:688-91.
- [Google Scholar]
- Cost-effectiveness of a comprehensive immunization program serving high-risk, uninsured adults. Prev Med. 2020;130:105860.
- [Google Scholar]
- Cost-effectiveness analysis of catch-up hepatitis A vaccination among unvaccinated/partially-vaccinated children. Vaccine. 2016;34:4243-9.
- [Google Scholar]
- Public health impact and cost-effectiveness of hepatitis A Vaccination in the United States: A Disease Transmission Dynamic Modeling Approach. Value Health. 2015;18:358-67.
- [Google Scholar]
- An economic analysis of different strategies of immunization against hepatitis A virus in developed countries. Hepatology. 1999;29:548-52.
- [Google Scholar]
- The cost effectiveness of hepatitis immunization for US college students. J Am Coll Health. 2003;51:227-36.
- [Google Scholar]
- Cost effectiveness of hepatitis A/B versus hepatitis B vaccination for US prison inmates. Vaccine. 2004;22:1241-8.
- [Google Scholar]
- Live attenuated hepatitis A vaccine. Available from: https://www.who.int/vaccine_safety/committee/topics/hepatitisa/Jun_2010/en/
- Hepatitis A immunisation in persons not previously exposed to hepatitis A. Cochrane Database Syst Rev. 2019;12:CD009051.
- [Google Scholar]
- A systematic review of model-based economic evaluations of diagnostic and therapeutic strategies for lower extremity artery disease. Thromb Haemost. 2014;111:19-28.
- [Google Scholar]
- How to select the right cost-effectiveness model?:A systematic review and stepwise approach for selecting a transferable health economic evaluation model for rheumatoid arthritis. Pharmacoeconomics. 2014;32:429-42.
- [Google Scholar]
- Challenges in systematic reviews of economic analyses. Ann Intern Med. 2005;142:1073-9.
- [Google Scholar]
- Economic evaluation of vaccination programmes: A consensus statement focusing on viral hepatitis. Pharmacoeconomics. 2002;20:1-7.
- [Google Scholar]
- Hepatitis A virus infections in the United States:Model-based estimates and implications for childhood immunization. Pediatrics. 2002;109:839-45.
- [Google Scholar]
- Catalytic models in epidemiology. Cambridge: Harvard University Press; 1959.
- What do international pharmacoeconomic guidelines say about economic data transferability? Value Health. 2010;13:1028-37.
- [Google Scholar]
- 84 outbreaks of hepatitis A in last five years in Kerala state-are we resigning to fate?Natl J Res Community Med . . 2017;6:267-70.
- [Google Scholar]
- Epidemiological transition of hepatitis A in India:Issues for vaccination in developing countries. Indian J Med Res. 2008;128:699-704.
- [Google Scholar]
- Suspected spread of hepatitis A virus from a restaurant among adults in rural area of the Kerala state, India. Epidemiol Infect. 2019;147:e210.
- [Google Scholar]
Appendix I
| Domain | Intervention (I) | Outcome (O) |
|---|---|---|
| Search term | “Hepatitis A” “Hepatitis A”[MeSH Terms] Vaccination Vaccine Immunisation Immunisation [MeSH term] Immunisatization [MeSH term] Hepatitis A vaccine” “Hepatitis A immunization” “Hepatitis A immunisation” “Hepatitis A vaccination” Avaxim Havrix Havpur Vaqta Twinrix “Biovac A” Viatim Hepatyrix ViCPS Vivaxim |
DALY “Disability adjusted life year” QALY “Quality adjusted life year” “Life year” “Life years” ICER “Incremental cost effectiveness ratio” “Cost benefit” “Cost effectiveness” “Cost utilit*” “Cost analysis” “Econom* evaluation” economics Economics [MeSH terms] “Economics assessment” |
| Domain | Intervention (I) | Outcome (O) |
|---|---|---|
| Search term | “Hepatitis A vaccine” “Hepatitis A vaccination” “Hepatitis A immunisation” “Hepatitis A immunization” Avaxim Havrix Havpur Vaqta Twinrix “Biovac A” Viatim Hepatyrix ViCPS Vivaxim |
DALY “Disability adjusted life year” QALY “Quality adjusted life year” “Life year” “Life years” ICER “Incremental cost effectiveness ratio” “Cost benefit” “Cost effectiveness” “Cost utilit*” “Cost analysis” “Econom* evaluation” economics Economics “Economics assessment” |
Medline–PubMed search and strategies in intervention domain using Boolean operator “OR”
| Search number | Builder | Term |
|---|---|---|
| 1 | #1 | Search “Hepatitis A” |
| 2 | #2 | Search “Hepatitis A”[MeSH Terms] |
| 3 | #3 | Search Vaccination |
| 4 | #1 OR#2 AND #3 | Search ((“Hepatitis A”) OR “Hepatitis A”[MeSH Terms]) AND Vaccination |
| 5 | #4 | Search Vivaxim |
| 6 | $5 | Search ViCPS |
| 7 | #6 | Search Hepatyrix |
| 8 | #7 | Search “Biovac A” |
| 9 | #8 | Search Viatim |
| 10 | #9 | Search Twinrix |
| 11 | #10 | Search Vaqta |
| 12 | #11 | Search Havpur |
| 13 | #12 | Search Havrix |
| 14 | #13 | Search Avaxim |
| 15 | #4OR# 5 OR#6OR#7OR #8 OR#9 OR. #10 OR#11 OR#12 OR#13 | Search (((((((((Vivaxim) OR ViCPS) OR Hepatyrix) OR Biovac A) OR Viatim) OR Twinrix) OR Vaqta) OR Havpur) OR Havrix) OR Avaxim |
| 16 | #14 | Search immunisation |
| 17 | #15 | Search immunisation[MeSH Terms] |
| 18 | #14 OR #15 | Search (immunisation) OR immunisation[MeSH Terms] |
| 19 | #16 | Search immunization[MeSH Terms] |
| 20 | #17 | Search immunization |
| 21 | #16 OR #17 | Search (immunization[MeSH Terms]) OR immunization |
| 22 | #18 | Search Vaccination |
| 23 | #19 | Search Vaccine |
| 24 | Search 4 OR15 OR 18 OR 21 OR 22 OR 23 | Search (((((((((((“Hepatitis A”) OR “Hepatitis A”[MeSH Terms])) AND Vaccination) OR ((((((((((Vivaxim) OR ViCPS) OR Hepatyrix) OR Biovac A) OR Viatim) OR Twinrix) OR Vaqta) OR Havpur) OR Havrix) OR Avaxim)) OR ((immunisation) OR immunisation[MeSH Terms])) OR ((immunization[MeSH Terms]) OR immunization)) OR Vaccination) OR Vaccine) OR immunization) OR Vaccine) AND “Hepatitis A” |
Medline–PubMed search and strategies in outcome domain using Boolean operator “OR”
| Search number | Builder | Term |
|---|---|---|
| 1 | #1 | Search (((((((“Cost utility*”) OR “Cost benefit”) OR “Cost effectiveness”) OR ((“Incremental cost effectiveness ratio”) OR ICER)) OR ((“life years”) OR “Life year”)) OR ((DALY) OR “Disability adjusted life year”)) OR ((QALY) OR “Quality adjusted life year”)) OR (((((economics) OR economics[MeSH Terms]) OR economic) OR “Economic* evaluation”) OR “economic assessment”) |
| 1 | #1 | Search “Cost utility*” |
| 2 | #2 | Search “Cost benefit” |
| 3 | #3 | Search “Cost effectiveness” |
| 4 | #4 | Search “Incremental cost effectiveness ratio” |
| 5 | #5 | Search ICER |
| 6 | #4OR#5 | Search (“Incremental cost effectiveness ratio”) OR ICER |
| 7 | #6 | Search “life years” |
| 8 | #7 | Search “Life year” |
| 9 | #6OR#7 | Search (“life years”) OR “Life year” |
| 10 | #8 | Search DALY |
| 11 | #9 | Search “Disability adjusted life year” |
| 12 | #8OR#9 | Search (DALY) OR “Disability adjusted life year” |
| 13 | #10 | Search QALY |
| 14 | #11 | Search “Quality adjusted life year” |
| 15 | #10OR#11 | Search (QALY) OR “Quality adjusted life year” |
| 16 | #12 | Search economics |
| 17 | #13 | Search economics[MeSH Terms] |
| 18 | #14 | Search economic |
| 19 | #15 | Search “Economic* evaluation” |
| 20 | #16 | Search “economic assessment” |
| 21 | #12OR#13OR#14 #15OR#16 | Search ((((economics) OR economics[MeSH Terms]) OR economic) OR “Economic* evaluation”) OR “economic assessment” |
| 22 | 1 OR 2 OR 3 OR 6 OR 9 OR 11 OR 15 OR 21 | Search (((((((“Cost utility*”) OR “Cost benefit”) OR “Cost effectiveness”) OR ((“Incremental cost effectiveness ratio”) OR ICER)) OR ((“life years”) OR “Life year”)) OR ((DALY) OR “Disability adjusted life year”)) OR ((QALY) OR “Quality adjusted life year”)) OR (((((economics) OR economics[MeSH Terms]) OR economic) OR “Economic* evaluation”) OR “economic assessment”) |
Medline–PubMed search and strategies in intervention and outcome domain using Boolean operator “AND”
| Search number | Builder | Term |
|---|---|---|
| 1 | #1 (From intervention domain) | Search (((((((((((“Hepatitis A”) OR “Hepatitis A”[MeSH Terms])) AND Vaccination) OR ((((((((((Vivaxim) OR ViCPS) OR Hepatyrix) OR Biovac A) OR Viatim) OR Twinrix) OR Vaqta) OR Havpur) OR Havrix) OR Avaxim)) OR ((immunisation) OR immunisation[MeSH Terms])) OR ((immunization[MeSH Terms]) OR immunization)) OR Vaccination) OR Vaccine) OR immunization) OR Vaccine) AND “Hepatitis A” |
| 2 | #2 (outcome domain) | Search (((((((“Cost utility*”) OR “Cost benefit”) OR “Cost effectiveness”) OR ((“Incremental cost effectiveness ratio”) OR ICER)) OR ((“life years”) OR “Life year”)) OR ((DALY) OR “Disability adjusted life year”)) OR ((QALY) OR “Quality adjusted life year”)) OR (((((economics) OR economics[MeSH Terms]) OR economic) OR “Economic* evaluation”) OR “economic assessment”) |
| 3 | 1 AND 2 | Search (((((((((((((“Hepatitis A”) OR “Hepatitis A”[MeSH Terms])) AND Vaccination) OR ((((((((((Vivaxim) OR ViCPS) OR Hepatyrix) OR Biovac A) OR Viatim) OR Twinrix) OR Vaqta) OR Havpur) OR Havrix) OR Avaxim)) OR ((immunisation) OR immunisation[MeSH Terms])) OR ((immunization[MeSH Terms]) OR immunization)) OR Vaccination) OR Vaccine) OR immunization) OR Vaccine) AND “Hepatitis A”)) AND ((((((((“Cost utility*”) OR “Cost benefit”) OR “Cost effectiveness”) OR ((“Incremental cost effectiveness ratio”) OR ICER)) OR ((“life years”) OR “Life year”)) OR ((DALY) OR “Disability adjusted life year”)) OR ((QALY) OR “Quality adjusted life year”)) OR (((((economics) OR economics[MeSH Terms]) OR economic) OR “Economic* evaluation”) OR “economic assessment”)) |
Search terms with strategies combined for intervention and outcome domain using Boolean operator “AND” in Scopus
| Query |
|---|
| ( ( ( ( ( TITLE-ABS-KEY ( “Hepatitis A vaccine” ) ) OR ( TITLE-ABS-KEY ( “Hepatitis A vaccination” ) ) OR ( TITLE-ABS-KEY ( “hepatitis A immunisation” ) ) OR ( TITLE-ABS-KEY ( “hepatitis A immunization” ) ) OR ( TITLE-ABS-KEY ( avaxim ) ) OR ( TITLE-ABS-KEY ( havrix ) ) OR ( TITLE-ABS-KEY ( havpur ) ) OR ( TITLE-ABS-KEY ( vaqta ) ) OR ( TITLE-ABS-KEY ( vaqta ) ) OR ( TITLE-ABS-KEY ( twinrix ) ) OR ( TITLE-ABS-KEY ( “Biovac A” ) ) OR ( TITLE-ABS-KEY ( viatim ) ) ) OR ( ( TITLE-ABS-KEY ( hepatyrix ) ) OR ( TITLE-ABS-KEY ( vicps ) ) OR ( TITLE-ABSKEY ( vivaxim ) ) ) ) ) AND ( ( TITLE-ABS-KEY ( economics ) ) OR ( ( ( TITLE-ABS-KEY ( “Cost benefit” ) ) OR ( TITLE-ABS-KEY ( “Cost effectiveness” ) ) OR ( TITLE-ABS-KEY ( “Cost utility” ) ) OR ( TITLE-ABS-KEY ( “Cost analysis” ) ) OR ( TITLE-ABS-KEY ( “Econom* evaluation” ) ) ) OR ( ( TITLE-ABS-KEY ( icer ) ) OR ( TITLE-ABS-KEY ( “Incremental cost effectiveness ratio” ) ) ) OR ( TITLE-ABS-KEY ( “Incremental cost effectiveness ratio” ) ) OR ( ( TITLE-ABS-KEY ( qaly ) ) OR ( TITLE-ABS-KEY ( “Quality adjusted life year” ) ) ) OR ( ( TITLE-ABS-KEY ( daly ) ) OR ( TITLE-ABS-KEY ( “Disability adjusted life year” ) ) ) ) ) ) OR ( ( ( ( “Econom* evaluation” ) OR ( “Cost analysis” ) OR ( “Cost utility” ) OR ( “Cost effectiveness” ) OR ( “Cost benefit” ) ) OR ( ( daly ) OR ( “Disability adjusted life year” ) ) OR ( ( icer ) OR ( “Incremental cost effectiveness ratio” ) ) OR ( ( qaly ) OR ( “Quality adjusted life year” ) ) ) AND ( ( ( vivaxim ) OR ( “ViCPS” ) OR ( hepatyrix ) OR ( viatim ) OR ( “Biovac A” ) ) OR ( ( “Hepatitis A vaccine” ) OR ( avaxim ) OR ( havrix ) OR ( havpur ) OR ( vaqta ) OR ( “Hepatitis A vaccination” ) OR ( “hepatitis A immunization” ) OR ( “Hepatitis A immunisation” ) OR ( twinrix ) ) ) ) ( ( ( ( TITLE-ABS-KEY ( “Hepatitis A vaccine” ) ) OR ( TITLE-ABS-KEY ( “Hepatitis A vaccination” ) ) OR ( TITLE-ABS-KEY ( “hepatitis A immunisation” ) ) OR ( TITLE-ABS-KEY ( “hepatitis A immunization” ) ) OR ( TITLE-ABS-KEY ( avaxim ) ) OR ( TITLE-ABS-KEY ( havrix ) ) OR ( TITLE-ABS-KEY ( havpur ) ) OR ( TITLE-ABS-KEY ( vaqta ) ) OR ( TITLE-ABS - KEY ( vaqta ) ) OR ( TITLE-ABS-KEY ( twinrix ) ) OR ( TITLE-ABS-KEY ( “Biovac A” ) ) OR ( TITLE-ABS-KEY ( viatim ) ) ) OR ( ( TITLE-ABS-KEY ( hepatyrix ) ) OR ( TITLE-ABS-KEY ( vicps ) ) OR ( TITLE-ABS-KEY ( vivaxim ) ) ) ) ) AND ( ( TITLE-ABS-KEY ( economics ) ) OR ( ( ( TITLE-ABS-KEY ( “Cost benefit” ) ) OR ( TITLE-ABS-KEY ( “Cost effectiveness” ) ) OR ( TITLE-ABS-KEY ( “Cost utility” ) ) OR ( TITLE-ABS-KEY ( “Cost analysis” ) ) OR ( TITLE-ABS-KEY ( “Econom* evaluation” ) ) ) OR ( ( TITLE-ABS-KEY ( icer ) ) OR ( TITLE-ABS-KEY ( “Incremental cost effectiveness ratio” ) ) ) OR ( TITLE-ABS-KEY ( “Incremental cost effectiveness ratio” ) ) OR ( ( TITLE-ABS-KEY ( qaly ) ) OR ( TITLE-ABS-KEY ( “Quality adjusted life year” ) ) ) OR ( ( TITLE-ABS-KEY ( daly ) ) OR ( TITLE-ABS-KEY ( “Disability adjusted life year” ) ) ) ) ) ( ( ( “Econom* evaluation” ) OR ( “Cost analysis” ) OR ( “Cost utility” ) OR ( “Cost effectiveness” ) OR ( “Cost benefit” ) ) OR ( ( daly ) OR ( “Disability adjusted life year” ) ) OR ( ( icer ) OR ( “Incremental cost effectiveness ratio” ) ) OR ( ( qaly ) OR ( “Quality adjusted life year” ) ) ) AND ( ( ( vivaxim ) OR ( “ViCPS” ) OR ( hepatyrix ) OR ( viatim ) OR ( “Biovac A” ) ) OR ( ( “Hepatitis A vaccine” ) OR ( avaxim ) OR ( havrix ) OR ( havpur ) OR ( vaqta ) OR ( “Hepatitis A vaccination” ) OR ( “hepatitis A immunization” ) OR ( “Hepatitis A immunisation” ) OR ( twinrix ) ) ) |
Appendix II
Appendix III
| Section/topic | # | PRISMA Checklist item | Reported on page # |
|---|---|---|---|
| TITLE | |||
| Title | 1 | Identify the report as a systematic review, meta-analysis, or both. | Yes, 1 |
| ABSTRACT | |||
| Structured summary | 2 | Provide a structured summary including, as applicable: background; objectives; data sources; study eligibility criteria, participants, and interventions; study appraisal and synthesis methods; results; limitations; conclusions and implications of key findings; systematic review registration number. | Yes, 1 |
| INTRODUCTION | |||
| Rationale | 3 | Describe the rationale for the review in the context of what is already known. | Yes, 4,5 |
| Objectives | 4 | Provide an explicit statement of questions being addressed with reference to participants, interventions, comparisons, outcomes, and study design (PICOS). | Yes, 6 |
| METHODS | |||
| Protocol and registration | 5 | Indicate if a review protocol exists, if and where it can be accessed (e.g., Web address), and, if available, provide registration information including registration number. | Yes, 5,6 |
| Eligibility criteria | 6 | Specify study characteristics (e.g., PICOS, length of follow-up) and report characteristics (e.g., years considered, language, publication status) used as criteria for eligibility, giving rationale. | Yes, 8,9 |
| Information sources | 7 | Describe all information sources (e.g., databases with dates of coverage, contact with study authors to identify additional studies) in the search and date last searched. | Yes, 6 and all appendix |
| Search | 8 | Present full electronic search strategy for at least one database, including any limits used, such that it could be repeated. | Yes, 6 #x0026; appendix |
| Study selection | 9 | State the process for selecting studies (i.e., screening, eligibility, included in systematic review, and, if applicable, included in the meta-analysis). | Yes, 6,7 Figure |
| Data collection process | 10 | Describe method of data extraction from reports (e.g., piloted forms, independently, in duplicate) and any processes for obtaining and confirming data from investigators. | Yes, 6,7 |
| Data items | 11 | List and define all variables for which data were sought (e.g., PICOS, funding sources) and any assumptions and simplifications made. | Yes, 6,7 |
| Risk of bias in individual studies | 12 | Describe methods used for assessing risk of bias of individual studies (including specification of whether this was done at the study or outcome level), and how this information is to be used in any data synthesis. | Yes, 9 |
| Summary measures | 13 | State the principal summary measures (e.g., risk ratio, difference in means). | Not applicable |
| Synthesis of results | 14 | Describe the methods of handling data and combining results of studies, if done, including measures of consistency (e.g., I2) for each meta-analysis. | Not applicable |
| Risk of bias across studies | 15 | Specify any assessment of risk of bias that may affect the cumulative evidence (e.g., publication bias, selective reporting within studies). | Yes 6, 7 appendix |
| Additional analyses | 16 | Describe methods of additional analyses (e.g., sensitivity or subgroup analyses, meta-regression), if done, indicating which were pre-specified. | Not applicable |
| RESULTS | |||
| Study selection | 17 | Give numbers of studies screened, assessed for eligibility, and included in the review, with reasons for exclusions at each stage, ideally with a flow diagram. | Yes, 9,10 and Figure |
| Study characteristics | 18 | For each study, present characteristics for which data were extracted (e.g., study size, PICOS, follow-up period) and provide the citations. | Yes, 6-10 |
| Risk of bias within studies | 19 | Present data on risk of bias of each study and, if available, any outcome level assessment (see item 12). | Yes, Appendix |
| Results of individual studies | 20 | For all outcomes considered (benefits or harms), present, for each study: (a) simple summary data for each intervention group (b) effect estimates and confidence intervals, ideally with a forest plot. | Yes, 8-11 Figure , Table II, Table III, Table IV |
| Synthesis of results | 21 | Present results of each meta-analysis done, including confidence intervals and measures of consistency. | Not applicable |
| Risk of bias across studies | 22 | Present results of any assessment of risk of bias across studies (see Item 15). | Yes, Appendix IV |
| Additional analysis | 23 | Give results of additional analyses, if done (e.g., sensitivity or subgroup analyses, meta-regression [see Item 16]). | Not applicable |
| DISCUSSION | |||
| Summary of evidence | 24 | Summarize the main findings including the strength of evidence for each main outcome; consider their relevance to key groups (e.g., healthcare providers, users, and policy makers). | Yes, 8-11 |
| Limitations | 25 | Discuss limitations at study and outcome level (e.g., risk of bias), and at review-level (e.g., incomplete retrieval of identified research, reporting bias). | Yes, 13-14 |
| Conclusions | 26 | Provide a general interpretation of the results in the context of other evidence, and implications for future research. | Yes, 14 |
| FUNDING | |||
| Funding | 27 | Describe sources of funding for the systematic review and other support (e.g., supply of data); role of funders for the systematic review. | Yes, 15 |
Adopted from Moher D, Liberati A, Tetzlaff J, Altman DG, The PRISMA Group (2009). Preferred Reporting Items for Systematic Reviews and Meta-Analyses: The PRISMA Statement. PLoS Med 6 (7): e1000097. doi: 10.1371/journal.pmed1000097
Appendix IV
| Bias | Ramsey et al26, 2019 | Luyten et al24, 2012 | Chapko et al50, 2010 | Armstrong et al49, 2007 | Hankin-Wei et al60, 2016 | Wilson et al59, 2020 | Dhankhar et al61, 2015 | Ghildayal et al25, 2019 | |
|---|---|---|---|---|---|---|---|---|---|
| 1.Narrow perspective bias | P | Y | P | Y | U | P | Y | Y | |
| 2.Inefficient comparator bias | Y | Y | Y | Y | Y | Y | Y | Y | |
| 3.Cost measurement omission bias | P | Y | P | Y | Y | P | Y | Y | |
| 4.Intermittent data collection bias | Y | Y | Y | Y | U | U | Y | Y | |
| 5.Invalid valuation bias | Y | Y | Y | Y | U | N | Y | Y | |
| 6.Ordinal ICER bias | Y | Y | Y | U | Y | Y | Y | Y | |
| 7.Double-counting bias | Y | N | P | U | N | U | U | N | |
| 8. Inappropriate discounting bias | Y | Y | Y | Y | Y | U | Y | Y | |
| 9.Limited sensitivity analysis bias | P | P | P | N | Y | P | P | P | |
| 10.Sponsor bias | Y | Y | Y | N | Y | N | N | N | |
| 11.Reporting and dissemination bias | X | X | X | X | X | X | X | X | |
| 12.Structural assumptions bias | Y | Y | Y | Y | U | U | Y | Y | |
| 13.No treatment comparator bias | Y | Y | Y | Y | Y | Y | Y | Y | |
| 14. Wrong model bias | Y | Y | Y | U | Y | U | Y | Y | |
| 15. Limited time horizon bias | Y | Y | U | N | Y | N | U | N | |
| 16.Bias related to data identification | Y | Y | Y | Y | P | N | Y | Y | |
| 17.Bias related to baseline data | Y | Y | Y | Y | U | N | Y | Y | |
| 18.Bias related to treatment effects | Y | Y | Y | Y | U | U | Y | Y | |
| 19.Bias related to quality-of-life weights (utilities) | P | P | U | P | U | X | P | U | |
| 20.Non-transparent data incorporation bias | Y | Y | Y | Y | P | U | Y | Y | |
| 21.Limited scope bias | P | P | P | N | P | P | P | P | |
| 22.Bias related to internal consistency | U | U | U | U | U | U | U | U | |
| Bias | Rein et al57, 2007 | Postma et al42, 2004 | Jacobs et al42, 2003 | Arguedas et al48, 2002 | Chodick et al38, 2002 | Jacobs et al54, 2000 | Jacobs et al52, 2002 | Chodick et al37, 2001 | Diel et al34, 2001 |
| 1.Narrow perspective bias | Y | Y | Y | Y | P | Y | Y | Y | Y |
| 2.Inefficient comparator bias | Y | Y | Y | Y | Y | Y | Y | Y | Y |
| 3.Cost measurement omission bias | Y | P | Y | Y | P | Y | P | Y | Y |
| 4.Intermittent data collection bias | Y | Y | Y | Y | Y | Y | P | U | Y |
| 5.Invalid valuation bias | Y | Y | Y | Y | Y | Y | U | Y | Y |
| 6.Ordinal ICER bias | Y | Y | Y | Y | P | P | P | P | Y |
| 7.Double-counting bias | Y | U | N | Y | Y | N | U | U | P |
| 8. Inappropriate discounting bias | Y | U | Y | Y | Y | Y | Y | Y | Y |
| 9.Limited sensitivity analysis bias | P | N | P | P | P | P | P | P | P |
| 10.Sponsor bias | N | N | P | N | Y | P | P | Y | N |
| 11.Reporting and dissemination bias | X | X | X | X | X | X | X | X | X |
| 12.Structural assumptions bias | Y | Y | Y | Y | Y | Y | Y | Y | Y |
| 13.No treatment comparator bias | Y | Y | Y | Y | Y | Y | Y | Y | Y |
| 14. Wrong model bias | Y | Y | Y | Y | Y | Y | Y | Y | Y |
| 15. Limited time horizon bias | Y | U | Y | Y | Y | U | U | N | N |
| 16.Bias related to data identification | Y | Y | Y | Y | Y | Y | Y | Y | Y |
| 17.Bias related to baseline data | Y | Y | Y | Y | Y | Y | P | P | Y |
| 18.Bias related to treatment effects | Y | Y | Y | Y | Y | Y | P | P | Y |
| 19.Bias related to quality-of-life weights (utilities) | P | X | P | P | P | X | X | P | X |
| 20.Non-transparent data incorporation bias | Y | Y | Y | Y | Y | Y | Y | Y | Y |
| 21.Limited scope bias | P | N | P | P | P | P | P | P | P |
| 22.Bias related to internal consistency | U | U | U | U | U | U | U | U | U |
| Bias | Ginsberg et al36, 2001 | Jacobs et al51, 2000 | Jacobs et al53, 1999 | O’Conner et al56, 1999 | Buma et al43, 1998 | Arnal et al44, 1997 | Smitd et al58, 1997 | Severo et al53, 1995 | Van-Doorslaer et al23, 1994 |
| 1.Narrow perspective bias | Y | Y | Y | Y | U | U | Y | Y | U |
| 2.Inefficient comparator bias | Y | Y | Y | Y | Y | Y | Y | Y | Y |
| 3.Cost measurement omission bias | Y | Y | Y | Y | P | P | P | Y | P |
| 4.Intermittent data collection bias | Y | Y | Y | Y | Y | Y | Y | U | Y |
| 5.Invalid valuation bias | Y | Y | Y | Y | Y | Y | Y | Y | Y |
| 6.Ordinal ICER bias | Y | Y | Y | Y | Y | P | Y | Y | Y |
| 7.Double-counting bias | U | Y | P | Y | U | P | Y | Y | P |
| 8. Inappropriate discounting bias | Y | Y | Y | Y | U | Y | Y | Y | Y |
| 9.Limited sensitivity analysis bias | P | P | P | P | N | P | P | P | P |
| 10.Sponsor bias | N | P | P | N | N | Y | N | N | N |
| 11.Reporting and dissemination bias | X | X | X | X | X | X | X | X | X |
| 12.Structural assumptions bias | Y | Y | Y | Y | Y | P | Y | Y | Y |
| 13.No treatment comparator bias | Y | Y | Y | Y | Y | Y | Y | Y | Y |
| 14. Wrong model bias | Y | Y | Y | Y | Y | Y | Y | Y | Y |
| 15. Limited time horizon bias | N | U | Y | Y | U | U | Y | N | N |
| 16.Bias related to data identification | Y | Y | Y | Y | Y | P | Y | Y | Y |
| 17.Bias related to baseline data | Y | Y | Y | Y | Y | P | Y | Y | Y |
| 18.Bias related to treatment effects | Y | Y | Y | Y | P | P | Y | Y | Y |
| 19.Bias related to quality-of-life weights (utilities) | X | X | X | X | P | X | P | X | X |
| 20.Non-transparent data incorporation bias | Y | Y | Y | Y | Y | P | Y | Y | Y |
| 21.Limited scope bias | P | P | P | P | N | P | P | P | P |
| 22.Bias related to internal consistency | U | U | U | U | U | U | U | U | U |
| Bias | Jefferson et al47, 1994 | Tormans et al22, 1992 | Hayajneh et al39, 2018 | Curran et al40, 2016 | Carlos et al41, 2016 | Pan et al32, 2012 | Quezada et al28, 2008 | Ellis et al21, 2007 | Lopez et al20, 2007 |
| 1.Narrow perspective bias | U | U | Y | P | Y | Y | Y | Y | Y |
| 2.Inefficient comparator bias | Y | Y | Y | Y | Y | Y | Y | Y | Y |
| 3.Cost measurement omission bias | P | P | Y | P | Y | Y | Y | Y | Y |
| 4.Intermittent data collection bias | Y | Y | Y | Y | Y | P | Y | Y | Y |
| 5.Invalid valuation bias | Y | Y | Y | Y | Y | Y | Y | Y | Y |
| 6.Ordinal ICER bias | P | Y | Y | P | Y | P | P | P | Y |
| 7.Double-counting bias | P | Y | Y | Y | N | U | Y | Y | Y |
| 8. Inappropriate discounting bias | Y | Y | Y | Y | Y | Y | Y | Y | Y |
| 9.Limited sensitivity analysis bias | N | P | P | P | Y | P | P | P | P |
| 10.Sponsor bias | N | P | P | P | N | Y | N | P | N |
| 11.Reporting and dissemination bias | X | X | X | X | X | X | X | X | X |
| 12.Structural assumptions bias | P | Y | Y | Y | Y | Y | Y | P | Y |
| 13.No treatment comparator bias | Y | Y | Y | Y | Y | Y | Y | Y | Y |
| 14. Wrong model bias | Y | Y | Y | Y | Y | Y | Y | Y | Y |
| 15. Limited time horizon bias | N | N | N | N | N | U | Y | P | Y |
| 16.Bias related to data identification | P | Y | Y | Y | P | Y | Y | Y | Y |
| 17.Bias related to baseline data | P | Y | Y | Y | U | Y | Y | Y | Y |
| 18.Bias related to treatment effects | P | Y | Y | Y | U | Y | Y | N | Y |
| 19.Bias related to quality-of-life weights (utilities) | X | X | P | U | P | P | X | P | X |
| 20.Non-transparent data incorporation bias | P | Y | Y | Y | P | Y | Y | Y | Y |
| 21.Limited scope bias | N | P | P | P | U | P | P | P | P |
| 22.Bias related to internal consistency | U | U | U | U | U | U | U | U | U |
| Bias | Valenzuela et al27, 2005 | Das et al62, 1999 | Suwantika et al35, 2014 | Zhuang et al31, 2008 | Soogarun et al45, 2002 | Teppakdee et al46, 2002 | Chen et al30, 1999 | Li et al29, 1998 | |
| 1.Narrow perspective bias | Y | Y | Y | Y | U | U | U | Y | |
| 2.Inefficient comparator bias | Y | Y | Y | Y | Y | Y | Y | Y | |
| 3.Cost measurement omission bias | Y | Y | Y | P | U | U | U | Y | |
| 4.Intermittent data collection bias | Y | Y | Y | P | Y | Y | U | U | |
| 5.Invalid valuation bias | Y | P | Y | P | P | P | U | P | |
| 6.Ordinal ICER bias | N | P | Y | Y | U | U | P | P | |
| 7.Double-counting bias | N | U | Y | Y | Y | Y | U | U | |
| 8. Inappropriate discounting bias | Y | Y | Y | Y | U | U | U | U | |
| 9.Limited sensitivity analysis bias | P | P | P | P | N | N | N | N | |
| 10.Sponsor bias | P | N | N | N | N | N | N | Y | |
| 11.Reporting and dissemination bias | X | X | X | X | X | X | X | X | |
| 12.Structural assumptions bias | Y | Y | Y | Y | P | P | U | Y | |
| 13.No treatment comparator bias | Y | Y | Y | Y | Y | Y | Y | Y | |
| 14. Wrong model bias | Y | Y | Y | Y | P | P | U | U | |
| 15. Limited time horizon bias | P | Y | P | U | U | U | N | U | |
| 16.Bias related to data identification | Y | Y | Y | Y | Y | Y | P | P | |
| 17.Bias related to baseline data | Y | Y | Y | Y | U | U | U | P | |
| 18.Bias related to treatment effects | Y | U | Y | Y | U | U | U | P | |
| 19.Bias related to quality-of-life weights (utilities) | P | P | P | P | X | X | X | P | |
| 20.Non-transparent data incorporation bias | Y | Y | Y | Y | Y | Y | P | Y | |
| 21.Limited scope bias | P | P | P | P | N | N | N | N | |
| 22.Bias related to internal consistency | U | U | U | U | U | U | U | U | |
Note: Bias addressed (P: Partly; N: Not addressed; U: Unclear; X: Not applicable; Y: Yes)


