Translate this page into:
Expression profile of mitrogen-activated protein kinase (MAPK) signaling genes in the skeletal muscle & liver of rat with type 2 diabetes: Role in disease pathology
Reprint requests: Dr Shangdong Liang, Bayi Road 461#, Department of Physiology, Medical College of Nanchang University, Nanchang, Jiangxi 330 006, PR China e-mail: liangsd@hotmail.com
-
Received: ,
This is an open-access article distributed under the terms of the Creative Commons Attribution-Noncommercial-Share Alike 3.0 Unported, which permits unrestricted use, distribution, and reproduction in any medium, provided the original work is properly cited.
This article was originally published by Medknow Publications & Media Pvt Ltd and was migrated to Scientific Scholar after the change of Publisher.
Abstract
Background & objectives:
Type 2 diabetes (T2D) is characterized as hyperglycaemia caused by defects in insulin secretion, and it affects target tissues, such as skeletal muscle, liver and adipose tissue. Therefore, analyzing the changes of gene expression profiles in these tissues is important to elucidate the pathogenesis of T2D. We, therefore, measured the gene transcript alterations in liver and skeletal muscle of rat with induced T2D, to detect differentially expressed genes in liver and skeletal muscle and perform gene-annotation enrichment analysis.
Methods:
In the present study, skeletal muscle and liver tissue from 10 streptozotocin-induced diabetic rats and 10 control rats were analyzed using gene expression microarrays. KEGG pathways enriched by differentially expressed genes (DEGs) were identified by WebGestalt Expander and GATHER software. DEGs were validated by the method of real-time PCR and western blot.
Results:
From the 9,929 expressed genes across the genome, 1,305 and 997 differentially expressed genes (DEGs, P<0.01) were identified in comparisons of skeletal muscle and liver, respectively. Large numbers of DEGs (200) were common in both comparisons, which was clearly more than the predicted number (131 genes, P<0.001). For further interpretation of the gene expression data, three over-representation analysis softwares (WebGestalt, Expander and GATHER) were used. All the tools detected one KEGG pathway (MAPK signaling) and two GO (gene ontology) biological processes (response to stress and cell death), with enrichment of DEGs in both tissues. In addition, PPI (protein-protein interaction) networks constructed using human homologues not only revealed the tendency of DEGs to form a highly connected module, but also suggested a “hub” role of p38-MAPK-related genes (such as MAPK14) in the pathogenesis of T2D.
Interpretation & conclusions:
Our results indicated the considerably aberrant MAPK signaling in both insulin-sensitive tissues of T2D rat, and that the p38 may play a role as a common “hub” in the gene module response to hyperglycaemia. Furthermore, our research pinpoints the role of several new T2D-associated genes (such as Srebf1 and Ppargc1) in the human population.
Keywords
Differentially expressed gene
MAPK signaling pathway
type 2 diabetes

Type 2 diabetes (T2D) is thought to be the result of a complex interplay of both genetic and environmental factors. Although many risk factors (e.g. alterations in early life development, obesity, excessive food intake, decreased physical activity and ageing) have been identified for T2D, the molecular mechanism causing T2D remains to be identified. T2D is characterized as hyperglycaemia caused by the combined impairment of insulin secretion (β-cell) and action on its target tissues (skeletal muscle, adipose tissue and liver). To identify genes potentially involved in the pathogenesis of T2D, several altered transcript profiles have been reconstructed based on biopsies from diabetic patients or rat models123. A growing number of DEGs (differentially expressed genes) have been detected in skeletal muscles, adipose tissue and the liver123. Interestingly, many common genes with dramatic alterations in different insulin target tissues have been observed. Although these results suggested that the identification of shared molecular mechanisms could aid our understanding of the pathophysiology of T2D, the systematic identification of common DEGs that respond to hyperglycaemia in different insulin-sensitive tissues is still lacking.
The mitogen-activated protein kinase (MAPK) cascade is a highly conserved module that responds to extracellular stimuli and regulates cell proliferation, differentiation, migration, etc. This signaling pathway consists of four major sub-families of related proteins (Erk1/2, JNK, p38 and Erk5) and contribute to various disorders (including cancer, autoimmune diseases, neurodegenerative diseases, cardiovascular diseases, inflammation, etc.)456. This study was undertaken to measure the whole genome transcript alterations in liver and muscle of rats with type 2 diabetes, and to identify common DEGs in both comparison pairs. Gene enrichment analyses were done to demonstrate that aberrant MAPK signaling pathways could be a part of the shared molecular mechanisms causing T2D.
Material & Methods
Thirty adult male Sprague–Dawley (SD) rats (200-220 g) were purchased from the Experimental Animal Institute of Nanchang University and used for inducing diabetes. This study was approved by the ethical committee of Nanchang University, Nanchang, PR China, and experiments were carried out in accordance with the institutional guidelines on the care and use of experimental animals. The animals were housed in standard metabolic cages (three rats/cage) and maintained under controlled room temperature (20-25°C) and humidity (40-70%) with a 12:12 h light and dark cycle. All rats had free access to commercial regular chow (consisting of 5% fat, 53% carbohydrate, and 23% protein) and water before the dietary manipulation for 1 wk. Streptozotocin (STZ) was purchased from Sigma (Sigma; St. Louis, MO, USA). The study was conducted in the department of Physiology, Medical College of Nanchang University, Nanchang, PR China.
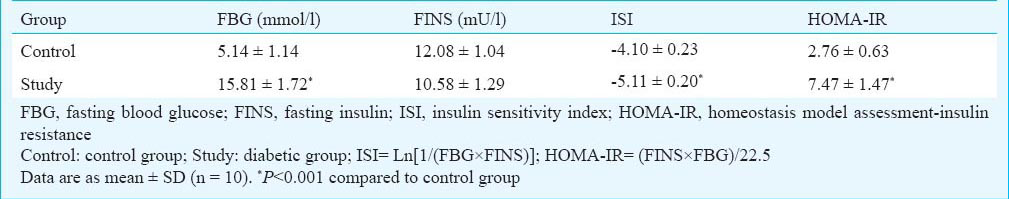
Rat model of type 2 diabetes: The experiments were carried out as previously described7. After one week of adaptation, fasting blood glucose (FBG) analysis was carried out when all the rats had fasted for 12 h. Thirty rats were randomly divided into two groups: control group (n=13) and study group (n=17). The control group was fed with regular chow, and the study group was given an in-house prepared high fat, high calorie diet (22% fat, 20% protein and 48% carbohydrate, 44.3 kJ/kg as a percentage of total kcal), for four weeks. After four weeks of dietary manipulation, FBG analysis was carried out after 12 h fasting. The study group animals were injected intraperitoneally (i.p.) with a low dose of STZ (30 mg/kg)8910, while the control rats were injected with vehicle (citrate buffer, pH4.4) in a dose volume of 0.25 ml/kg. After one week, the rats with an FBG < 7.8 mmol/l were injected with STZ (30 mg/kg) again. The FBG in all rats was tested every week. After four weeks of STZ injection, the rats with an FBG of ≥7.8 mmol/l twice or with random of ≥11.1 mmol/l were considered as type 2 diabetic rats7. The study period was two months. The rats (10 rats in each group) were fasted for 12 h; the FBG and the fasting serum insulin (FINS) were measured at the end of eight weeks. Insulin sensitivity index (ISI) and homeostasis model assessment-insulin resistance (HOMA-IR) index were calculated according to the FBG and FINS in each group711.
The oral glucose tolerance test (OGTT): OGTT was performed at the end of the experiment12. The rats to be tested were fasted for 12 h and then given 50 per cent D-glucose (Sigma) solution at a dose of 2.5 g/kg body weight by gavage. Blood samples were collected before (time 0) and 30, 60, and 120 min after the glucose overload from rat tail. The glucose responses during the OGTT were evaluated by the total areas under the curve for glucose (AUC glucose) using the trapezoidal method13 and the ORIGIN 6.0 software (Origin Lab Corporation, Northampton, UK).
RNA isolation: The liver and skeletal muscle samples were obtained from 10 animals per group, which were sacrificed four weeks after STZ injection. All samples were stored in RNAlater solution for RNA isolation. Total RNA was isolated using the Trizol reagent (Life Technologies, USA) according to the manufacturer's instructions and purified using RNeasy Protect Mini Kit (QIAGEN, Shanghai, PR China). RNA quality was determined with an Agilent 2100 Bioanalyzer (Agilent Technologies, USA).
cDNA microarray analysis: Pooled RNA from 10 animals in each group was reverse transcribed into cRNA and biotin-UTP labelled using the Illumina® TotalPrep RNA Amplification Kit (Ambion, Inc, Austin, TX, USA). Each biotinylated cRNA (750ng) was hybridized to a prototype Sentrix Rat Ref-12 Expression BeadChip containing 22,226 oligonucleotides (Illumina, Inc., San Diego, CA, USA). Individual hybridizations were performed for the skeletal muscle and liver RNA samples from both rat groups. Following washing and staining steps, the arrays were scanned on the Illumina® BeadArray Reader Illumina Inc., San Diego, CA, USA).
The gene expression datasets were processed and analyzed by BeadStudio Data Analysis Software (Illumina). Image data files were directly downloaded into BeadStudio for data visualization and analysis. BeadStudio executes differential gene expression analysis, which aims to detect changes in gene expression levels between the diabetic and control groups. The DiffScore was used to assess differences in gene expression between the two groups. DiffScores less than -20 or more than 20 (corresponding to a t-test P<0.01) of the control group were considered significant signal values for pair-wise comparisons.
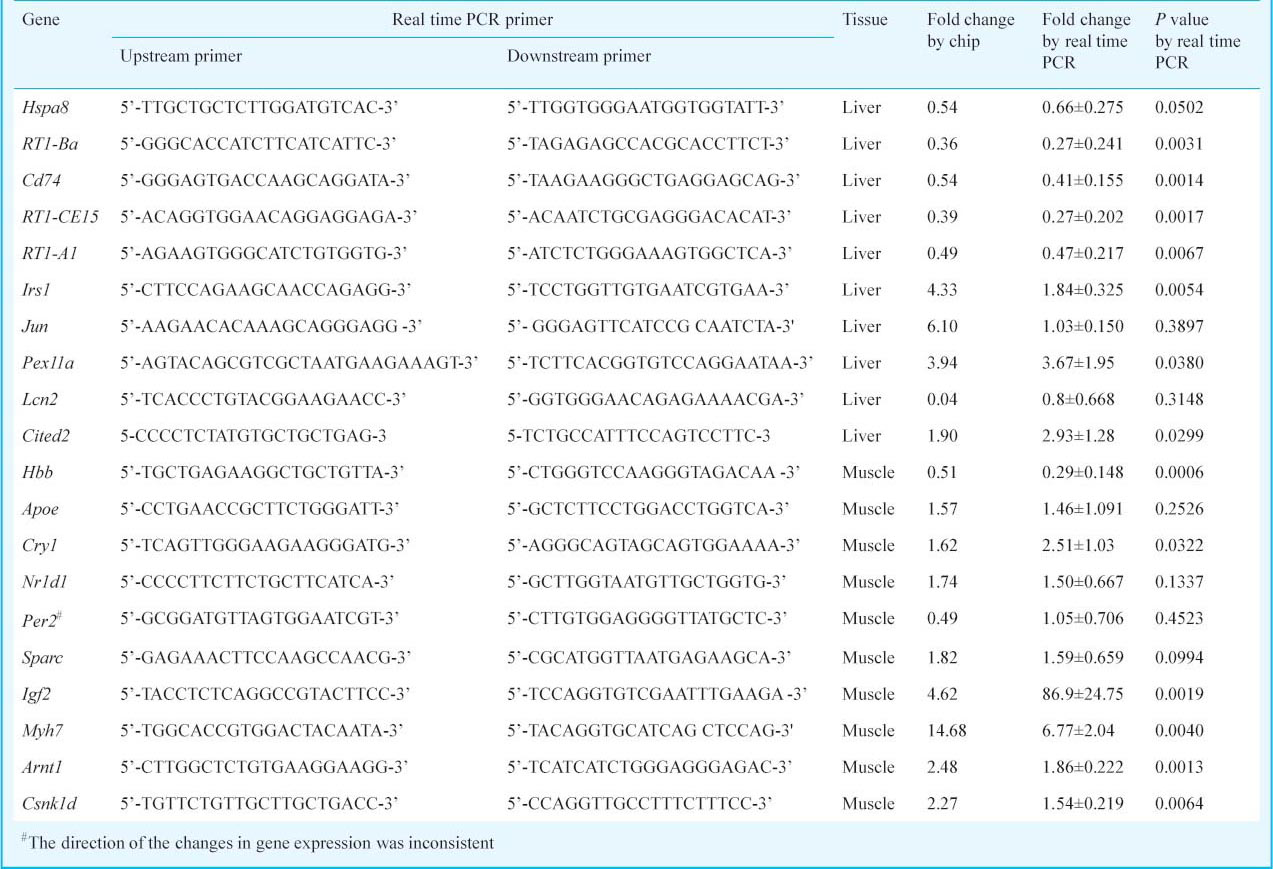
Real-time reverse transcription-PCR: To validate the DEGs identified by the microarray platforms, 20 genes (10 for skeletal muscle and 10 for liver) were randomly selected for quantitative real-time reverse transcription-PCR (QRT-PCR), as described previously14. Total RNA was prepared from the independent samples of the same groups that had been used for the expression arrays, and 3μg of total RNA were reverse transcribed to cDNA in a 100 μl reaction using the SuperScript™ First-Strand Synthesis System (Life Technologies, USA), according to the manufacturer's protocols. Real-time PCR was performed with oligonucleotides designed to span an intron/exon boundary (Table I) on an Applied Biosystems Prism 7500 Sequence Detection System using the Platinum SYBR Green qPCR SuperMix-UDG (Life Technologies). Individual experiments were performed on cDNA samples for each of the three replicates. Quantization was normalized to the expression of endogenous β-actin. The relative quantization value for each target gene was compared with the calibrator for that target using the 2-ΔΔCt method15.
Western blotting: The Western blotting experiments were carried out as previously described16, with minor modification. Liver and skeletal muscles (pooled samples from ten animals in each group) were homogenized in ice-cold lysis buffer (JRDUN Biotechnogy, Shanghai, PR China). The homogenate was centrifuged at 12000 x g for 15 min at 4°C for isolation of total supernatant protein. Protein concentration was determined with Pierce BCA Protein Assay Kit (Thermo Scientific Pierce Protein Biology Products, Rockford, IL, USA) according to the instructions of the manufacturer. Equal amounts of protein (20 μg/lane) from liver or skeletal muscle were separated on 10 per cent SDS-PAGE and transferred to a polyvinylidine fluoride membrane (0.45 μm, Immobilon-P transfer membrane, Millipore, USA). After blocking, the membranes were incubated overnight with a primary antibody for MAPK14 (1:200, ab7952; Abcam, Cambridge, UK), phospho-MAPK14 (1:1,000, 4631; Cell Signaling Technology, Beverly, MA, USA) in Tris-buffered saline with Tween 20 (TBST) containing 5 per cent non fat milk at 4°C. After washing in TBST, the membranes were incubated with horse radish peroxidase (HRP) conjugated goat anti-rabbit IgG (1:1,000, A0208; Beyotime Institute of Biotechnology, Beijing, PR China) for 1 h. The immunoreactive signals were developed using an enhanced chemiluminescence kit (Millipore, USA) and exposed to Kodak film. The relative and normalized protein expression was calculated by GAPDH (glyceraldehyde-3-phosphate dehydrogenase) (1:1,000, 2251-1, Epitomics, Burlingame, CA, USA).
Gene set enrichment analysis: DEGs over-representation analysis was performed based on the categories of gene ontology (GO, Biological Process)17 and the Kyoto encyclopedia of genes and genomes (KEGG)18. Three kinds of enrichment tools were used, with the following options: (i) at least four genes from the input list in the enriched category; and (ii) the significance threshold was set as an adjusted P value less than 0.001 for WebGestalt19 or Expander, or the recommended Bayes factor of GATHER larger than 320. Consistently over-represented gene sets were identified as categories that were judged to be considerably enriched by at least two enrichment tools.
Protein-protein interaction (PPI) networks reconstruction: The human protein-protein interaction (PPI) dataset was obtained from seven studies212223242526. The network involved 9,617 protein entries and 39,184 interactions. The sub-network related T2DM was constructed with human homologues of rat DGEs using Cytoscape (Cytoscape Consortium, USA), and displayed using an edge-weighted spring embedded layout.
Statistical analysis: The values were the mean of 3 replications. Differences between means were tested by t-test.
Results
Comparison of FBG, FINS and OGTT between diabetic and control groups at the end of 8 wk: As indicated by the fasting blood glucose (FBG), the study group rats showed overt hyperglycaemia. The FBG concentrations in the study group rats were higher than in control rats (P<0.001, Table II). To evaluate the insulin sensitivity and insulin resistance in rats, the FINS concentrations were measured, and the ISI and HOMA-IR were calculated (Table II). The ISI of study group was much lower than the control group (P<0.001), suggested that the insulin sensitivity was remarkably decreased in the study group compared to the control group. In addition, HOMA-IR was increased in the study group rats compared to control animals (P<0.001), which demonstrated the insulin resistance of diabetic rats.
Changes in the blood glucose levels during the OGTT are shown in Fig. 1. When challenged with an oral glucose load, blood glucose values of two groups reached maximum value by 60 min. The raised blood glucose values in control group returned to its corresponding near basal level by 120 min. However, the study group showed higher blood glucose value by 120 min compared to their corresponding basal level (P<0.05). No difference was observed in blood glucose concentrations between 120 and 0 min in the control group. In addition, study group showed significantly increased AUC glucose compared to control group (P<0.05) (Fig. 1). These results indicated that the study group model rats cleared the glucose from blood less efficiently than control animals.
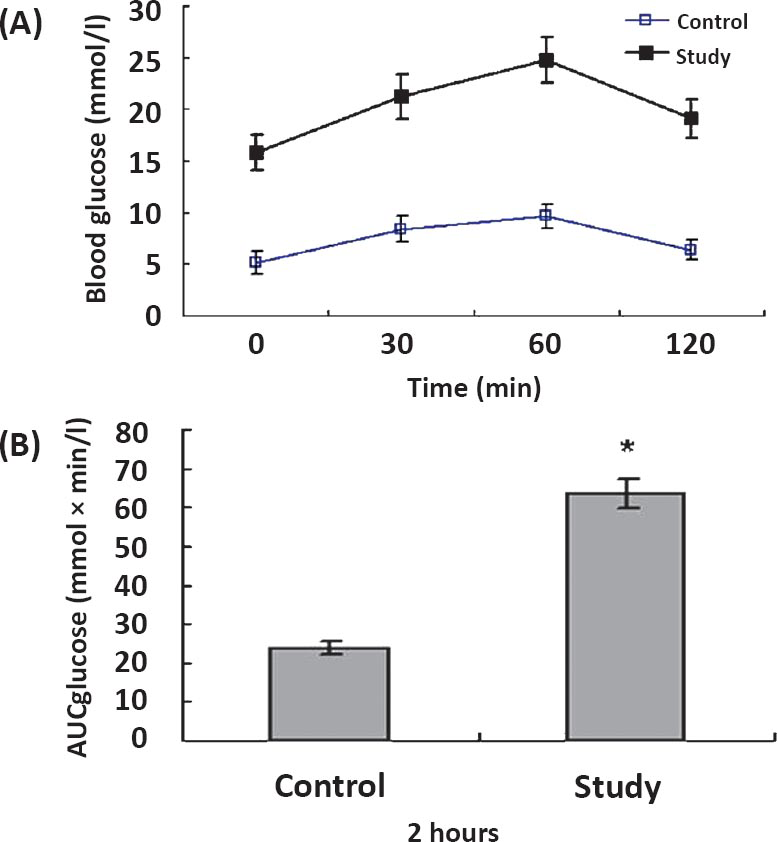
- The oral glucose tolerance test (OGTT) in two groups. Changes in the blood glucose levels (A) and area under the glucose curve (B) during the OGTT. Data are illustrated as mean±SD. (n = 10). *P<0.001 study group vs. control group.
Differentially expressed genes detected from skeletal muscle and liver tissues: To describe the changes of gene expression in skeletal muscle and liver tissues in response to hyperglycaemia, the expression profile of 22,226 transcripts across the rat genome was analyzed. A total of 9,929 transcripts showed significantly different expression signals compared with background in at least one tissue (Detected P<0.01). In comparison pairs from skeletal muscle, 16.0 per cent of the expressed genes (1,305/8,177) were defined as differentially expressed genes (DEGs) (P<0.01, Fig. 2A), of which 593 genes were upregulated, and 712 genes were downregulated. As shown in Fig. 2B, 997 DEGs (11.3% of 8,785 expressed genes) were identified in the liver, including 528 upregulated and 469 downregulated genes.
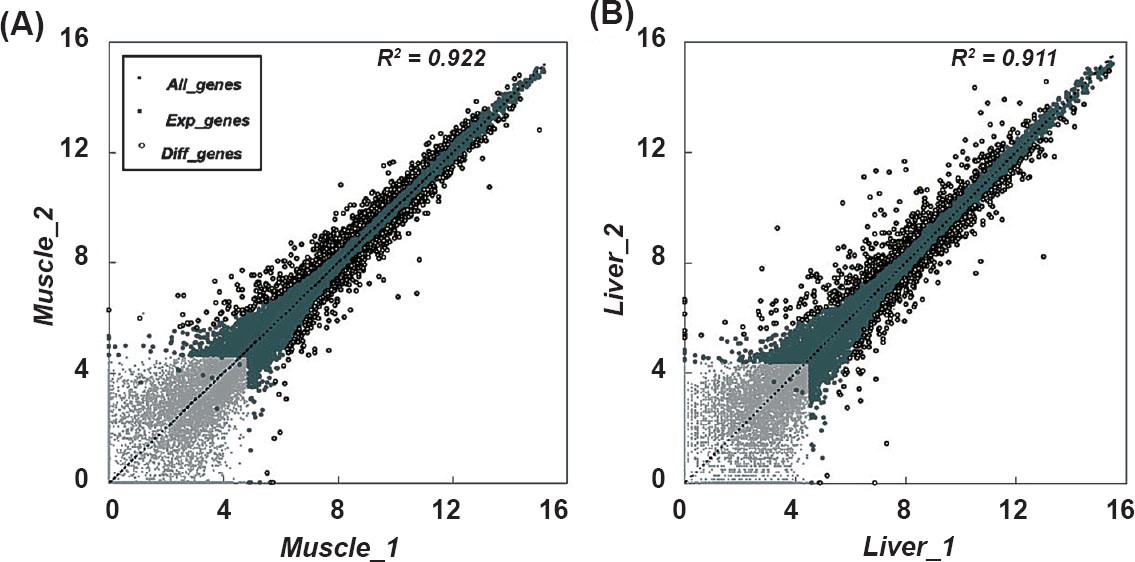
- Differential expression analysis in two comparison pairs. The scatter plot shows the gene expression level of DEGs against the background of all 22,226 transcripts for the diabetic (x-axis) and the control group (y-axis) from skeletal muscle (A) and liver (B).
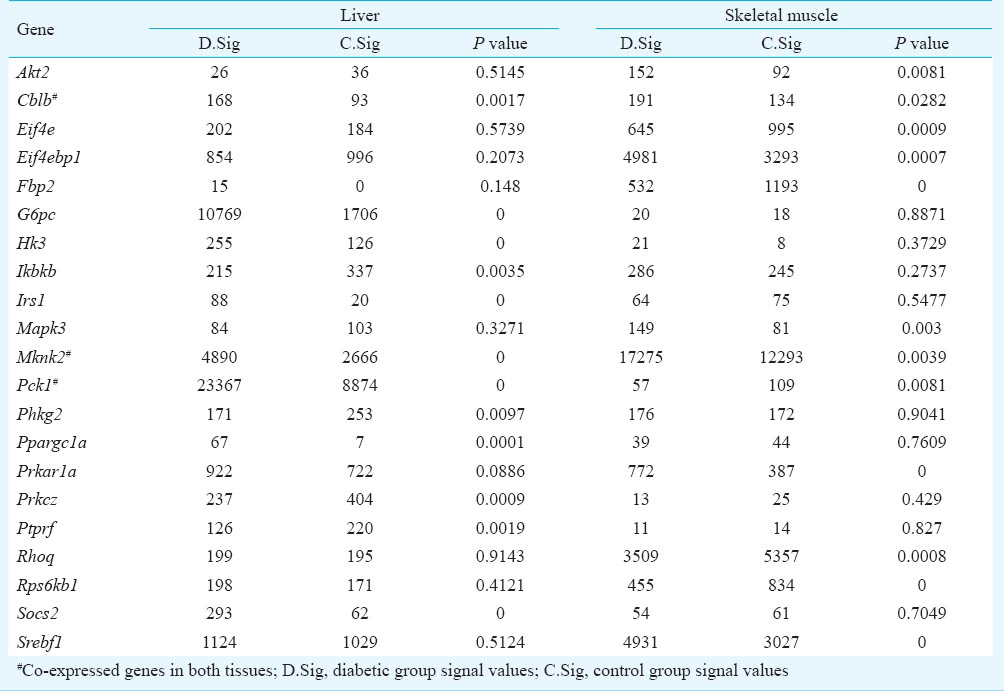
Among the DEGs, the expressions of genes known to respond to hyperglycaemia were dramatically altered in the two insulin-sensitive tissues. In the insulin signaling pathway, 22 DEGs were detected, including Fbp2, Prkar1a, Rps6kb1, Srebf1, Eif4ebp1, Rhoq, Eif4e, Mapk3, Mknk2, Akt2, and Pck1 in skeletal muscle, and Mknk2, Pck1, Hk3, Irs1, Socs2, G6pc, Ppargc1a, Prkcz, Cblb, Ptprf, Ikbkb in liver. Mknk2, Cblb, and Pck1 were identified as DEGs in both tissues (Table III). To confirm the microarray results, QRT-PCR was performed in a subset of 20 candidates chosen randomly. Among the DEGs listed in Table I, most candidates (19 genes) showed the same direction of change by QRT-PCR and by the expression arrays. Thirteen genes measured by QRT-PCR showed significant differences (P<0.05, Table I).
Most importantly, a large proportion of DEGs (~10%, 200/2,102) were shared by two comparison pairs. This number was over 1.5 times more than the expectation of each individual pair-wise comparison (131 genes, χ2 test, P<0.001). Among these common DEGs, 48 were upregulated (24%), and 52 (26%) were downregulated in both comparisons, which were also significantly larger than the corresponding numbers calculated by independent assumption (χ2 test, P<0.01). There were DEGs involved in the MAPK signaling pathway, such as Hspb1, Dusp1, Map2k6, Gadd45a, Mapk14, and Mknk2. These results suggested that liver and skeletal muscle may share a similar molecular mechanism of hyperglycaemia in T2D. Furthermore, protein expression was determined by Western blot. The expression of Mapk14 and phospho-MAPK14 in the liver was consistent with the microarray data. The expression of Mapk14 and phospho-MAPK14 in muscle was higher than in control animals, but no significant difference was observed (Fig. 3).
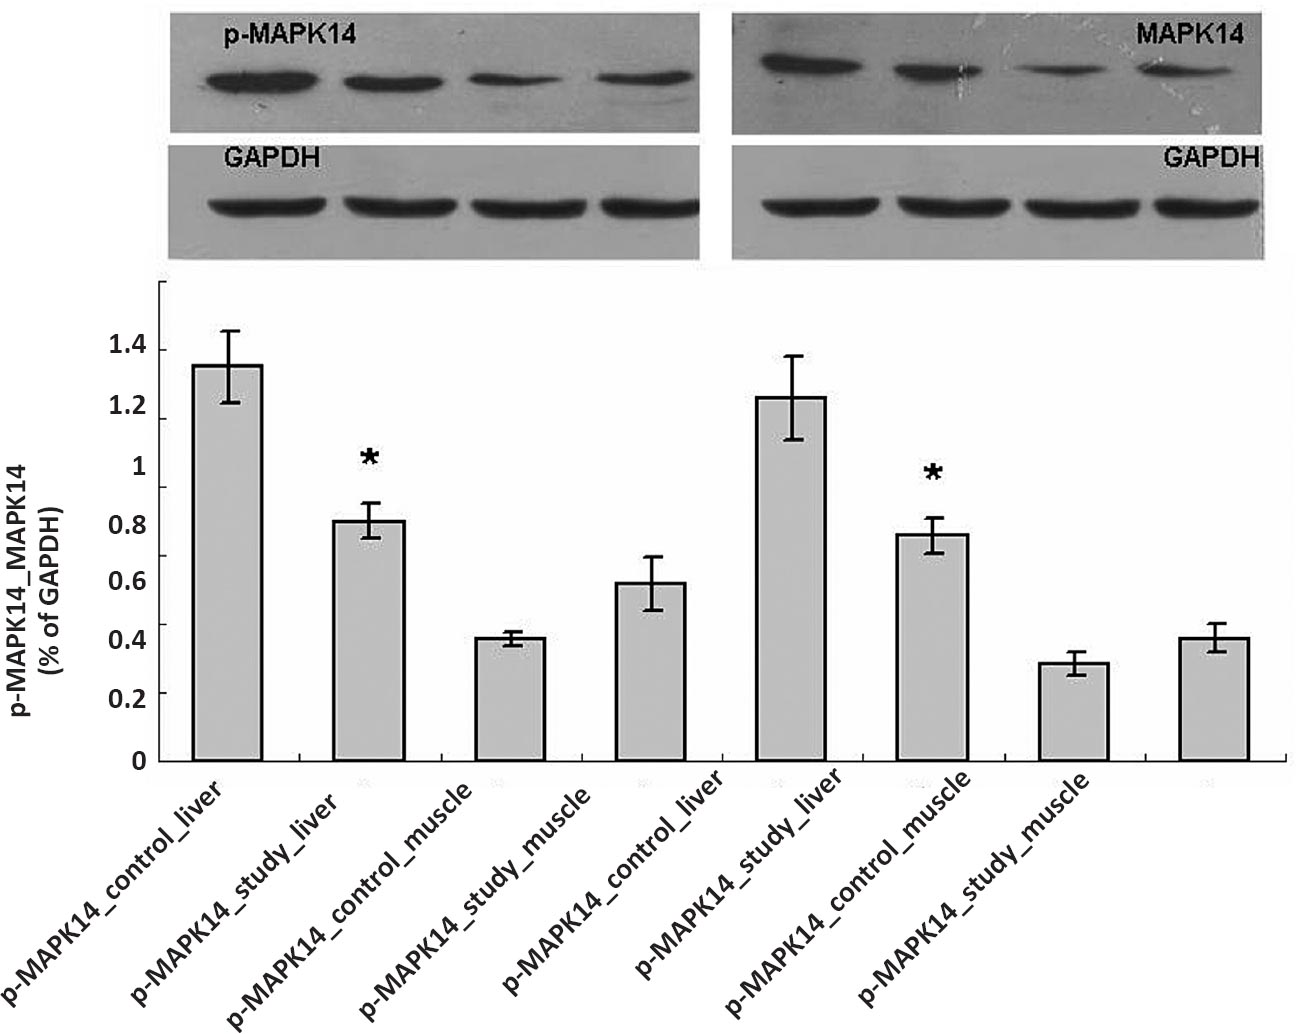
- MAPK14 protein expression in liver and muscle. Control, control group; Study, diabetic group; the values are mean ± SD (n = 3). *P<0.05 study group vs. control group; MAPK14, mitrogen-activated protein kinase 14; p-MAPK14, phospho - MAPK14; GAPDH, glyceraldehyde-3-phosphate dehydrogenase.
Enriched DEGs categories identified using pathway analysis: To better understand the molecular mechanisms underlying transcriptional changes, we obtained significantly over-represented DEGs categories (GO biological process or KEGG pathway) by gene enrichment analyses. Three tools (GATHER, Expander, and WebGestalt) were used, and only the categories detected by at least two methods were considered to be consistently enriched. Using this criterion, 22 and 31 GO biological processes were consistently over-represented by the DEGs from skeletal muscle and liver, respectively. Two categories (response to stress and cell death) were consistently detected by all three enrichment tools in both tissues (Fig. 4).
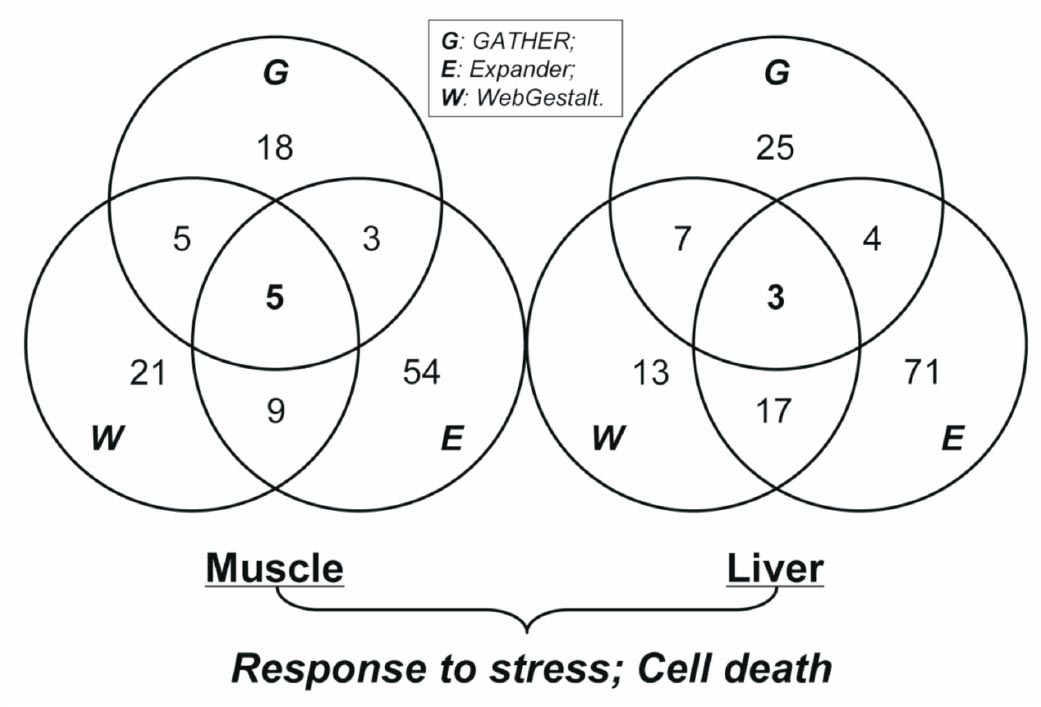
- Summary of DEGs enrichment analyses based on gene categories from GO biological process. For a particular comparison pair, the counts of over-represented DEGs category among three tools (GATHER, Expander, WebGestalt) are listed. The numbers in the circles indicate the existence of categories detected by at least one tool. The numbers in the intersection regions are those of enrichment categories shared across the tools. The consistent categories (cell death and response to stress) common in both two comparison pairs are presented below.
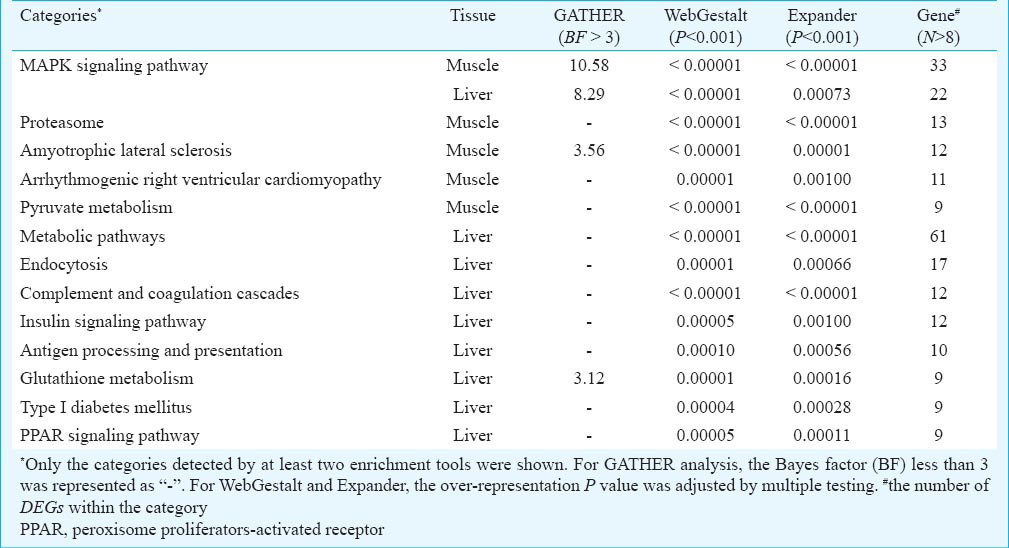
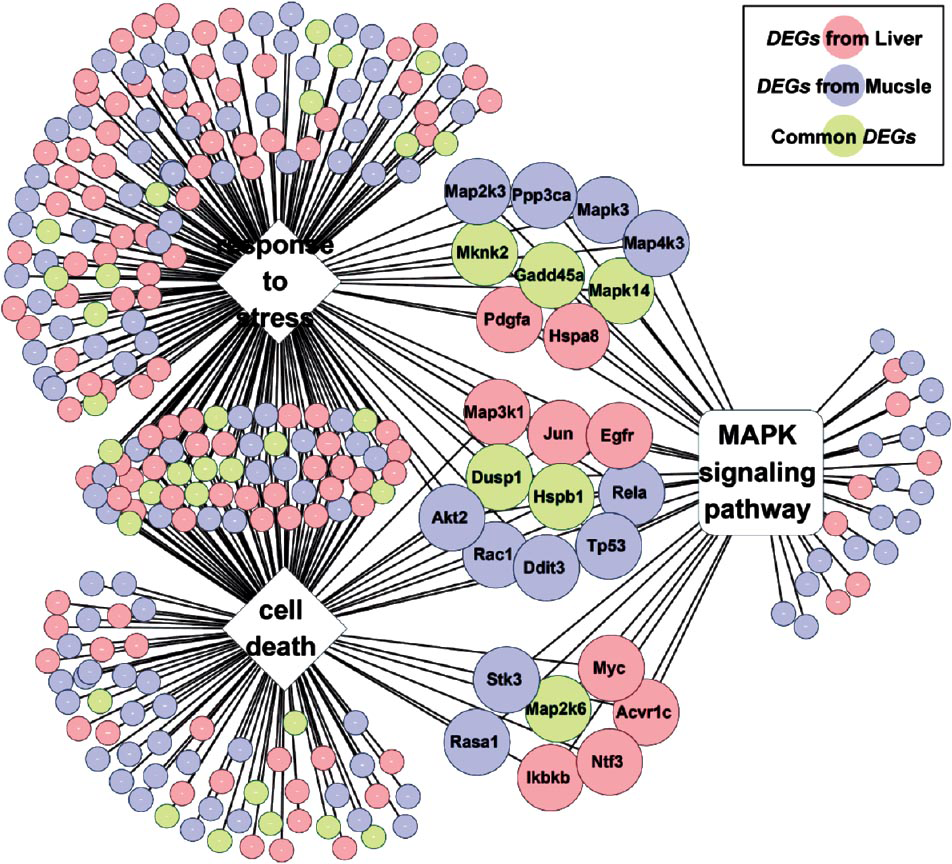
In addition, KEGG pathway analysis further supported the hypothesis that skeletal muscle and liver share the molecular mechanism in response to hyperglycaemia. As shown in Table IV, five and nine KEGG pathways were consistently over-represented by the DEGs from skeletal muscle and liver, respectively. Further, consistent with the common DEG analysis, the MAPK signaling pathway was the only category consistently detected by all three enrichment tools in both tissues. Many DEGs (26 genes) were shared by the MAPK signaling pathway and the two enriched GO biological processes (Fig. 5). For example, all six common DEGs (Hspb1, Dusp1, Map2k6, Gadd45a, Mapk14, and Mknk2) in the MAPK signaling pathway were involved in the biological processes of either “response to stress” or “cell death”. These results suggested that MAP kinases acted in a cascade to regulate cellular proliferation (“cell death”) in response to a variety of signals (“stress”).
- The shared pathway/ GO categories for DEGs from liver and skeletal muscle tissues. DEGs from skeletal muscle are shown as blue nodes, DEGs from liver are represented as pink nodes, while common DEGs appear as green nodes.
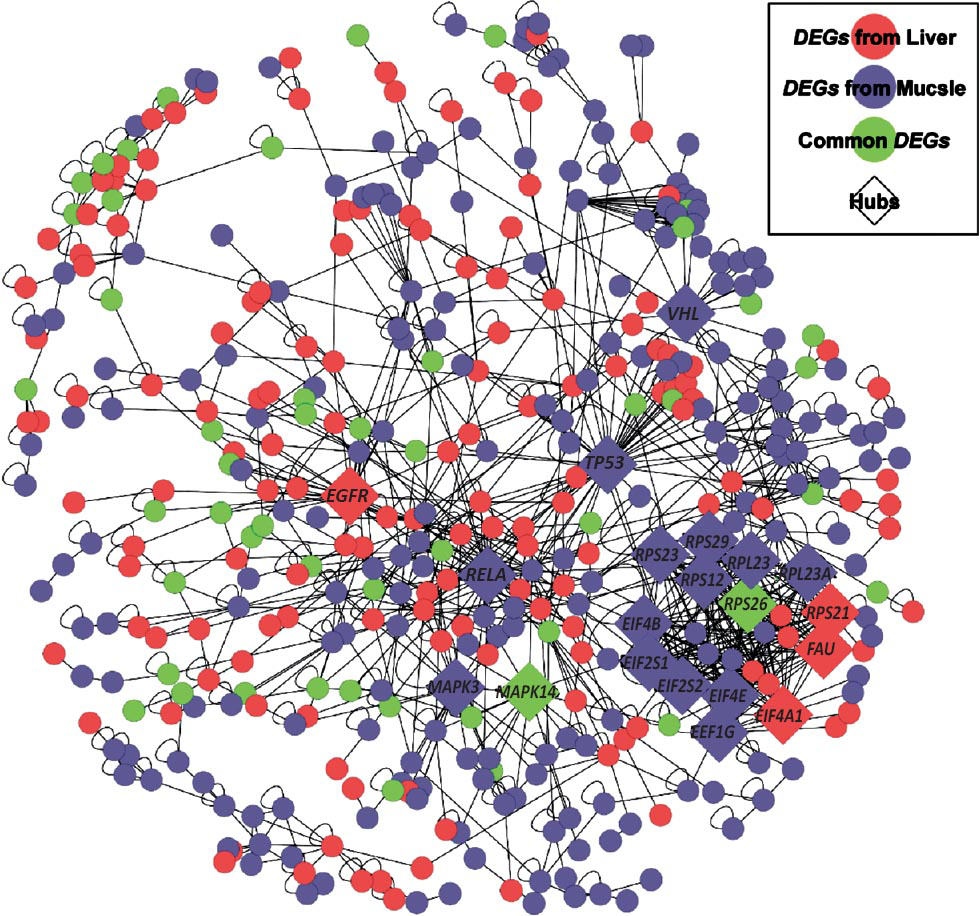
Hub DEGs revealed by a PPI Network: To verify the biological significance of pathway analyses, a PPI was constructed using 1,129 human homologues of all rat DEGs. According to an integrated dataset from seven studies161718192021, the resulting network comprised 490 homologues, including 236 and 311 homologues form liver and skeletal muscle, respectively. As shown in Fig. 6, the main component of network (MCN) comprised 422 homologues and 935 PPIs. The significant enrichment of 30 MAPK-related genes in the MCN (enrichment P<0.002) again suggested the important role of the MAPK signaling pathway in response to hyperglycaemia.
- Summary of protein-protein interactions (PPIs) among the human homologues of DEGs. Seven interaction datasets were integrated to generate the PPIs network. The network was constructed with Cytoscape, and displayed using an edge-weighted spring embedded layout. Only the homologues that showed a PPI are included. DEGs from skeletal muscle are shown as blue nodes, DEGs from liver are represented as pink nodes, while common DEGs appear as green nodes. Diamond shapes indicate the highly connected proteins (also known as hubs).
With 1,000 randomly generated networks of 490 homologues from the same dataset, we confirmed the presence of significantly more connected nodes and more edges in the MCN (both empirical P<0.001). These results have indicated that DEGs tend to form highly interacting modules. In addition, the proteins with at least 20 PPIs (corresponding empirical P<0.003) were defined as the highly connected proteins (or “hubs”), and 20 hubs were identified within the MCN. Consistent with the pathway analyses, the large proportion of MAPK-related hubs (5 of 20, including MAPK14, TP53, RELA, MAPK3, and EGFR) further confirmed the important role of MAPK signaling in the pathogenesis of T2D.
Discussion
In the present study, we reconstructed the altered transcript profiles based on samples from STZ-induced diabetic rats and control rats. The functional annotation for DEGs response to hyperglycaemia aided our understanding of the pathogenesis of T2D. For example, the presence of genes related to gluconeogenesis was defined as upregulated DEGs in liver comparisons, such as Pck1, Sds, Atf3, G6pc, and Tat. Among these DEGs, Pck1 is a main control point for the regulation of gluconeogenesis, and has been thought to be essential in glucose homeostasis. Previous researchers suggested that the transcription of this gene can be inhibited by insulin in the liver27, and overexpression of this enzyme in mice resulted in symptoms of type II diabetes mellitus. In skeletal muscle, significant downregulation of Akt2 implied the state of insulin resistance in STZ-induced diabetic rats. The protein encoded by Akt2 gene is an important signaling molecule in controlling the glucose homeostasis, and the genetic studies in mice revealed a central role for Akt2 in the insulin-induced glucose transport28. This hypothesis was further supported by the down-regulation of Slc2a4, which encoded the insulin-regulated glucose transporter (i.e. GLUT4 protein, data not shown).
The significantly aberrant MAPK signaling and the differential expression of the MAPK14 gene in both insulin-sensitive tissues suggested a common role of the p38-MAPK-dependent mechanism in the pathophysiology of T2D. The mitogen-activated protein kinase (MAPK) family includes a serial cascade that regulates various biological processes in response to a variety of cellular signals, such as insulin signaling26. Under normal physiological conditions, insulin exerts vasoconstrictive and mitogenic actions via the MAPK pathway30. Differential expression of p38 MAPK has been shown in skeletal muscle from different types of T2D models, such as Wistar fatty, GK and STZ rats31. Consistent with our results, previous studies based on biopsies of skeletal muscle suggested that the chronic activation of p38-MAPK signaling was implicated in the development of diabetes32.
In different comparison pairs, the expression patterns (up- or down-regulated) of MAPK-related genes depended on tissue type. Although this mechanism is not yet fully understood, p38-MAPK signaling, activated by oxidative stress, is thought to be associated with diminished insulin-dependent stimulation of insulin signaling elements and glucose transport activity33. This hypothesis is consistent with the large numbers of DEGs in the insulin signaling pathway identified in both target tissues. In addition, the annotation of MAPK-regulated DEGs could provide further insight into the role of this pathway in pathophysiology of T2D. As shown in the PIP network, six DEGs (Igf2, Ppargc1, Rps26, Spry2, Srebf1, and Th) were identified as promising risk genes for developing type1/2 diabetes by genome-wide or candidate-gene association studies34. Among these genes, Srebf1 and Ppargc1 are important transcription factors regulating glucose and lipid metabolism, and can be modified by p38-MAPK signaling35. Thus, our results suggested an important role for p38-MAPK signaling in response to hyperglycaemia in diabetes.
In conclusion, our findings indicated the considerably aberrant MAPK signaling in both skeletal muscle and liver from STZ-induced diabetic rats. The p38α, encoded by the Mapk14 gene, may play a role as a common “hub” in the gene module response to hyperglycaemia. Our results also provide the clue to pinpoint the role of several new T2D-associated genes (such as Srebf1 and Ppargc1) in the human population.
Acknowledgment
This work was funded by grants from the National Natural Science Foundation of PR China, a grant from the Technology Pedestal and Society Development Project of Jiangxi Province, and grants from the Natural Science Foundation of Jiangxi Province.
References
- Global gene expression profiles of subcutaneous adipose and muscle from glucose-tolerant, insulin-sensitive, and insulin-resistant individuals matched for BMI. Diabetes. 2011;60:1019-29.
- [Google Scholar]
- Gene expression profiles of nondiabetic and diabetic obese mice suggest a role of hepatic lipogenic capacity in diabetes susceptibility. Diabetes. 2003;52:688-700.
- [Google Scholar]
- Analysis of gene expression profiles in insulin-sensitive tissues from pre-diabetic and diabetic Zucker diabetic fatty rats. J Mol Endocrinol. 2005;34:299-315.
- [Google Scholar]
- Novel small molecule Raf kinase inhibitors for targeted cancer therapeutics. Arch Pharm Res. 2012;35:605-15.
- [Google Scholar]
- Mammalian mitogen-activated protein kinase signal transduction pathways activated by stress and inflammation. Physiol Rev. 2001;81:807-69.
- [Google Scholar]
- Role of mitogen-activated protein kinase pathway in reactive oxygen spe-cies-mediated endothelin-1-inducedβ-myosin heavy chaingene expression and cardiomyocyte hypertrophy. J Biomed Sci. 2005;12:123-33.
- [Google Scholar]
- The characterization of high-fat diet and multiple low-dose streptozotocin induced type 2 diabetes rat model. Exp Diabetes Res 2008 2008 704045
- [Google Scholar]
- Mangiferin mitigates diabetic cardiomyopathy in streptozotocin-diabetic rats. Can J Physiol Pharmacol. 2013;91:759-63.
- [Google Scholar]
- Effect of silymarin on streptozotocin-nicotinamide-induced type 2 diabetic nephropathy in rats. Iran J Kidney Dis. 2013;7:117-23.
- [Google Scholar]
- Exercise training prevents the development of cardiac dysfunction in the low-dose streptozotocin diabetic rats fed a high-fat diet. Can J Physiol Pharmacol. 2013;91:80-9.
- [Google Scholar]
- Dietary restriction, caloric value and the accumulation of hepatic fat. Lipids Health Dis. 2012;11:2.
- [Google Scholar]
- Contrast between cardiac left ventricle and diaphragm muscle in expression of genes involved in carbohydrate and lipid metabolism. Resp Physiol Neurobiol. 2008;161:41-53.
- [Google Scholar]
- Analyzing real-time PCR data by the comparative C(T) method. Nat Protoc. 2008;3:1101-8.
- [Google Scholar]
- Anti-diabetic effect of sorghum extract on hepatic gluconeogenesis of streptozotocin-induced diabetic rats. Nutr Metab (Lond). 2012;9:106.
- [Google Scholar]
- WebGestalt: an integrated system for exploring gene sets in various biological contexts. Nucleic Acids Res. 2005;33:W741-8.
- [Google Scholar]
- GATHER: A systems approach to interpreting genomic signatures. Bioinformatics. 2006;22:2926-33.
- [Google Scholar]
- The BioGRID interaction database: 2011 update. Nucleic Acids Res. 2011;39:D698-704.
- [Google Scholar]
- The database of interacting proteins: 2004 update. Nucleic Acids Res. 2004;32:D449-51.
- [Google Scholar]
- MINT, the molecular interaction database: 2009 update. Nucleic Acids Res. 2010;38:D532-9.
- [Google Scholar]
- The MIPS mammalian protein-protein interaction database. Bioinformatics. 2005;21:832-4.
- [Google Scholar]
- BIND: the biomolecular interaction network database. Nucleic Acids Res. 2003;31:248-50.
- [Google Scholar]
- Identification of a sequence in the PEPCK gene that mediates a negative effect of insulin on transcription. Science. 1990;249:533-7.
- [Google Scholar]
- Severe diabetes, age-dependent loss of adipose tissue, and mild growth deficiency in mice lacking Akt2/PKB beta. J Clin Invest. 2003;112:197-208.
- [Google Scholar]
- MAPK/ERK signaling regulates insulin sensitivity to control glucose metabolism in Drosophila. PloS Genet. 2011;7:e1002429.
- [Google Scholar]
- MicroRNA expression profiling in diabetic GK rat model. Acta Biochim Biophys Sin (Shanghai). 2009;41:472-7.
- [Google Scholar]
- Exercise, MAPK, and NF-kappa B signaling in skeletal muscle. J Appl Physiol. 2007;103:388-95.
- [Google Scholar]
- Critical role of the transient activation of p38 MAPK in the etiology of skeletal muscle insulin resistance induced by low-level in vitro oxidant stress. Biochem Bioph Res Commum. 2011;405:439-44.
- [Google Scholar]
- Twelve type 2 diabetes susceptibility loci identified through large-scale association analysis. Nat Genet. 2010;42:579-89.
- [Google Scholar]
- Preventing phosphorylation of sterol regulatory elementbinding protein 1a by MAP-kinases protects mice from fatty liver and visceral obesity. PloS One. 2012;7(2):e32609.
- [Google Scholar]


