
Translate this page into:
Visceral adipose tissue for predicting severe acute pancreatitis
Present address: #DRM Multi Speciality Hospital, Mysuru, Karnataka, India
†Chintamani Hospital, Jalgaon, Maharashtra, India
$AIMS Hospital, Dombivli, Maharashtra, India
For correspondence: Dr Sukanya Bhrugumalla, Department of Medical Gastroenterology, Nizam’s Institute of Medical Sciences, Hyderabad 500 082, Telangana, India e-mail: sukubee1992@yahoo.co.uk
-
Received: ,
Abstract
Background & objectives
Acute pancreatitis (AP) is a well known gastrointestinal cause of hospital admissions. There is a proven association between the severity of AP and obesity due to increased rates of local complications, multiple organ failure and mortality. Increased visceral adiposity is reported to be a better predictor of severe pancreatitis than body mass index (BMI) in many studies. This study aimed to assess the relationship between visceral adiposity and the severity of AP by measuring the visceral adipose tissue (VAT) area.
Methods
This single-centre, prospective study was conducted on consecutive individuals admitted with AP. The severity of AP was correlated with the VAT area, as estimated between 48 and 72 h of admission.
Results
Seventy-four individuals with AP were recruited during the study period. The overall study cohort’s mean±SD for VAT area was 128.06±34.22 cm2. The VAT area was significantly larger in individuals with severe pancreatitis (141.01±33.75cm2) than in those with mild or moderate pancreatitis (115.11±29.85 cm2). The sensitivity, specificity and area under the receiver operating characteristics (AUROC) of VAT were 78.4 per cent, 54.1 per cent and 0.722 in predicting severe AP, respectively.
Interpretation & conclusions
There is a significant association between severe AP and VAT. With the worldwide increase in obesity incidences, incorporating VAT into one of the prognostic indices for AP needs to be further explored.
Keywords
Acute pancreatitis
body mass index
obesity
prognostic scores
severity
visceral adipose tissue

Acute pancreatitis (AP), a potentially fatal disease which, ranges in severity from a mild, self-limited disease to a rapidly progressive, severe disease that results in multiple organ failure (MOF) and death. Most cases of AP are self-limiting and mild; 30 per cent of cases are moderately severe and around 10 per cent are severe, as per the 2012 revision of the Atlanta classification1.
Obesity, a rapidly growing lifestyle epidemic, brings with it a rising incidence of obesity-associated diseases like gallstones, which is now the commonest cause of pancreatitis worldwide2. Apart from this, many studies have also proven the association of obesity [body mass index (BMI) >30 kg/m2] with the severity of acute pancreatitis due to increased local complications, multiple organ failure and mortality3,4. A new composite score, APACHE O, which included BMI and Acute Physiology and Chronic Health Evaluation (APACHE II) parameters, has shown greater predictive accuracy5. Subsequently, further studies that analyzed the effect of obesity, concluded that the abdominal adiposity [using waist circumference] and not the total adiposity (measured using BMI) was an independent risk factor for the development of acute pancreatitis6. Increased visceral adipose tissue (VAT) area, an objective marker for abdominal obesity, has been studied as a predictor of severe pancreatitis in a few studies7-9.
Obese individuals reportedly have high circulating levels of tumour necrosis factor-alpha (TNF-α); interleukin (IL)- 6, 8, 10 and 15, plasminogen activator inhibitor-1 (PAI-1) and C-reactive protein (CRP)10,11. The inflammatory response in AP is amplified by this hyper-inflammatory phenotype, predisposing to the development of systemic inflammatory response syndrome (SIRS) and organ dysfunction in AP12. Obesity also leads to an increase in local complications in acute pancreatitis, which further leads to an amplification of immunological activity. Unsaturated fatty acids generated by the lipolysis of visceral fat by pancreatic lipases convert the mild acute pancreatitis to a severe form acute pancreatitis, independent of pancreatic necrosis13. With an increased volume of peripancreatic fat in obese individuals, there is an increase in adipokine release during local parenchymal as well as fat necrosis.
Computed tomography (CT) as well as and magnetic resonance imaging (MRI) are considered the gold standard methods for the evaluation of intra-abdominal adipose tissue and subcutaneous adipose tissue (SAT)14. In clinical trials, CT has been considered to be the most reproducible and accurate method for body fat measurement15. The window width defining fat tissue varies from –190 to –30 HU16. According to Linder et al17, the best correlation with VAT volume in males is seen at L2–L3, in females at L3–L4 and in the morbidly obese at L1–L2.
Indians have a unique body habitus characterised by low lean mass combined with ‘central or visceral obesity’ in comparison to Caucasians for the same BMI, hence, the role of BMI in predicting the severity of AP becomes all the more controversial. Studies on the impact of VAT on the severity of pancreatitis in the Indian population are lacking. The present study was undertaken to study the relationship between the severity of acute pancreatitis and the VAT area.
Material & Methods
This was a prospective study that was conducted on individuals admitted with acute pancreatitis (mild, moderate and severe) between December 2017 and December 2018 in the Department of Medical Gastroenterology, Nizam’s Institute of Medical Sciences, Hyderabad, Telangana. This study was approved by the Institutional Ethics Committee.
As the primary objective of the study was to compare the mean VAT area between mild/moderate and severe pancreatitis, the sample size formula for comparing the two means was applied using the online calculator www.openepi.com. To calculate the sample size, a study by Yashima et al9 was used. The mean ± SD of VAT area in the mild pancreatitis group in their study was 103.3±54.6 cm2 and in the severe pancreatitis group was 145.6 ± 72.8 cm2. Keeping α error at 0.05 and β error at 0.8, the sample size was calculated as 74 (37 individuals per group). The statistics of previous years in our hospital and unpublished data from our centre were looked into and after ascertaining that such a sample size is feasible and adequate, it was finalized.
The diagnosis of AP was made as per the American College of Gastroenterology guidelines2 and the severity of AP was assessed using the revised Atlanta classification1 as (i) Mild pancreatitis: no organ failure, no local or systemic complications, (ii) Moderate pancreatitis: Transient organ failure (<48 h). Local or systemic complications without persistent organ failure, (iii) Severe pancreatitis: Persistent organ failure (>48 h), single or multiple.
Inclusion criteria
Consecutive individuals aged >18 yr with acute pancreatitis who underwent a CT scan of the abdomen within 48-72 h of admission were recruited after procuring a written and informed consent.
Exclusion criteria
Individuals were excluded if (i) age was less than 18 yr, (ii) presence of chronic pancreatitis, (iii) non-availability of a CT scan within 72 h of admission, (iv) pregnant women, (v) associated comorbid illnesses like chronic kidney disease, coronary artery disease, human immunodeficiency virus infection, cirrhosis, thyroid disorders, use of oral retinoids, systemic corticosteroids, anti-obesity drugs, (vi) history of any malignancy, or (vii) any major surgery within the past 30 days.
Severity assessment
BMI was measured for all study participants. Modified Marshall scoring system18 was used to define organ failure, calculated based on PaO2/FiO2, serum creatinine and systolic blood pressure. A score of 2 or more in any system-defined organ failure. The presence of two or more organ failures was defined as multiple organ failure (MOF). Blood urea nitrogen (BUN), haematocrit (HCT) and bedside index of severity in acute pancreatitis (BISAP) were calculated within 12 h of hospital admission. APACHE II score was calculated at admission and at 48 h using 12 evaluation parameters and an extra score based on age and the presence of chronic disease. CRP was obtained 24 h after the admission. A non-contrast and/or contrast-enhanced CT scan was done for the individuals presenting with acute pancreatitis between 48 and 72 h of admission, from which VAT and SAT areas were calculated. The modified CT severity index was calculated on the contrast-enhanced CT scan done after 48 h where available.
Measurement of VAT and SAT
A multidetector computed tomography (MDCT) was performed (Siemens Definition 128 slice CT, Germany) with a section width of 5 mm using the parameters 120 kV, 250 mAs/slice and FOV (field of view) of 300 mm. In cases of deranged renal parameters, the assessment was done on a plain CT scan. The total cross-sectional area of VAT was measured at L2-L3 or L3-L4 intervertebral spaces for males and females, respectively. These are proven accurate surrogates for total VAT volume. SAT area was measured at L3-L4 intervertebral space for both males and females17.
For calculation and analysis, an area/standard deviation (SD) tool was selected and a region of interest (ROI) was manually delineated along the muscles that make up the internal portion of the abdominal wall. Small and large bowel loops, kidneys, vertebral bodies, paravertebral muscles and other viscera were eliminated from this area of interest and the amount of adipose tissue was quantified using an attenuation range of –190 to –30 HU, from which the VAT area was derived (Supplementary Fig. 1)
For SAT, an ROI was obtained by manually drawing along the skin, encompassing the entire cross-sectional image of the abdomen and another line drawn along the innermost portion of the abdominal wall muscles. Within this ROI, the area of SAT was estimated using an attenuation range of –190 to –30 HU after excluding the abdominal wall muscle tissue Supplementary Fig. 2).
VAT and SAT parameters were calculated by a radiologist, which were further validated by a senior and experienced radiologist.
All participants with acute pancreatitis who were included in the study were followed until their death or 30 days after discharge from the hospital.
Statistical analysis
Statistical Product and Service Solutions (SPSS) version 2.0 software (IBM, Corp., NY, USA) was used for database management and statistical analysis. For normally distributed data, mean and standard deviation were calculated. For non-normal distribution, median and inter-quartile ranges (IQR) were used for description. A comparison of two independent variables with a normal distribution was performed using the student’s t test, and independent variables with a non-normal distribution using the Mann-Whitney U test. A P value <0.05 was considered as significant. The area under the receiver operating characteristics (AUROC) was computed to assess the predictive value of VAT, SAT, BMI, BISAP and APACHE-II in assessing severity. Optimal cut-off values/scores were obtained from ROC curves and sensitivity, specificity, positive predictive value (PPV) and negative predictive value (NPV) of each parameter/score were calculated from the cut-off point obtained.
Results
A total of 74 individuals (54 males, mean age of 38.97±13.02 yr) were enrolled. Of the 74, 15 had mild, 22 had moderately severe and 37 had severe pancreatitis. Eleven participants with severe pancreatitis expired during hospitalization. For the purpose of analysis, those with mild and moderately severe pancreatitis were grouped together. Of the total participants, 11 (14.86%) got re-admitted due to complications within 30 days of their discharge, five (6.8%) with pseudocyst, three (4.1%) with infected necrosis and three (4.1%) with walled-off necrosis. All but one re-admission was in the severe pancreatitis group (Supplementary Fig. 3)
Alcohol was the predominant etiologic cause in 51 (68.92%) participants, followed by biliary in 13 (17.57%), unknown causes in five (6.76%) and hypercalcemia in two (2.7%). Hereditary pancreatitis, hypertriglyceridemia and pancreas divisum contributed one (1.35%) each, as etiologic factors. There was no significant difference in the age and sex distribution between the mild/moderate and the severe group. Clinically, individuals with severe AP had a significantly higher pulse and respiratory rate. Baseline investigations showed significantly higher haematocrit, leucocytosis, BUN and creatinine in severe pancreatitis (Table I).
| Mild/moderate pancreatitis (n=37) | Severe pancreatitis (n=37) | P value | |
|---|---|---|---|
| Age (in yr), mean±SD | 37.95±13.14 (19–70) | 40±12.9 (19–74) | 0.63 |
| Males; n(%) | 25 (67.57) | 29 (78.38) | 0.29 |
| Alcohol; n(%) | 18 (48.65) | 33 (89.19) | 0.0003 |
| Biliary; n(%) | 9 (24.32) | 4 (10.81) | 0.221 |
| Pulse (beats per min), mean±SD | 107.89±9.39 | 122.14±9.7 | <0.001 |
| RR cycles (per minute), median (IQR) | 20 (18–22) | 26 (25–30) | <0.001 |
| Hct (%), mean±SD | 41.19±6.22 (30–56.9) | 48.05±6.71 | <0.001 |
| TLC (cells/mm3), median (IQR) | 9800 (8150–13300) | 17700 (12100–23700) | <0.001 |
| BUN (mg/dL), median (IQR) | 13 (10–17.4) | 24.6 (15.51–58.41) | <0.001 |
| Serum creatinine (mg/dL), mean±SD | 0.98±0.24 | 3.21±2.8 | <0.001 |
RR, respiratory rate; Hct, haematocrit; TLC, total leukocyte count; BUN, blood urea nitrogen; SD, standard deviation; IQR, interquartile range
All the prognostic indices had a significantly higher value in the severe pancreatitis group compared to the mild/moderate pancreatitis group (Table II).
| Parameter | Mild/moderate pancreatitis | Severe pancreatitis | P value |
|---|---|---|---|
| BMI (kg/m2); median (IQR) | 24.4 (23–26) | 26.2 (24–28) | 0.004 |
| VAT (cm2); mean±SD | 115.11±29.85 | 141.01±33.75 | 0.001 |
| SAT (cm2); median (IQR) | 120 (103.50–168.25) | 154 (106.5–189) | 0.025 |
| BISAP score >2; n(%) | 2 (5.4) | 20 (54.05) | <0.001 |
| Admission APACHE-II score; median (IQR) | 4 (2–8) | 14 (9–20) | <0.001 |
| 48 h APACHE-II score; median (IQR) | 2 (0–6) | 14 (8–20) | <0.001 |
| MCTSI; median (IQR) (range) |
6 (2–8) (2–10) |
10 (8–10) (6–10) |
0.001 |
| CRP (mg/dl); median (IQR) (range) |
12 (6–12) (4–60) |
36 (18–48) (6–60) |
0.001 |
BMI, body mass index; VAT, Visceral adipose tissue; SAT, subcutaneous adipose tissue; BISAP, bedside index of severity in acute pancreatitis; APACHE-II, acute physiology and chronic health evaluation-II; MCTSI, modified CT severity index; CRP, c-reactive protein
Out of 74 participants with acute pancreatitis, MCTSI could be analysed only for 55 (18/37 had severe pancreatitis), as in the rest of the samples, contrast-enhanced CT scans could not be done due to deranged renal parameters. The admission APACHE score had the highest sensitivity (91.9%) and 48 h APACHE score, the highest specificity (97.3%) for severity prediction. VAT area with a sensitivity of 78.4 per cent scored better than BMI, which had a sensitivity of 70.3 per cent. SAT area with a sensitivity and specificity of 67.6 per cent and 59.5 per cent, respectively, did not fare well relatively in predicting severe pancreatitis (Table III).
| Parameter | Cut-off value | Sensitivity (%) | Specificity (%) | PPV (%) | NPV (%) | AUROC |
|---|---|---|---|---|---|---|
| BMI (kg/m2) | 24.7 | 70.3 | 54.1 | 60.5 | 64.5 | 0.693 |
| VAT (cm2) | 114.69 | 78.4 | 54.1 | 63 | 71.4. | 0.722 |
| SAT (cm2) | 125.09 | 67.6 | 59.5 | 62.5 | 64.7 | 0.652 |
| BISAP | >2 | 54.1 | 94.6 | 90.9 | 67.3 | 0.891 |
| Admission APACHE-II | ≥8 | 91.9 | 73 | 77.3 | 90 | 0.928 |
| 48 h APACHE-II | ≥8 | 86.5 | 97.3 | 97 | 87.8 | 0.970 |
| MCTSI | 8 | 94.4 | 67.6 | 58.6 | 96.2 | 0.866 |
| CRP (mg/dl) | ≥21 | 73 | 86.5 | 84.4 | 76.2 | 0.877 |
AUROC, area under receiver operating characteristics; PPV, positive predictive value; NPV, negative predictive value
Among the various parameters that were assessed for predicting severe pancreatitis, the APACHE II score at 48 hours fared the best with an AUROC of 0.97. All the scoring systems that use multiple parameters in prediction fare better than individual indices. VAT had an AUROC of 0.722 for the prediction of severity (Figure).
A larger VAT area increased the odds of developing severe pancreatitis but not MOF, mortality and 30-day readmission. The association between the severity of pancreatitis and VAT remained positive even after adjusting for age and alcohol aetiology (Table IV).
| Outcomes | Unadjusted OR (95%CI) | P value | OR adjusted for age and alcohol aetiology (95%CI) | P value |
|---|---|---|---|---|
| Severe pancreatitis | 1.026 (1.009–1.042) | 0.002 | 1.024 (1.006–1.042) | 0.009 |
| Multisystem OF | 1.017 (0.998–1.037) | 0.078 | 1.017 (0.997–1.038) | 0.096 |
| Mortality | 0.983 (0.964–1.002) | 0.086 | 0.987 (0.967–1.007) | 0.2 |
| 30-days re-admission | 1.013 (0.993–1.032) | 0.205 | 1.007 (0.998–1.027) | 0.444 |
OF, organ failure
Discussion
Obesity is a prominent risk factor behind the severity of acute pancreatitis. A meta-analysis of 739 individuals concluded that obese individuals (BMI ≥30 kg/m2), when compared to non-obese counterparts, had higher odds of developing severe acute pancreatitis (SAP) (OR 2.9, 95% CI: 1.8–4.6), systemic (OR 2.3, 95% CI: 1.4–3.8), and local complications (OR 3.8, 95% CI: 2.4–6.6), and mortality (OR 2.1, 95% CI: 1–4.8)19. However, subsequent studies have shown visceral adiposity to be a better predictor of severity when compared to obesity as measured using BMI7-9. VAT area is a proven surrogate marker for the measurement of visceral adiposity. In this study, we showed an association between VAT and the severity of acute pancreatitis. However, unlike the study by Natu et al8, this study could not demonstrate the association of VAT with MOF and 30-day re-admission. This discrepancy against the association with severe pancreatitis can be explained by the fact that even a single organ failure can be considered as severe pancreatitis as per the revised Atlanta classification1.
The predictive value of VAT (AUROC: 0.722) in this study was higher than BMI (0.693) and SAT (0.652) in severe AP, implying that it is visceral fat, rather than whole body fat or subcutaneous fat, which is a predictor of severe pancreatitis. Though BMI has the advantage of being a clinical measure that can be easily estimated, it cannot distinguish between fat, muscle and bone, thus making it suboptimal for the assessment of adiposity. Similar results were seen by Natu et al8, where BMI had an AUROC of 0.63 for predicting severe acute pancreatitis as against an AUROC of 0.71 for VAT. In a propensity score-matched analysis by Xie et al20, VAT had the highest AUROC of 0.943.
Unregulated lipolysis of visceral fat, which is enriched with triglycerides, leads to the release of unsaturated fatty acids which inturn inhibit mitochondrial complexes, causing further necrosis in necrotising pancreatitis21. This process culminates in the release of damage-associated molecular patterns (DAMPs) and the exacerbation of inflammatory response, leading to the release of various mediators such as IL-6, IL-1β and TNFα. A large VAT volume leads to a greater degree of inflammatory cytokine production in pancreatitis and an increased risk of local complications. O’Leary et al22 showed a significant association between visceral fat volume and the severity of pancreatitis. (p=0.003).
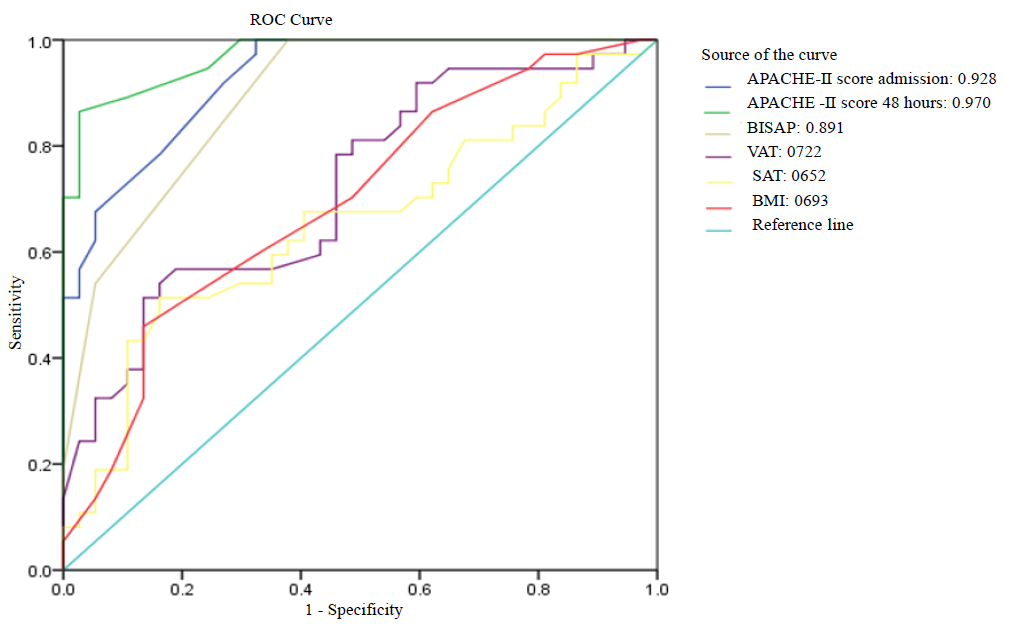
- ROC curve of various parameters/indices in predicting severe acute pancreatitis.
A recent systematic review of 11 studies by Kuan et al23 demonstrated that VAT is an important prognostic indicator of the severity of acute pancreatitis23. In a study by Yoon et al24, individuals with severe pancreatitis had a higher VAT area of 184±81 cm2 compared to mild/moderate pancreatitis 105±70 cm2 (P<0.001). Yashima et al9, who studied the association between VAT and severe pancreatitis, also found a significant difference in VAT area between mild (102.2 cm2) and severe pancreatitis (149.5 cm2), P<0.001.
The utility of multi-parameter severity scores like BISAP and APACHE II in predicting the severity of AP is already well proven. In the present study also, APACHE-II at 48 hours fared better than all other parameters in predicting the severity of acute pancreatitis (AUROC: 0.97). Cho et al25 also found significantly higher APACHE-II scores in SAP (10.8±4.8) compared to mild/moderate AP (6.5±3.5), (P<0.001). Natu A et al8 found that the addition of VAT area to BISAP (AUROC:0.83) increased the predictive value of severe AP as against BISAP (AUROC:0.8) and VAT (AUROC: 0.71) alone. Similarly, the addition of APACHE II to VAT may further increase the predictive value of severe acute pancreatitis.
The initial studies published analyzing the association of visceral fat with the severity of pancreatitis are retrospective8,9,22,24, whereas this study is one of the few prospectively conducted studies demonstrating an association of VAT with severe acute pancreatitis.
This study is not without limitations.. Subcutaneous oedema and intra-abdominal oedema are often seen in individuals with severe acute pancreatitis. This could obscure the underlying VAT, leading to an underestimation of the VAT area and thereby its correlation with the outcome. VAT was calculated using automated software in all the previous studies. However, due to a lack of automated software, we calculated the ROI of VAT manually, which could have led to subjective error. Also, there could be a likelihood of skew considering the fact that the study had a higher proportion of consecutive participants with severe pancreatitis as it was conducted in a referral hospital.
In conclusion, obesity, specifically visceral obesity, is an important risk factor for the development of severe acute pancreatitis. The use of CT scans for the estimation of visceral adiposity is well known, however, its use as a single parameter for the prediction of severity in acute pancreatitis is still being evaluated. We feel an ideal prognostic score for acute pancreatitis should be a single one score that combines components of multi-parameter scoring systems like APACHE-II or BISAP with VAT area. Further studies with a larger sample size are needed to confirm this and also to study other outcomes like mortality and readmission rates.
Financial support & sponsorship
None.
Conflicts of Interest
A part of the findings of this study were presented at Asia Pacific Digestive Week (APDW) 2019 and the presented abstract was published in Journal of Gastroenterology and Hepatology (https://onlinelibrary.wiley.com/doi/full/10.1111/jgh.14865).
Use of artificial intelligence (AI)-assisted technology for manuscript preparation
The authors confirm that there was no use of artificial intelligence (AI)-assisted technology for assisting in the writing of the manuscript and no images were manipulated using AI.
References
- Classification of acute pancreatitis-2012: Revision of the Atlanta classification and definitions by international consensus. Gut. 2013;62:102-11.
- [CrossRef] [PubMed] [Google Scholar]
- AGA Institute medical position statement on acute pancreatitis. Gastroenterol. 2007;132:2019-21.
- [CrossRef] [PubMed] [Google Scholar]
- The impact of obesity on the course and outcome of acute pancreatitis. Obes Surg. 2008;18:326-8.
- [CrossRef] [PubMed] [Google Scholar]
- The clinical relevance of obesity in acute pancreatitis: Targeted systematic reviews. Pancreatol. 2015;15:25-33.
- [CrossRef] [PubMed] [Google Scholar]
- Combination of APACHE-II score and an obesity score (APACHE-O) for the prediction of severe acute pancreatitis. Pancreatol. 2004;4:1-6.
- [CrossRef] [PubMed] [Google Scholar]
- Abdominal and total adiposity and the risk of acute pancreatitis: A population-based prospective cohort study. Am J Gastroenterol. 2013;108:133-9.
- [CrossRef] [PubMed] [Google Scholar]
- Methods for measuring abdominal obesity in the prediction of severe acute pancreatitis, and their correlation with abdominal fat areas assessed by computed tomography. Aliment Pharmacol Ther. 2010;32:244-53.
- [CrossRef] [PubMed] [Google Scholar]
- Visceral adiposity predicts severity of acute pancreatitis. Pancreas. 2017;46:776-81.
- [CrossRef] [PubMed] [Google Scholar]
- A large volume of visceral adipose tissue leads to severe acute pancreatitis. J Gastroenterol. 2011;46:1213-8.
- [CrossRef] [PubMed] [Google Scholar]
- The evolving role of inflammation in obesity and the metabolic syndrome. Curr Diab Rep. 2005;5:70-5.
- [CrossRef] [PubMed] [Google Scholar]
- Comparison of the release of adipokines by adipose tissue, adipose tissue matrix, and adipocytes from visceral and subcutaneous abdominal adipose tissues of obese humans. Endocrinol. 2004;145:2273-82.
- [CrossRef] [PubMed] [Google Scholar]
- Obesity increases the severity of acute pancreatitis: Performance of APACHE-O score and correlation with the inflammatory response. Pancreatol. 2006;6:279-85.
- [CrossRef] [PubMed] [Google Scholar]
- Lipolysis of visceral adipocyte triglyceride by pancreatic lipases converts mild acute pancreatitis to severe pancreatitis independent of necrosis and inflammation. Am J Pathol. 2015;185:808-19.
- [CrossRef] [PubMed] [PubMed Central] [Google Scholar]
- Adipose tissue quantification by imaging methods: A proposed classification. Obes Res. 2003;11:5-16.
- [CrossRef] [PubMed] [PubMed Central] [Google Scholar]
- Adipose tissue determinations in cadavers--a comparison between cross-sectional planimetry and computed tomography. Int J Obes. 1990;14:893-902.
- [PubMed] [Google Scholar]
- Abdominal fat: standardized technique for measurement at CT. Radiol. 1999;211:283-6.
- [CrossRef] [PubMed] [Google Scholar]
- Age and gender specific estimation of visceral adipose tissue amounts from radiological images in morbidly obese patients. Sci Rep. 2016;6:1-7.
- [CrossRef] [PubMed] [PubMed Central] [Google Scholar]
- Multiple organ dysfunction score: A reliable descriptor of a complex clinical outcome. Crit Care Med. 1995;23:1638-52.
- [CrossRef] [PubMed] [Google Scholar]
- Obesity is a definitive risk factor of severity and mortality in acute pancreatitis: An updated meta-analysis. Pancreatol. 2006;6:206-9.
- [CrossRef] [PubMed] [Google Scholar]
- Impact of visceral adiposity on severity of acute pancreatitis: A propensity score-matched analysis. BMC Gastroenterol. 2019;19:1-8.
- [CrossRef] [PubMed] [PubMed Central] [Google Scholar]
- Obesity and pancreatitis. Curr Opin Gastroentero. 2017;33:374.
- [CrossRef] [PubMed] [PubMed Central] [Google Scholar]
- Effects of abdominal fat distribution parameters on severity of acute pancreatitis. World J Surg. 2012;36:1679-85.
- [CrossRef] [PubMed] [Google Scholar]
- Association of visceral adipose tissue on the incidence and severity of acute pancreatitis: A systematic review. Pancreatol. 2020;20:1056-61.
- [CrossRef] [PubMed] [Google Scholar]
- Impact of body fat and muscle distribution on severity of acute pancreatitis. Pancreatol. 2017;17:188-93.
- [CrossRef] [PubMed] [Google Scholar]
- Comparison of scoring systems in predicting the severity of acute pancreatitis. World J Gastroenterol. 2015;21:2387.
- [CrossRef] [PubMed] [PubMed Central] [Google Scholar]


