
Translate this page into:
Undernutrition in children & critical windows of opportunity in Indian context
For correspondence: Dr R. Hemalatha, ICMR-National Institute of Nutrition, Jamai-Osmania Post, Hyderabad 500 007, Telangana, India e-mail: rhemalathanin@gmail.com
-
Received: ,
This is an open access journal, and articles are distributed under the terms of the Creative Commons Attribution-NonCommercial-ShareAlike 4.0 License, which allows others to remix, tweak, and build upon the work non-commercially, as long as appropriate credit is given and the new creations are licensed under the identical terms.
This article was originally published by Medknow Publications & Media Pvt Ltd and was migrated to Scientific Scholar after the change of Publisher.
Abstract
It is intriguing to note that majority of the wasting among the under 5 yr in India is present at birth. The National Family Health Survey 4 (NFHS-4) data analysis shows 31.9 per cent wasting at birth, which is decreasing to 17.7 per cent in the under five children; clearly suggesting that any reduction in wasting should come from improvement in foetal growth. In addition, children with both severe wasting and severe stunting, in whom the risk of mortality increases many folds, are <1 per cent in almost all the States; and these are the children in whom special care is required under the community-based management of severe acute malnutrition. This article presents an overview of nutrition status in children, their antecedents, and the critical phases; especially, nutrition status before pregnancy that plays a crucial role in all the nutrition status indicators of children. More attention on the critical phases is crucial to maximize the benefits from national programmes.
Keywords
1000 days
dietary practices
growth faltering
preconception
pregnancy
stunting
wasting

Introduction
Women and child malnutrition remains a major issue of public health concern in India. India is considered as a major global economy and a country in epidemiological transition, but growth faltering rates are much above critical levels of 20 per cent, and need immediate attention to achieve the sustainable development goals (SDG)1. The two main nutritional indicators of public health concerns in India are stunting and wasting. Stunting or linear growth failure is a deficit in length or height compared to a reference standard and is defined as height for age (HAZ) <−2 standard deviation (SD) of the reference standard median2. Wasting is defined as deficits in weight for height/length (WHZ) <−2SD of the reference standard median, and −3SD deficits in weight for height is usually used to express a more severe form of malnutrition also termed severe acute malnutrition (SAM)2. It is also useful especially in circumstances where accurate measurement of records of age is not available or possible. Although it takes care of inaccuracy in age determination, it has a limitation in the sense that it ignores or partially adjusts for stunting or deficits in height for age which is a chronic undernutrition. Furthermore, where stunting prevalence is low or height for age is normal or more it tends to overestimate wasting. The National Nutrition Monitoring Bureau (NNMB) rural surveys and the National Family Health Survey 4 (NFHS-4) show reduction in the prevalence of all indicators of nutritional status over a period, though both stunting and wasting are above public health concern34 (Fig. 1). Stunting is decreasing at <1 per cent per year over the last few decades and is still around 38 per cent and wasting continues at 20 per cent35.

- Time trends in prevalence of nutritional indicators. NNMB, National Nutrition Monitoring Bureau; NFHS-4, National Family Health Survey 4. Source: Refs 3, 4.
The WHO Multicentre Growth Reference Study (MGRS), the standard that is used to determine nutrition status in children, generated growth data from 8500 children in six countries, from different ethnic backgrounds and cultures2. The MGRS standards are derived from combined longitudinal follow up and cross-sectional data in preschool children from birth to five years’ postnatal life, controlling for socio-economic variables, behavioural aspects such as smoking, alcohol intake and optimal infant and young child feeding (IYCF) practices. These standards show how children can and should grow, under optimal circumstances, provided equal opportunities are available and are thus prescriptive in nature unlike others such as the National Centre for Health Statistics (NCHS) or Centers for Disease Control (CDC) growth charts267, which are representative and specific for the North American population. In low middle-income countries (LMIC), especially in the context of India, linear growth retardation is due to chronic processes that result in cumulative deficits accrued over a period across generations. Considering the data on secular trends in India, it appears that the population in India is likely to catch-up with global trends as far as linear growth is concerned; but evidence on body composition shows a different picture48. It is important to achieve a right balance in the trade-off between realizing the full growth potential and optimal body composition.
Stunting & wasting across India
Underweight (deficits in weight for age) and stunting (deficits in height for age) run parallel to each other and usually coexist with wasting, more so in the Indian context. Although 31.9 per cent wasting is present at birth (NFHS-4)3, it gradually decreases to 17.7 per cent among the under 5 yr olds; in contrast, stunting and underweight are present at a lower level at birth, but steadily increase uptill two years and plateau thereafter (NFHS-4)3, although some catch-up growth occurs during early infancy (Fig. 2).

- Stunting, wasting and underweight in children from one month to five years of age. Source: Ref. 3.
Stunting prevalence ranges from 20 per cent in Goa and Kerala-relatively better-performing States on most of the health indicators, to 48 per cent in Bihar, at an average of 38.4 for India3. Taking a cut-off of 30 per cent for medium prevalence as per the WHO3, almost half of the States have prevalence of more than 30 per cent (Table I). One important observation from the distribution of stunting prevalence is that almost all the central and eastern States and majority of western States have high burden (>30%) of stunting in comparison to the majority of southern, and northeastern States where stunting prevalence is low (<30%). Among the northern States, the burden is equally shared. This perhaps could be due to the cultural and dietary practices among northeastern States where flesh food is more common. However, among the southern States, such as Tamil Nadu and Kerala, it may be attributed to robust food and nutrition policies in addition to female literacy rates in Kerala3. In States, such as Goa and Punjab, the lower level of stunting among children may be credited to increasing Gross Domestic Product3.
| Zone | Low burden States | High burden States | ||
|---|---|---|---|---|
| <30% | Prevalence (%) | >30% | Prevalence (%) | |
| North | Chandigarh | 28.7 | Delhi | 31.9 |
| Himachal Pradesh | 26.3 | Haryana | 34 | |
| Jammu & Kashmir | 27.4 | Uttarakhand | 33.5 | |
| Punjab | 25.7 | Rajasthan | 39.1 | |
| Central | Chattisgarh | 37.6 | ||
| MP | 42 | |||
| UP | 46.2 | |||
| East | Bihar | 48.3 | ||
| Jharkhand | 45.3 | |||
| Odisha | 34.1 | |||
| West Bengal | 32.5 | |||
| North East | Arunachal | 29.3 | Assam | 36.4 |
| Sikkim | 29.6 | Meghalaya | 43.8 | |
| Manipur | 28.9 | |||
| Mizoram | 28.1 | |||
| Nagaland | 28.6 | |||
| Tripura | 24.3 | |||
| West | Goa | 20.1 | Gujarat | 38.5 |
| Daman and Diu | 23.4 | Maharashtra | 34.4 | |
| Dadra, Nagar Haveli | 41.7 | |||
| South | Tamil Nadu | 27.1 | ||
| Telangana | 28 | AP | 31.4 | |
| Kerala | 19.7 | Karnataka | 36.2 | |
| Andaman Nicobar | 23.3 | |||
| Puducherry | 23.7 | |||
| Lakshadweep | 26.8 | |||
Source: Ref. 3
Wasting prevalence ranges from <10 per cent in Manipur (6.8%) and Mijoram (6.1%) to 29 per cent in Jharkhand State3. The prevalence of severe wasting or SAM is around 7.4 per cent across India3. Four States have more than 10 per cent prevalence of SAM and 23 States have 5-10 per cent prevalence, and only nine States have <5 per cent3, which is the sixth global nutrition targets set by the World Health Assembly9.
Majority of SAM cases are usually uncomplicated and can be managed at home or the community level. Less than 10 per cent of SAM cases may require facility-based management due to associated complications, clinical conditions or infections, etc. Among 90 per cent of SAM cases that are uncomplicated and can be managed at home or at community level, challenges may exist in those SAM (WHZ <−3) children who are both wasted and stunted. On analyzing the NFHS-4 data, 6.4 per cent of children were found to have both wasting (WHZ <−2) and stunting (HAZ <−2)3. However, the proportion of children with severe stunting (HAZ <−3) and also severe wasting (WHZ <−3), in whom the risk of mortality increases many folds, is <1 per cent in majority of the States, and these are the children in whom special care is required under the community-based management of SAM (CM-SAM) care scheme (Table II).
| Severe wasting (%) | Moderate wasting (%) | No wasting (%) | Total (%) | |
|---|---|---|---|---|
| Severe stunting | 0.82 | 1.94 | 13.66 | 16.43 |
| Moderate stunting | 0.98 | 2.6 | 18.36 | 21.93 |
| No stunting | 5.74 | 8.32 | 47.57 | 61.64 |
| Total | 7.54 | 12.86 | 79.6 | 100 |
Source: Ref. 3
Comparing the nutritional status indicators in preschool children from NFHS, mean weight for age (WAZ) score at birth were −1.15 (n=268) and −0.76 (n= 184), respectively showing some improvement at birth from the first to the third survey. Similarly, the z scores for HAZ at birth decreased from −0.94 in the first survey to −0.45 in the third survey. These findings highlight the fact that 55 per cent (NFHS-1) and 44 per cent (NFHS-3) of the total deficits (at three years) are present at birth in WAZ score with respect to the total growth faltering present at the end of the third year10. Similarly, with reference to stunting, the deficits in height for age at birth with reference to deficits at three years were 36 and 23 per cent, respectively between first and third surveys, thereby confirming that foetal growth restriction plays a major role10. However, weight for height (WHZ) scores relatively remained the same during this period, thus suggesting that there are improvements in both weight and length at birth over three decades10.
Maternal nutrition status before pregnancy & nutrition status in children
Growth faltering has multifactorial aetiology. NFHS-4 data show association of stunting in children with literacy status, poor socio-economic status, feeding practices and infections3. Longitudinal and cross-sectional studies have shown maternal weight and size at birth to be associated with weight and length at two years111213. A prospective follow up study of infants from birth to two years showed poor weight gain among low birth weight (LBW) infants even at two years compared to full-term normal infants from the same environment11. Poor nutritional status of mothers and low maternal weight gain were associated with weight among two-year-old infants11. A meta-analysis of 19 birth cohorts by Black et al12, showed an odds ratio (OR) of 2.43 and 1.93 for stunting with small for gestational age (SGA) and preterm birth (PTB) respectively. SGA and PTB together increase the OR by 4.53-fold for stunting in children. Accordingly, it is extremely important to prevent SGA and PTB to bring major reduction in stunting. To improve birth weight and decrease SGA and PTB, nutrition status of women before conception seems critical given the high prevalence of anaemia and undernutrition (<18.5 kg/m2 BMI) among women of reproductive age in India, but unfortunately, maternal nutrition status before pregnancy has not received the attention it deserves.
A prospective cohort study in Vietnam, using path model analysis to examine associations with preconception nutrition status on foetal growth and length at birth and two years after adjusting for child age, sex, gestational weight gain, education and socio-economic status has observed positive association with foetal growth and height at two years and showed 20 per cent association between preconception nutrition and stunting in children13. In the same study, each 1 SD increase in maternal height and weight before pregnancy increased child HAZ by 0.30 SD and 0.23 SD, respectively, confirming that maternal nutritional status influences postnatal linear growth and risk of stunting in the first 1000 days. The same study also revealed that BMI cut-off of 17.5 increased the risk of childhood stunting by 1.3 times, instead of traditional cut-off of 18.5 kg/m2. It is also important to be aware that preconception nutritional status of the mother is not only important from undernutrition viewpoint, but also from the overweight perspective as highlighted by Dean et al14. In a review on preconception care on maternal and child health outcomes, the authors state that underweight in mothers contribute to 32 per cent of preterm deliveries, and overweight also increases the risk of PTB and neonatal mortality14. Maternal pre-pregnancy BMI, age at first pregnancy and inter-pregnancy intervals are known to have a ‘U’-shaped distribution with reference to birth weight and other adverse outcomes related to pregnancy1516.
Maternal nutrition at the time of fertilization influences epigenetic remodelling of foetal genes1516. The first few weeks of gestation affect placental development to ensure the balance between maternal and foetal nutritional needs15. Several studies, basic and human, have repeatedly confirmed the role of pre- and peri-conceptional nutritional status affecting not only intrauterine growth and postnatal growth but also the offspring's long-term health1213141516. Preconception includes the periods before the first pregnancy and inter-pregnancy intervals including postpartum period.
As widely advocated, targeting first 1000 days might be the most important critical window of opportunity to improve birth weight and postnatal growth, but targeting pre-pregnancy period along with first 1000 days will yield more benefits. Improving adolescent nutrition is also a good lifecycle approach to prevent the next generation stunting and perhaps the current generation stunting as well51718. Although inconclusive, secular trend was observed among boys and girls (adolescent age), over a period of 35 yr, suggesting that catch-up growth occured in our population during adolescent age as suggested elsewhere517. Given the current situation of negligible increase in heights over decades, efforts should be made to improve growth, especially the girl child, during all life stages such as adolescents/before pregnancy.
Although a high proportion of women in India are anaemic or undernourished when they conceive, there is no programme in place to address this issue3. New interventions before pregnancy/preconception period may be initiated to improve birth outcomes. Women and couples of childbearing age, planning for pregnancy, may be targeted for preconception counselling. Interventions should address the issues of optimization of age at first pregnancy, reproductive health, optimal BMI (19-23/25 kg/m2) in addition to appropriate haemoglobin, blood pressure, blood glucose and thyroid function. Healthy diet and nutrition counselling should also be prioritized during this phase. Inter-pregnancy interval and appropriate weight gain during pregnancy should be part of the preconception counselling. Preconception counselling approach will also benefit the women who are overweight/obese, which is escalating in epidemic proportions and which is known to adversely affect foetal growth and health19.
Breast feeding & dietary practices & nutrition status in children
In addition to being born in a disadvantageous condition, the LBW/SGA or PTB is often given inadequate energy and poor quality protein. NFHS-4 and NNMB surveys show poor dietary diversity and inadequate macro- and micro-nutrient consumption34. Fig. 3 shows poor intake of all protective foods or nutrition sensitive foods in 1-6 yr old children419. The NNMB rural survey (2011-2012) shows protein and calorie adequacy in only 49 and 59.7 per cent in 1-3 and 4-6 yr children, respectively4. This condition is further complicated by multiple micronutrient deficiencies especially of essential nutrients such as vitamins A, D, B12, iron, zinc and calcium419. This explains why undernutrition and stunting peak in the first two years of life in India. Apart from protein-calorie, micronutrients adequacy and dietary diversity are considered essential for optimal growth.
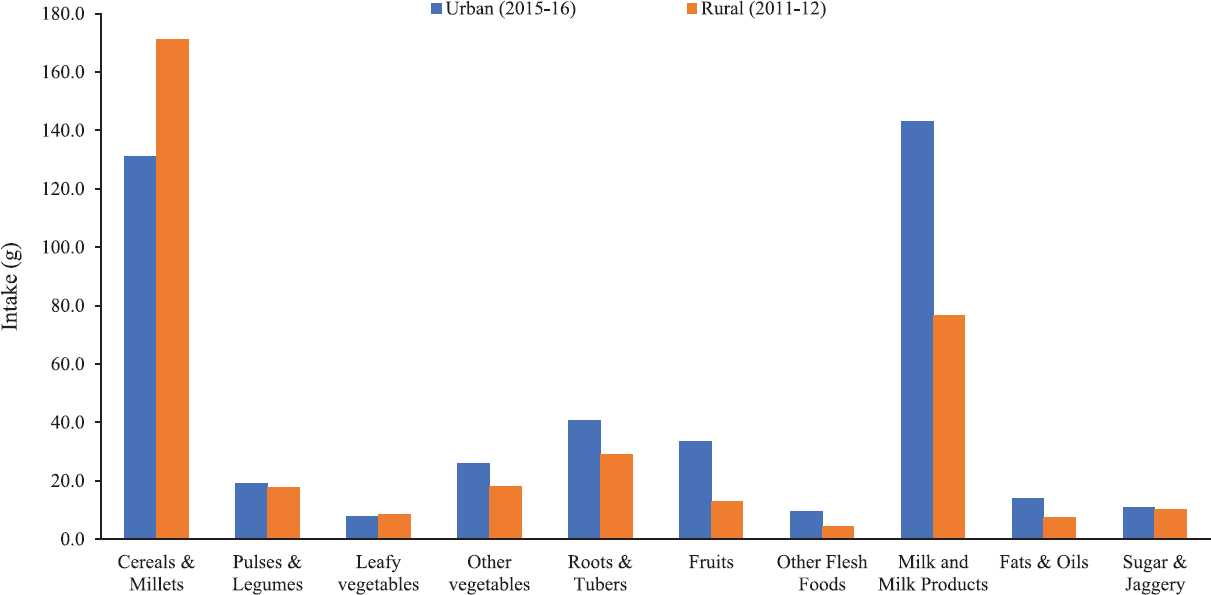
- Mean food intakes (g/day) among 1-6 yr children. National Nutrition Monitoring Bureau, Rural, Third Repeat survey, 2011-2012 and National nutrition monitoring bureau urban survey on ‘Diet and Nutritional Status of Urban Population in India and Prevalence of Obesity, Hypertension, Diabetes and Hyperlipidemia in Urban men and women’. 2015-2016, Indian Council of Medical Research-National Institute of Nutrition, Hyderabad, Author's analysis and calculation.
-
Source: Refs 4,19.
The practices of early initiation of breastfeeding as well as exclusive breastfeeding are very poor in Indian households34. Exclusive breastfeeding rates were 72.5 per cent in under two months, which reduced to 41.5 per cent by four to five months age, and further reduced to 17 per cent among children aged six to eight months. The median duration of exclusive breastfeeding was 2.9 months and the median duration of predominant breastfeeding was 5.8 months34. These findings clearly show that breastfeeding practices are poor and there is early introduction of complementary feeding. Early introduction of complementary feeding may increase the early onset of diarrhoea and other infections, which are known to affect growth20. As for complementary feeding, only around 10 per cent of 6-23 month old children receive adequate complementary foods34. Further, the minimal dietary diversity, minimal meal frequency and minimum acceptable diet are only 22 (1.1-49.1), 35 (22-56.8) and 9.6 per cent (0.0-23.5), respectively3. As per NNMB urban survey 2015-16, the initiation of complementary feeding soon after six months is only 34.4 per cent with a range of 3.3 to 64 per cent in different States19. Dietary intakes of preschool children in rural and urban areas (2011-2012 and 2015-2016) show gross inadequacy of all foods (Fig. 3) and nutrients419 and the quality of protein is poor as milk intake is negligible in most children. The proportion of children consuming more than 70 per cent of RDA of some of the essential nutrients is <40 per cent4 (Table III).
| Nutrients | Energy | Protein | Fat | Iron | Calcium | Vitamin A | Vitamin C |
|---|---|---|---|---|---|---|---|
| Age group (yr) | |||||||
| 1-3 | 49.0 | 78.4 | 28.2 | 34.8 | 15.5 | 11./8 | 14.6 |
| 4-6 | 59.7 | 91.4 | 39.8 | 36.6 | 16.4 | 13.7 | 26.6 |
Source: Ref. 4
Results of a comprehensive nutrition survey done in the State of Maharashtra, a high prevalence State (34.4%) for stunting and wasting (25.6%), demonstrated that children from severely food insecure households had a 53, 64 and 91 per cent higher odds of being stunted, or wasted and underweight respectively compared to food secure households21. The same survey has demonstrated that moderately and severely food insecure households have a very low dietary diversity scores compared to food secure households. A similar finding in relation to lower dietary diversity and reductions in growth increments in food-insecure households were reported from Ethiopia22.
Infant and young child feeding (IYCF) practices need to be improved through mass media communication or through Jan Andolan and community involvement20. The pre-pregnancy counselling can be used to prepare the mother on good IYCF practices; however, these counselling will work only in food secure population but not in food insecure, vulnerable population. It is relevant to mention here that there is a lack of data on the effect of feeding practices on the magnitude of stunting (growth faltering) in infants born normal and small. Another unexplored area in relation to childhood growth faltering is seasonality of food production, distribution, availability and access which could be important in determining the dietary diversity.
Infection/environmental enteropathy (EE) & nutrition status in children
Recurrent acute infections such as diarrhoea transmitted through unhygienic food, water and poor sanitation is a well-known factor associated with stunting and wasting and mortality in children1120. As for chronic infections, tuberculosis is relatively common, especially among children of low socio-economic status families. Secondary analysis of data from a tertiary hospital during a five years period (2001-2005), in Hyderabad, in 309 children admitted with a mean ‘z’ scores of around - 4.0 for both weight for height and height for age showed association of tuberculosis to the extent of 20 per cent in oedematous malnutrition to 12 per cent in non-oedematous malnutrition23. Furthermore, only 28 per cent of children were admitted primarily for undernutrition without any complications while 70 per cent were admitted with some associated complications.
Children living in environments where hygiene is poor and open defecation is common are regularly exposed to high doses of bacteria that may not cause frank gastrointestinal infections but may stimulate low-grade chronic inflammation242526. In addition to small intestinal bacterial overgrowth and abnormal gut microbiota, environmental toxins are suggested to promote environmental enteric dysfunction (EED). EED can affect mucosal permeability and thereby absorption through altered intestinal villous structure242526. Alternatively, EED may induce systemic inflammation, which can directly affect linear growth2627. In addition, inflammation, systemic or local, will adversely affect the absorption or nutrient utilization, which could be responsible for the failure of interventions in low-income settings in developing countries. In a community-based longitudinal study, we found higher total bacterial count and higher systemic inflammatory markers among 2-5 yr old children compared to those reported from other countries28. Similarly, a proportion of 30 per cent of young adults was found to have low-grade systemic inflammation in a cross-sectional study29. These studies suggest that there is an undercurrent of systemic inflammation in apparently normal children and adult population in India, although there is no conclusive data on this2829. Apart from absorption and nutrient utilization, inflammation downregulates growth factors and impairs normal growth in children27. Furthermore, EED is a complex subclinical process with metabolic abnormalities leading to low oral vaccine efficacy, neurocognitive impairment, in addition to growth faltering. Intestinal mucosal permeability and integrity along with microbial flora are less explored areas with regards to chronic undernutrition and anemia24252627.
Access to clean water, improved sanitation, hand wash and hygiene practices, routine mass de-worming are some of the well-known strategies that are being advocated and that which are inexpensive and effective measures to control inflammation, bacterial/helminthic infections, which in turn will reduce anaemia and undernutrition. However, environmental pollution such as air pollution (lead, carbon monoxide and wood burning) and aflatoxin should also be addressed to reduce EED.
National goals & strategies
Forty per cent reduction in stunting prevalence by 2025 is the first global nutrition target set by the World Health Assembly in 2012, along with 30 per cent reduction in LBW and maintaining wasting prevalence below 5 per cent9. The SDG target 2.2, aims to end all forms of malnutrition by the end of 20301. The government of India launched the National Nutrition Mission (NNM)/Poshan Abhiyaan commencing from 2017 to 2018 to address malnutrition through convergence, use of technology and a targeted approach30. NNM targets to reduce stunting, undernutrition and LBW by 2 per cent, and anaemia by 3 per cent per annum; and aims to get stunting to 25 per cent by 202230.
The Poshan Abhiyaan addresses the nutrition specific and nutrition sensitive interventions and convergence of ministries related to all health and nutrition-related schemes of Ministry of Women and Child Development and other sectors/ministries on the target population30. However, adequate attention must be given to the preconception nutrition status as well as the first six months of life, which are the two critical phases that would make a difference in the prevalence of stunting and wasting; the results may be realized much earlier. The first six months of life needs to be addressed with appropriate interventions such as counselling and nutritional supplement to mothers for better lactation performance. Keeping in view the number of infants from birth to six months at each Anganwadi centre, weekly weighing of infants from birth to the first two to three months of age should be carried out with more vigour when growth faltering begins. Infants with growth faltering must be identified in the first instant for counselling and special care. Performing this exercise may not only reduce stunting but also help prevent SAM in the community.
Conclusions
Stunting may be associated with cognitive impairment, diminished learning capacity and poor school performance in childhood12. The five birth cohorts study has shown that interventions in early life which increase birth weight and linear growth may have beneficial effects in later life as adults31. In contrast, rapid gain in weight after two years of age increases risks of diet-related adult chronic diseases, obesity, hypertension, diabetes and cardiovascular disease30. Some studies have shown that increments in early infancy, more so in length, have a beneficial effect for later cardiometabolic outcomes1232. Accordingly, several researchers have documented that though weight gains in early life may be associated with adult lean mass, and hence beneficial, weight gains in later childhood or more specifically beyond 1000 days or 2-3 yr of life may lead to adiposity in adult life and may have adverse outcomes1231.
In India, one in two women and one in five women who enter pregnancy are anaemic or undernourished, respectively. Moreover, by the time, these women report to the antenatal clinic they are around 8-10 wk gestation, which is too late for making any big impact in terms of improvement in birth weight or length. As for commitment, the situation in India now is exemplary. Every sector is motivated and desires to contribute towards improving the nutrition status of women and children. However, it is essential to understand that it is not just intensifying the resources that will work, but also the critical time periods that should be receiving maximum focus.
Financial support & sponsorship: None.
Conflicts of Interest: None.
References
- World Health Organization. 2015. Global Health Observatory (GHO) data: Health in 2015 from MDGs to SDGs. Available from: http://www.who.int/gho/publications/mdgs-sdgs/en
- [Google Scholar]
- World Health Organization. 2018. Child growth standards: The WHO Multicentre Growth Reference Study (MGRS). WHO; Available from: http://www.who.int/childgrowth/mgrs/en/
- [Google Scholar]
- International Institute for Population Sciences. In: National family health survey (NFHS-4), 2015-16. Mumbai: IIPS; 2017.
- [Google Scholar]
- National Nutrition Monitoring Bureau. Diet and nutritional status of rural population, prevalence of hypertension & diabetes among adults and infants & young child feeding practices - Report of Third Repeat Survey. Report No-26 2012
- [Google Scholar]
- Secular trends in heights and weights in boys and girls over 3 decades in rural India. Food Nutr Bull. 2016;37:425-38.
- [Google Scholar]
- National Center for Health Statistics. Growth curves for children birth to 18 years: United States Department of Health Education and Welfare, Vital and Health Statistics 1977 Series 11. Nb.165
- [Google Scholar]
- 2_19 country checkNational Health and Nutrition Examination Survey. 2000. iCDC Growth Charts: United States Site internet. Hyattsville: Centers for Disease Control and Prevention. Available from: http://www.cdc.gov/growthcharts
- [Google Scholar]
- Do South Indian newborn babies have higher fat percentage for a given birth weight? Early Hum Dev. 2016;96:39-43.
- [Google Scholar]
- World Health Organization. Nutrition. 2018. Global targets 2025: To improve maternal, infant and young child nutrition. WHO; Available from: http://www.who.int/nutrition/globaltarget-2025/en/
- [Google Scholar]
- Pattern of growth faltering and recovery in under 5 children in India using WHO growth standards - a study on first and third National Family Health Survey. Indian Pediatr. 2011;48:855-60.
- [Google Scholar]
- Effectiveness of zinc supplementation to full term normal infants: A community based double blind, randomized, controlled, clinical trial. PLoS One. 2013;8:e61486.
- [Google Scholar]
- Maternal and child undernutrition and overweight in low-income and middle-income countries. Lancet. 2013;382:427-51.
- [Google Scholar]
- Role of maternal preconception nutrition on offspring growth and risk of stunting across the first 1000 days in Vietnam: A prospective cohort study. PLoS One. 2018;13:e0203201.
- [Google Scholar]
- Preconception care: Nutritional risks and interventions. Reprod Health. 2014;11((Suppl 3)):S3.
- [Google Scholar]
- A summary of pathways or mechanisms linking preconception maternal nutrition with birth outcomes. J Nutr. 2016;146:1437S-44S.
- [Google Scholar]
- Preconceptional nutrition interventions for adolescent girls and adult women: Global guidelines and gaps in evidence and policy with emphasis on micronutrients. J Nutr. 2016;146:1461S-70S.
- [Google Scholar]
- Critical windows for nutritional interventions against stunting. Am J Clin Nutr. 2013;97:911-8.
- [Google Scholar]
- Critical windows for nutritional interventions against stunting. Am J Clin Nutr. 2013;98:854-5.
- [Google Scholar]
- National Nutrition Monitoring Bureau. In: Diet and nutritional status of urban population in India and prevalence of obesity, Hypertension, Diabetes and Hyperlipidemia in Urban men and Women. Technical report No. 27. Hyderabad: National Institute of Nutrition, ICMR; 2017.
- [Google Scholar]
- World Health Organization. Diarrhoeal disease. 2017. WHO; Available from: http://www.who.int/mediacentre/factsheets/fs330/en/index.html
- [Google Scholar]
- Household food insecurity and children's dietary diversity and nutrition in India. Evidence from the comprehensive nutrition survey in Maharashtra. Matern Child Nutr. 2017;13((Suppl 2)) doi:10.1111/mcn.12447
- [Google Scholar]
- Seasonality and determinants of child growth velocity and growth deficit in rural Southwest Ethiopia. BMC Pediatr. 2018;18:20.
- [Google Scholar]
- Hospital based nutrition rehabilitation of severely undernourished children using energy dense local foods. Indian Pediatr. 2010;47:687-93.
- [Google Scholar]
- Environmental enteropathy: Elusive but significant subclinical abnormalities in developing countries. EBioMedicine. 2016;10:25-32.
- [Google Scholar]
- Environmental enteropathy: Critical implications of a poorly understood condition. Trends Mol Med. 2012;18:328-36.
- [Google Scholar]
- Intestinal permeability, mucosal injury, and growth faltering in Gambian infants. Lancet. 1991;338:907-10.
- [Google Scholar]
- Systemic inflammation, growth factors, and linear growth in the setting of infection and malnutrition. Nutrition. 2017;33:248-53.
- [Google Scholar]
- A community-based randomized double blind controlled trial of Lactobacillus paracasei and Bifidobacterium lactis on reducing risk for diarrhea and fever in preschool children in an urban slum in India. Eur J Nutr Food Saf. 2014;4:325-41.
- [Google Scholar]
- Substantial proportion of apparently healthy, urban South Indian young adults has insulin resistance associated with other cardiovascular risk factors. J Med Sci. 2010;3:110-7.
- [Google Scholar]
- National Portal of India. 2018. PM's overarching scheme for holistic nourishment. Poshan Abhiyan. New Delhi: National Portal of India; Available from: https://www.india.gov.in/spotlight/poshan-abhiyaan-pms-overarchingscheme-holistic-nourishment
- [Google Scholar]
- Associations of linear growth and relative weight gain during early life with adult health and human capital in countries of low and middle income: Findings from five birth cohort studies. Lancet. 2013;382:525-34.
- [Google Scholar]
- Associations of birth weight, linear growth and relative weight gain throughout life with abdominal fat depots in adulthood: The 1982 Pelotas (Brazil) birth cohort study. Int J Obes (Lond). 2016;40:14-21.
- [Google Scholar]


