
Translate this page into:
Transcriptome profiling of visceral adipose tissue in a novel obese rat model, WNIN/Ob & its comparison with other animal models
Reprint requests: Dr Vajreswari Ayyalasomayajula, Department of Biochemistry, National Institute of Nutrition (ICMR), Jamai Osmania (PO), Hyderabad 500 007, Telangana, India e-mail: vaj_lipidresearch@yahoo.com
-
Received: ,
This is an open access article distributed under the terms of the Creative Commons Attribution NonCommercial ShareAlike 3.0 License, which allows others to remix, tweak, and build upon the work non commercially, as long as the author is credited and the new creations are licensed under the identical terms.
This article was originally published by Medknow Publications & Media Pvt Ltd and was migrated to Scientific Scholar after the change of Publisher.
Abstract
Background & objectives:
Adipose tissue dysfunction in obesity is linked to the development of type 2 diabetes and cardiovascular diseases. We studied the differential gene expression in retroperitoneal adipose tissue of a novel obese rat model, WNIN/Ob, to understand the possible underlying transcriptional changes involved in the development of obesity and associatedcomorbidities in this model.
Methods:
Four month old, male WNIN/Ob lean and obese rats were taken, blood was collected and tissues were dissected. Body composition analysis and adipose tissue histology were performed. Global gene expression in retroperitoneal adipose tissue of lean and obese rats was studied by microarray using Affymetrix GeneChips.
Results:
One thousand and seventeen probe sets were downregulated and 963 probe sets were upregulated (more than two-fold) in adipose tissue of WNIN/Ob obese rats when compared to that of lean rats. Small nucleolar RNA (SnoRNA) made most of the underexpressed probe sets, whereas immune system-related genes werethe most overexpressed in the adipose tissues of obese rats. Genes coding for cytoskeletal proteinswere downregulated, whereas genes related to lipid biosynthesis were elevated in the adipose tissue of obese rats.
Interpretation & conclusions:
Majority of the altered genes and pathways in adipose tissue of WNIN/Ob obese rats were similar to the observations in other obese animal models and human obesity. Based on these observations, it is proposed that WNIN/Ob obese rat model may be a good model to study the mechanisms involved in the development of obesity and its comorbidities. Downregulation of SnoRNA appears to be a novel feature in this obese rat model.
Keywords
Microarray
obesity
small nucleolar RNA
visceral adipose tissue
WNIN/Ob obese rat

In mammals, adipose tissue stores energy in the form of triglycerides (TGs) and supplies energy to the system by delivering free fatty acids. It has been shown that adipose tissue acts as an endocrine organ by secreting hormones, cytokines, growth factors, acute phase proteins, complement-related proteins and extracellular matrix (ECM) proteins1. In obesity, excess energy intake results in accumulation of large amounts of TGs in adipocytes leading to dysregulation of adipocyte metabolism and secretary function, resulting in the development of comorbidities such as insulin resistance, dyslipidaemia and hypertension, which can further lead to the development of chronic diseases such astype 2 diabetes and cardiovascular disease2. Expression profiling of various genes in the adipose tissue under obese conditions will lead to the better understanding of adipose tissue adaptation to high levels of TG accumulation, altered secretary function and also mechanisms involved in the development of obesity-associated comorbidities. Previous studies on microarray analysis of adipose tissue from animal models of obesity and human obesity have contributed to the understanding of genes that are altered in obesity and also the identification of candidate genes that play an important role in the development of obesity and its associated comorbidities34.
WNIN/Ob obese rat model was developed by selective breeding of obese rat generated by spontaneous mutation in 80 yr old inbred Wistar rat colony5. The mutation is autosomal codominant, and the rat colony has three phenotypes (and also three genotypes) i.e., lean (+/+), carrier (+/-) and obese (-/-). Preliminary studies have shown no molecular defect in the open reading frame of the leptin or leptin receptor6. The WNIN/Ob obese rat shares several physiological and biochemical characteristics with genetic and diet-induced rodent models. They exhibit early-onset obesity with hyperphagia, hyperinsulinaemia and hyperleptinaemia along with dyslipidaemia5.
In this study, the primary objective was to determine the differentiallyregulated genes in the visceral adipose tissue of WNIN/Ob obese rats to understand the possible underlying transcriptional changes involved in the development of obesity in this model. This would help in understanding the similarities/differences in the transcriptome composition of this novel obese rat model with already established obese rodent models and human obesity.
Material & Methods
Animals: This study was conducted by the Lipid Chemistry Division of Biochemistry Department in the National Institute of Nutrition (NIN), Hyderabad, India, during 2010-2011. Four month old, male WNIN/Ob lean and obese rats (n=6 for each phenotype) were obtained from the National Centre for the Laboratory Animal Sciences, Hyderabad. The animals were housed in cages and acclimatized for one week under controlled conditions of light (12 hof light/12 hof dark) and temperature (22°C ±2°C). Stock-diet and water were provided ad libitum. All experimental procedures were approved by the Institutional Animal Ethical Committee. After acclimatization, blood was drawn and animals were sacrificed by CO2 asphyxiation. Retroperitoneal adipose tissue was immediately removed, frozen in liquid nitrogen and stored at -80°C.
Body composition: Body composition of WNIN/Ob lean and obese animals was assessed by Total Body Electrical Conductivity (TOBEC) small animal body composition analysis system (EM-SCAN, Model SA-3000 Multidetector, Springfield, USA). Lean body mass (LBM), fat-free mass (FFM) and total body fat percentages were calculated according to manufacturer's instructions.
Histology of adipose tissue: Retroperitoneal adipose tissue samples were fixed in 10 per cent neutral-buffered formalin, embedded in paraffin and 4 μ sections were taken for staining. Adipose tissue samples were stained with haematoxylin and eosin (H&E) to observe adipose tissue inflammation and determine adipocyte hypertrophy (calculated by number of cells per 16 mm2). Images were taken with Nikon eclipse e800 microscope (Nikon Corporation, Tokyo, Japan) and analyzed with Image-Pro Plus software (Media Cybernetics, Bethesda, USA).
Global gene expression by microarray
RNA extraction: Total RNA was isolated, using the Trizol RNA isolation method (Invitrogen, USA), with slight modifications to increase the RNA purity and yield. Briefly, adipose tissue (500 mg) was homogenized in 0.5 ml Trizol reagent in 2ml Eppendorf tube and additional 0.5 ml Trizol was added and vortexed. Fat layer was removed after centrifugation of the homogenate for 10,000 g at 4°C for five minutes. Later steps were performed according to manufacturer's instructions. Chloroform wash was repeated three times. RNA was precipitated with isopropanol and washed with 75 per cent alcohol. After washing, alcohol was removed, and tubes were centrifuged at 2000 g for two minutes at room temperature to remove the traces of ethyl alcohol (which was the major contaminant, affecting the cRNA amplification step, during microarray standardization) and dissolved in autoclaved Milli-Q water. RNA concentration and quality were determined by reading the absorbance at 230, 260, 270, 280 and 320 nm. Along with the RNA concentration (260 nm), protein contamination (260 nm/280 nm, ratio≥2), phenol contamination (260 nm/270 nm, ratio ≥1.2) and salt contamination (260 nm/230 nm, ratio ≥2) were checked. RNA integrity was confirmedon one per cen tagarose gel electrophoresis.
Target preparation: Total RNA (100 ng) was taken and converted to antisense cRNA (complementary RNA) by in vitro transcription through single stranded and double stranded cDNA steps, using WT-cDNA synthesis and amplification kit (Affymetrix, USA). From antisense cRNA, single-stranded cDNA was synthesized, and cRNA was hydrolyzed using the same kit. cDNA was fragmented and labelled with phycoerythrin using WT Terminal Labelling Kit (Affymetrix, USA).
Hybridization and scanning: Hybridization cocktail containing the labelled probes was prepared using GeneChip Hybridization, wash and stain kit (Affymetrix, USA). Two hundred microliters of hybridization cocktail were loaded on to Rat Gene 1.0 ST Arrays (Affymetrix, California, USA) and incubated for 18 h at 45°C and 60 rpm in hybridization oven. After incubation, arrays were washed and scanned. Four chips were used for hybridization (two for lean and two for obese animals). The Rat Gene 1.0 ST Array consisted of 722,254 probes representing 27,342 well-annotated genes (covered 99.98% coverage of NM sequences present in April 3, 2007, RefSeq database).
Data analysis: Chip images were checked for artefacts and quality control analyses were performed. CEL files generated were pre-processed by robust multiarray analysis and normalized by quantile method, using Array Star software (DNASTAR, Inc., Wisconsin, USA). To determine the differentially expressed genes, probeset intensity values of two lean rat samples were averaged and compared against the averaged intensity values of two obese samples. Genes with more than two-fold differentially regulated (up- or downregulation) were taken into consideration. All the microarray work was done in compliance with MIAME (Minimum Information About a Microarray Experiment) guidelines7 and submitted to Gene Expression Omnibus (GEO, Accession number GSE58575).
Validation of relative gene expression by reverse transcription polymerase chain reaction (RT-PCR): Ten micrograms of RNA was used to synthesize first strand cDNA. The reverse transcription (RT) reaction was carried out by incubating RNA with oligo dT primer (Sigma, USA) and Moloney murine leukaemia virus reverse transcriptase (Finnzymes, Espoo, Finland) at 37°C for 60 min. Total reaction volume used in RT was 20 μl. An aliquot of cDNA was amplified in a 20 μl reaction mixture. Polymerase chain reaction (PCR) conditions were as follows: denaturation at 94°C for one minute, annealing at 60 - 64°C for 45 sec and polymerization for 70°C for one minute with DyNAzyme II DNA polymerase (Finnzymes, Espoo, Finland). A final extension was carried out at 70°C for seven minutes. The amount of RNA and the annealing temperature for different genes were standardized for linearity. Sequences of primers (self designed) used for amplification were stearoyl-CoA desaturase 1 (SCD1-NM139192.2): forward primer (FP)-5’-CGGC CCACATGCTCCAAGAGATCT-3’ and reverse primer (RP) - 5’-GTCTTCTTCCAGATAGAGG GGCACC-3’, malic enzyme (ME1-NM012600.2): FP-5’-ATAAAGTGACCAAGGGCCGTGCG-3’ and RP-5’-ACAGGCCACTACCCCAAGAGCAA-3’, lysosomal lipase (LIPA-NM012732.3): FP-5’-CGGTATCCAAAGAGACGGCTGCA-3’ and RP-5’- ACAGGCCTCGATAAATTAGGGCCT-3’, macrophage expressed gene (MPEG-NM022617.1): FP-5’-TCTTGCTGGTGAATGCCTGGGAC-3’ and RP-5’-ATACCCGGGTCTCTGAGAGGCTTG-3’, beta-3 adrenergic receptor (β3-AR-NM013108.1): FP-5’-ACTTTCGCGACGCCTTCCGT-3’ and RP-5’-AGCCATCAAACCTGTTGAGCGGT-3’, myotilin (MYOT-NM001106148.1): FP-5’-GATGTCACAGCCCGTCCAAACCA-3’ and RP-5’-AGCTGCCAGACGCTGAAACTCTC-3’, insulin-like growth factor binding protein 5 (IGFBP5-NM012817.1): FP-5’-GCATTTCCGAGCTGAAGGCCGA-3’ and RP-5’-AGGGGCCTTGGTCAGATTCCTGT-3’, calnexin (NM172008.2): FP-5’-GCAGCGACCTATGATTGACAACC-3’ and RP-5’-GCTCCAAACCAATAGCACTGAAAG-3’ (Bio-Serve, India). Calnexin was amplified as an internal control. After amplification, 8 μl of reaction mixture was subjected to agarose gel electrophoresis (2%) in Tris-acetate ethylenediaminetetraacetic acid buffer (pH 8.2). The ethidium bromide-stained bands were visualized by a ultraviolettransilluminator and analyzed densitometrically, using Quantity One software program (Bio-Rad, version 4.4.0, USA).
Statistical analysis: Data were analyzed by SPSS 11.0 software (Chicago, USA). For physical and TOBEC parameters, Student's t-test was used for calculation of significant changes (n=6). For gene expression validation by semi-quantitative RT-PCR, Student's t-test was used for the calculation of significant changes (n=4). For parameters, where homogeneity of variance was significant, log-transformed data were used for Student's t-test or non-parametric Mann-Whitney test was used. All data were presented as a mean ± standard error of mean.
Results
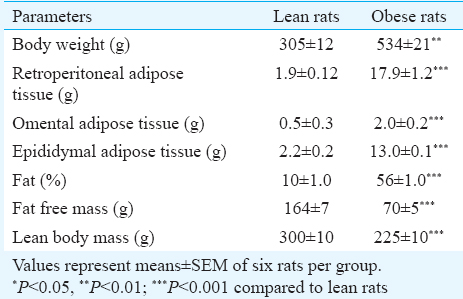
Physical parameters, body composition and adipose tissue histology: Four month old, male WNIN/Ob obese rats had significantly elevated body weights as compared with those of age- and sex-matched lean rats (Table I). Weights of all visceral adipose tissue depots (retroperitoneal, omental and epididymal) and body fat percentage were significantly (P<0.001) elevated in obese rats as compared with those of lean rats (Table I). LBM and FFM were significantly lower in WNIN/Ob obese rats as compared with their age- and sex-matched lean rats (Table I).
H&E staining showed increased adipocyte size (hypertrophy) in obese rats as compared with that of lean rats (Fig. 1). In adipose tissue of obese rats it also showed infiltration of inflammatory cells. No such changes were seen in the lean adipose tissue.
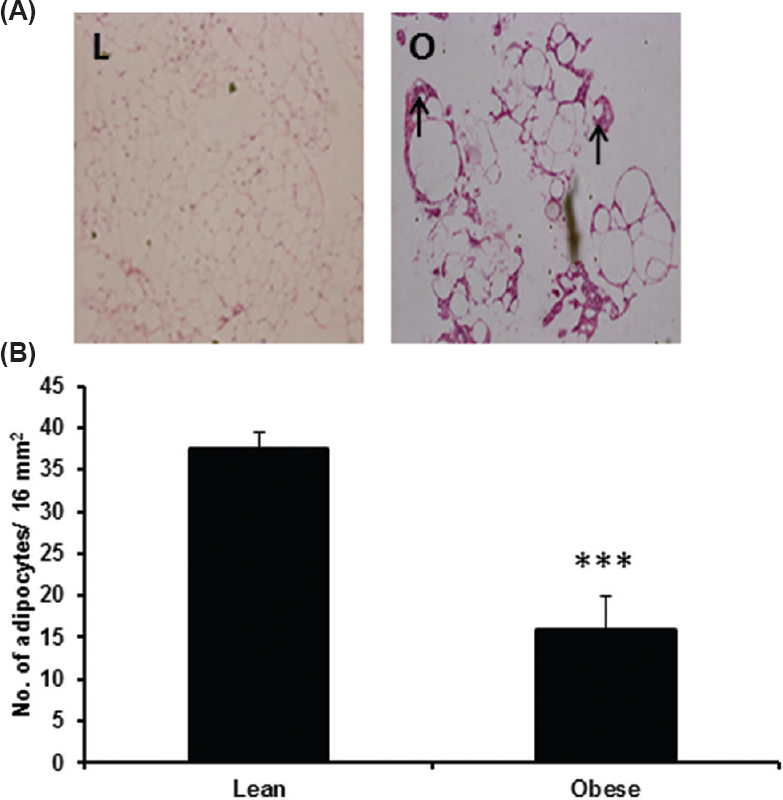
- Adipose tissue histology in four month old, male WNIN/Ob lean and obese rats. (A) Photographs of H&E stained retroperitoneal adipose tissue to study adipocyte size and inflammation. ‘L’ indicates lean sample and ‘O’ indicates obese sample. Arrow marks indicate the presence of infiltrated inflammatory cells. (B) Adipocyte size calculated as a number of cells/16 mm2 (n=4/phenotype). *** indicates P < 0.001 compared to lean rats.
Profiles of adipose tissue gene expression: Microarray analysis revealed that 1980 probe sets were differentially regulated (more than two-fold) in adipose tissue of WNIN/Ob obese rats as compared with that of age- and sex-matched lean rats (1017 probe sets were downregulated and 963 probe sets were upregulated). Of the 1017 downregulated probe sets, 359 probe sets coded for specific, known proteins. Three hundred and sixty five probe sets (approximately 35% of the downregulated probe sets) were specific for non-coding RNA. Small nucleolar RNA (SnoRNA) made a major percentage of the non-coding RNA and also the highly downregulated genes in adipose tissue of WNIN/Ob obese rats. MicroRNAs (miRNA) were also present in the downregulated non-coding RNA genes. Of the 963 upregulated probe sets, 787 probe sets had a code for specific, known proteins. Remaining probe sets had codes for non-coding RNA and hypothetical proteins.
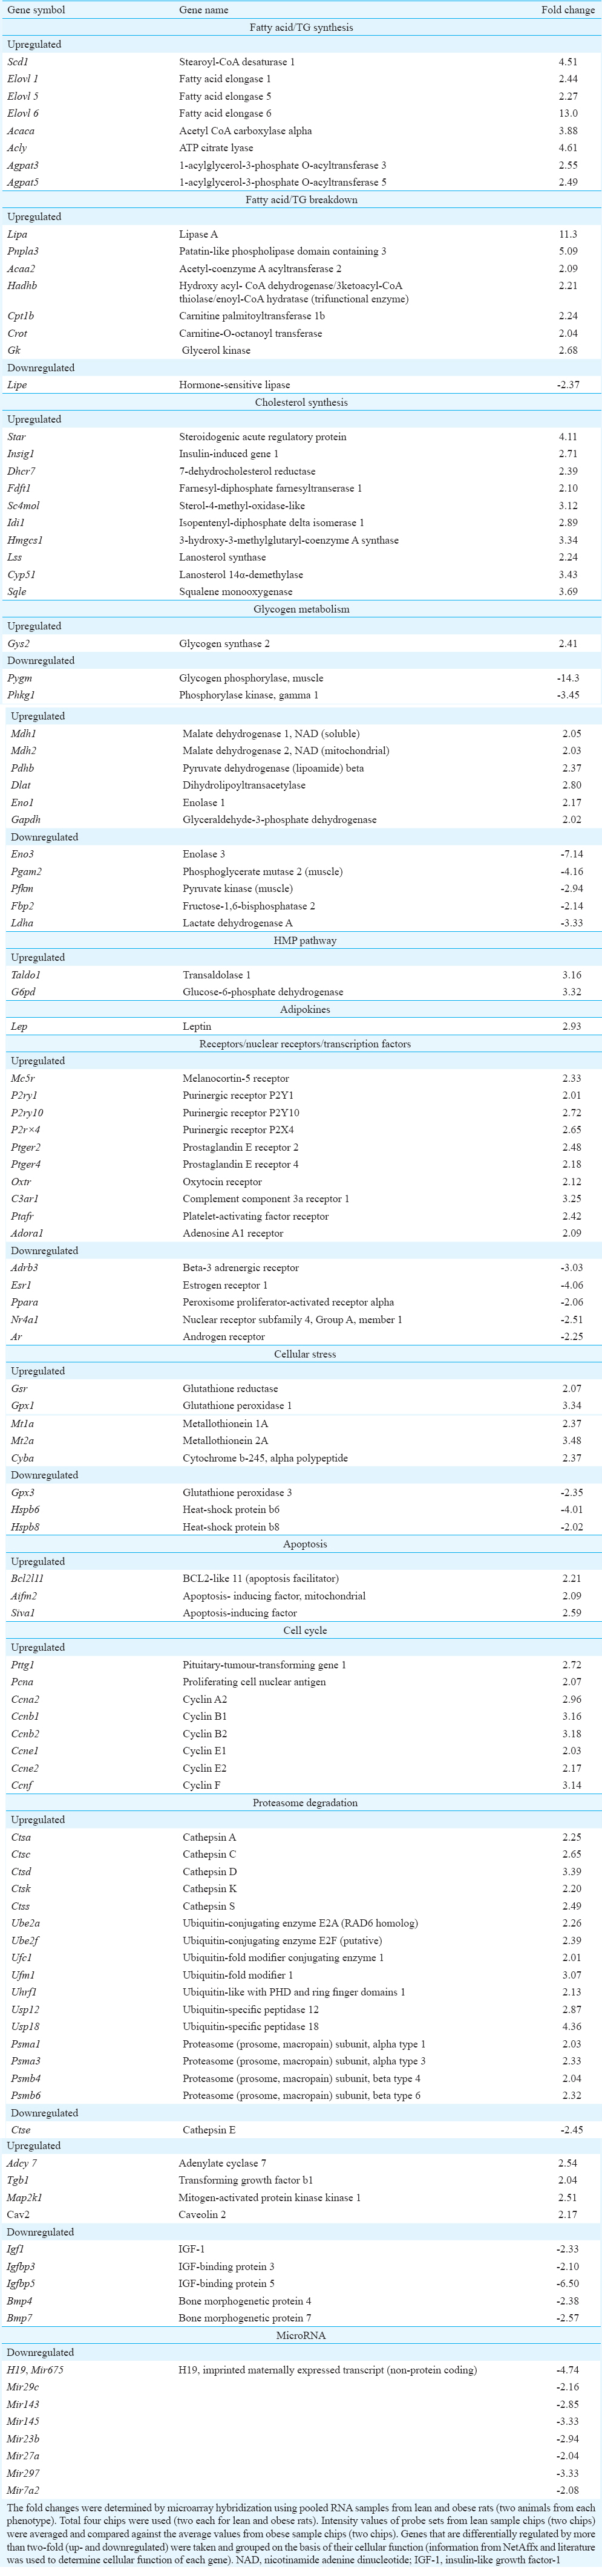
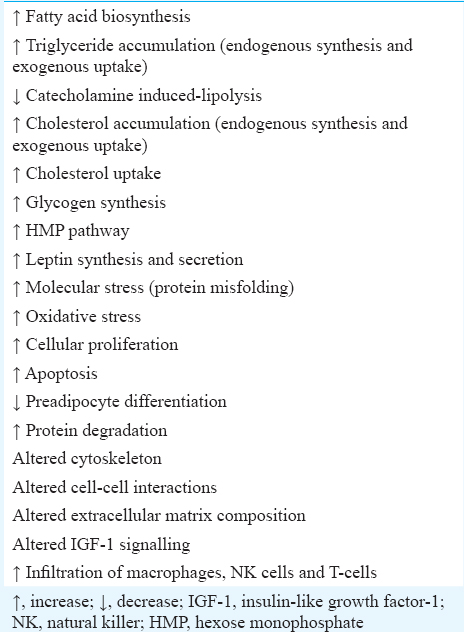
From the down- (359) and upregulated (787) genes specific for known proteins, genes were selected and segregated into groups based on their cellular function and information as described in NetAffx and literature (Table II). Groups included genes involved in lipid and carbohydrate metabolism, electron transport chain, oxidative stress, transport, receptors and transcription factors. Majority of the upregulated genes (from 787 probe sets) were related to immune system and selected genes in this category are reported in Table III. Majority of the downregulated genes (from 359 probe sets) coded for structural proteins (Table IV). Other downregulated probe sets included SnoRNA, olfactory receptors, vomeronasal receptors and spetex proteins (data not shown). Predicted cellular, metabolic and physiological changes based on the observed differentially regulated genes in the adipose tissue of WNIN/Ob obese rats are given in Table V. Predicted metabolic changes that can lead to the development of obesity and its associated comorbidities are depicted in Fig. 2. Some of the selected candidate genes that are well known to cause obesity and associated comorbidities are given in Table VI.
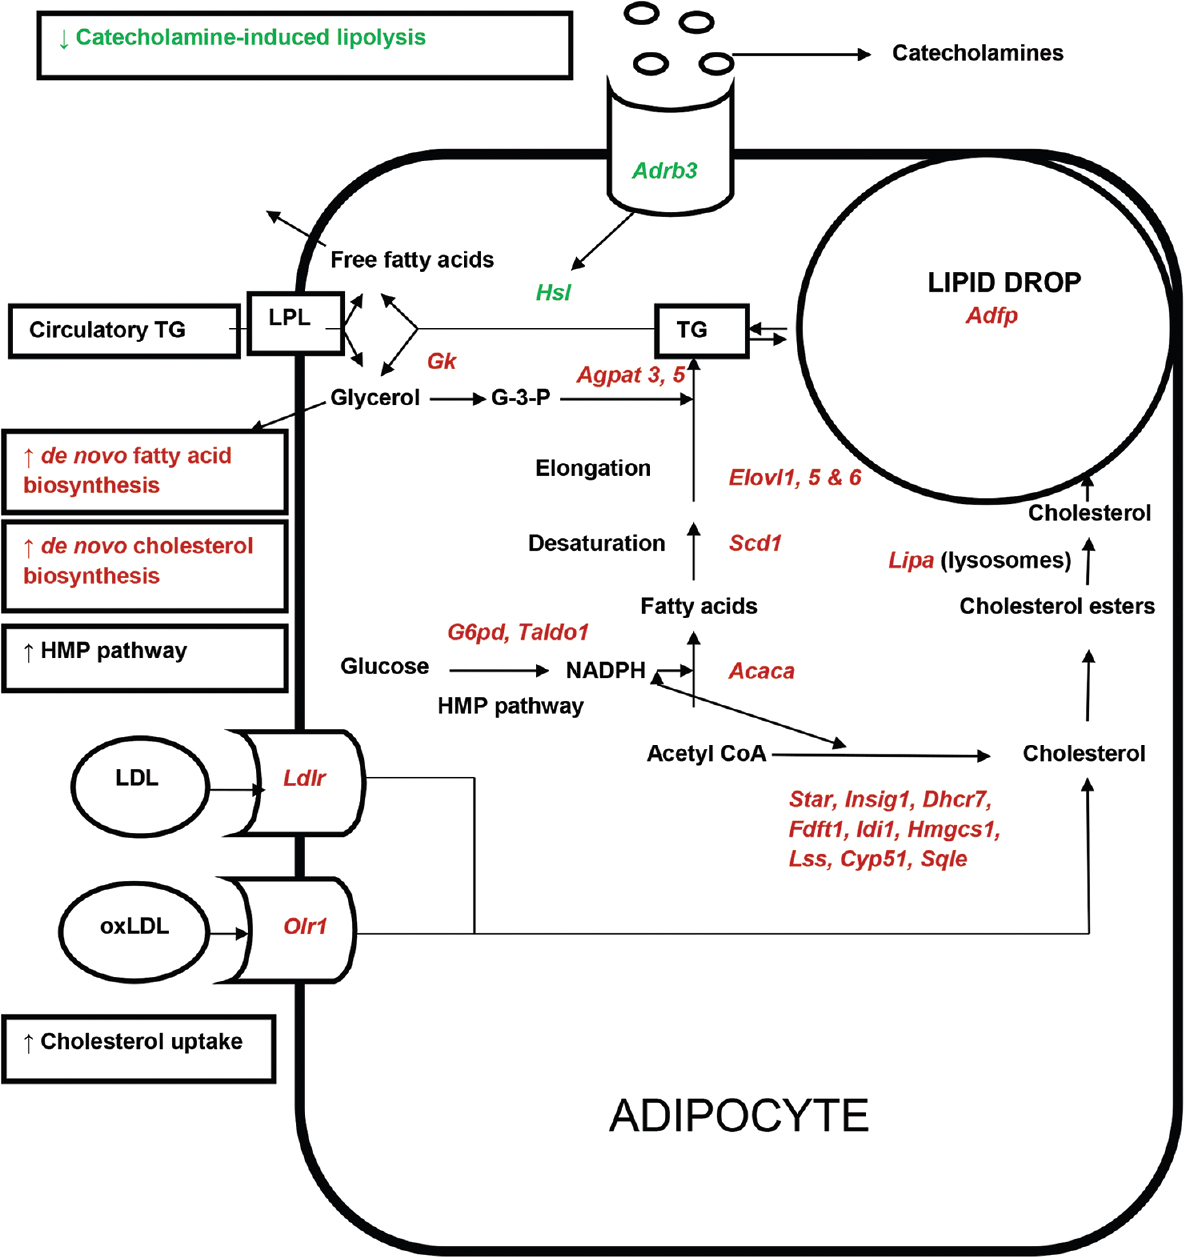
- Predicted metabolic changes in adipocyte of WNIN/Ob obese rat based on gene expression. Genes, pathways and metabolic processes indicated in green colour(downregulated) and red colour (upregulated). Acaca, Acetyl CoA carboxylase alpha; Adfp, Adipophilin; Adrb3, Beta-3 Adrenergic receptor; Agpat3,5, 1-acylglycerol-3-phosphate O-acyltransferase 3, 5; Cyp51, Lanosterol 14α-demethylase; Dhcr7, 7-dehydrocholesterol reductase; Elovl 1,5,6 Fatty acid elongase 1,5,6; Fdft1, Farnesyl-diphosphate farnesyltransferase 1, Gk, Glycerol kinase; Hmgcs1, 3-hydroxy-3-methylglutaryl-coenzyme A synthase 1; Hsl, Hormone-sensitive lipase; Idi1, Isopentenyl–diphosphate delta isomerase 1; Insig1, Insulin-induced gene 1; Ldlr, low-density lipoprotein receptor; Lipa, Lipase A; Lss, Lanosterol synthase; Olr1, Oxidized-low-density lipoprotein receptor; Scd1, Stearoyl-CoA desaturase 1; Star, Steroidogenic acute regulatory protein; Sqle, Squalene monooxygenase; Taldo1, Transaldolase 1. LPL, Lipoprotein lipase; LDL, Low-density lipoprotein; OxLDL, Oxidized LDL; TG, Triglycerides.

Differential expression of genes involved in lipid metabolism: Genes coding for enzymes involved in fatty acid biosynthesis (Acaca, Acly), elongation (Elovl 1, Elovl 5 and Elovl 6), desaturation, (Scd1), TG (Agpat3 and Agpat 5) and cholesterol biosynthesis (Dhcr7, Fdft1, Sc4mol, Idi1, Hmgcs1 and Lss) were upregulated in the adipose tissue of WNIN/Ob obese rats as compared with those of age- and sex-matched lean rats (Table II). Genes coding for enzymes involved in TG breakdown (Lipa, Pnpla3) and beta-oxidation of fatty acids (Hadhb, Cpt1b and Crot) were elevated whereas TG breakdown enzyme, hormone-sensitive lipase (HSL) (Lipe) gene was lowered in the adipose tissue of obese rats (Table II).
Differential expression of genes involved in carbohydrate metabolism and electron transport chain: Glycogen synthesizing enzyme expression (Gys2) was upregulated, whereas glycogen breakdown enzyme expressions (Pygm, Phkg1) were downregulated in the adipose tissue of WNIN/Ob obese rats as compared with those of lean rats (Table II). Expression of genes coding for glycolytic enzymes was differentially regulated in adipose tissue of obese rats. Eno1 and Gapdh gene expressions were higher, whereas Eno3, Pgam2 and Pfkm gene expressions were lower in the adipose tissue of WNIN/Ob obese rats as compared with those of lean rats (Table II). Genes coding for enzymes involved in citric acid cycle (Mdh1, Mdh2, Pdhb, and Dlat) andhexose monophosphate (HMP) pathway (G6pd and Taldo1) and genes coding for proteins involved in electron transport chain (Uqcrc2 and Cox7a2) and uncoupling (Ucp2) were elevated in the adipose tissue of obese rats as compared with those of lean rats.
Differential expression of genes coding for receptors/transcription factors: Genes coding for various receptors including melanocortin receptor (Mc5r), purinergic receptors (P2rx4, P2ry1 and P2ry10), Prostaglandin E receptors (Ptger2 and Ptger4), complement receptor (C3ar1), oxytocin receptor (Oxtr), adenosine receptor (Adora1) and platelet-activating factor receptor (Ptafr) were upregulated in the the retroperitoneal adipose tissue of WNIN/Ob obese rats as compared with those of lean rats (Table II). Genes coding for sex hormone receptors (Esr1 and Ar), adrenergic receptors (Adrb3), peroxisome-proliferator-activated receptor alpha (Ppar1a) and nuclear hormone receptors (Nr4a1) were lowered in the adipose tissue of WNIN/Ob obese rats as compared with those of lean rats (Table II).
Differential expression of genes involved in cellular stress: Expression of genes involved in defence against oxidative stress (Gsr, Mt1a, Mt2a and Cyba) was elevated while genes coding for protein involved in scavenging of free radicals (Gpx3) and heat shock proteins (Hspb6 and Hspb8) were downregulated in the adipose tissue of obese rats.
Differential expression of genes involved in apoptosis and cell proliferation: Majority of the genes related to apoptosis (Casp1, Bcl2l11, Aifm2 and Siva1) and cell cycle (Ccna2, Ccnb1, Ccnb2, Ccne1, Ccne2 and Ccnf2) were elevated in the adipose tissue of obese rats when compared to respective lean rats (Table II).
Differential expression of genes involved in protein degradation: Most of the genes that are involved in protein degradation including cathepsin genes (Ctsa, Ctsc, Ctsd, Ctsk and Ctss except Ctse), proteasome subunits (Psma1, Psma3, Psmb4 and Psmb6), ubiquitin conjugation (Ube2a and Ube2f), ubiquitin-specific peptidases (Usp12 and Usp18) and ubiquitin-fold modifier proteins (Ube2a and Ube2f) were elevated in the adipose tissue of WNIN/Ob obese rats as compared with those of lean rats (Table II).
Differential expression of genes involved in cell signalling: Genes coding for adenylate kinase (Adcy7), transforming growth factor (Tgb1), mitogen-activated protein kinase kinase (Map2k1) and caveolin (Cav2) were elevated, whereas insulin-like growth factor signalling (Igf1, Igfbp3 and Igfbp5) and bone morphogenetic protein signalling (Bmp4 and Bmp7) genes were downregulated in the adipose tissue of WNIN/Ob obese rats when compared to their respective control lean rats (Table II).
Differential expression of genes coding for microRNA: Genes coding for various miRNA (Mir675, Mir29c, Mir143, Mir145, Mir23b, Mir27a, Mir7a2 and Mir297) were downregulated in the adipose tissue of WNIN/Ob obese rats as compared with those of lean rats (Table II).
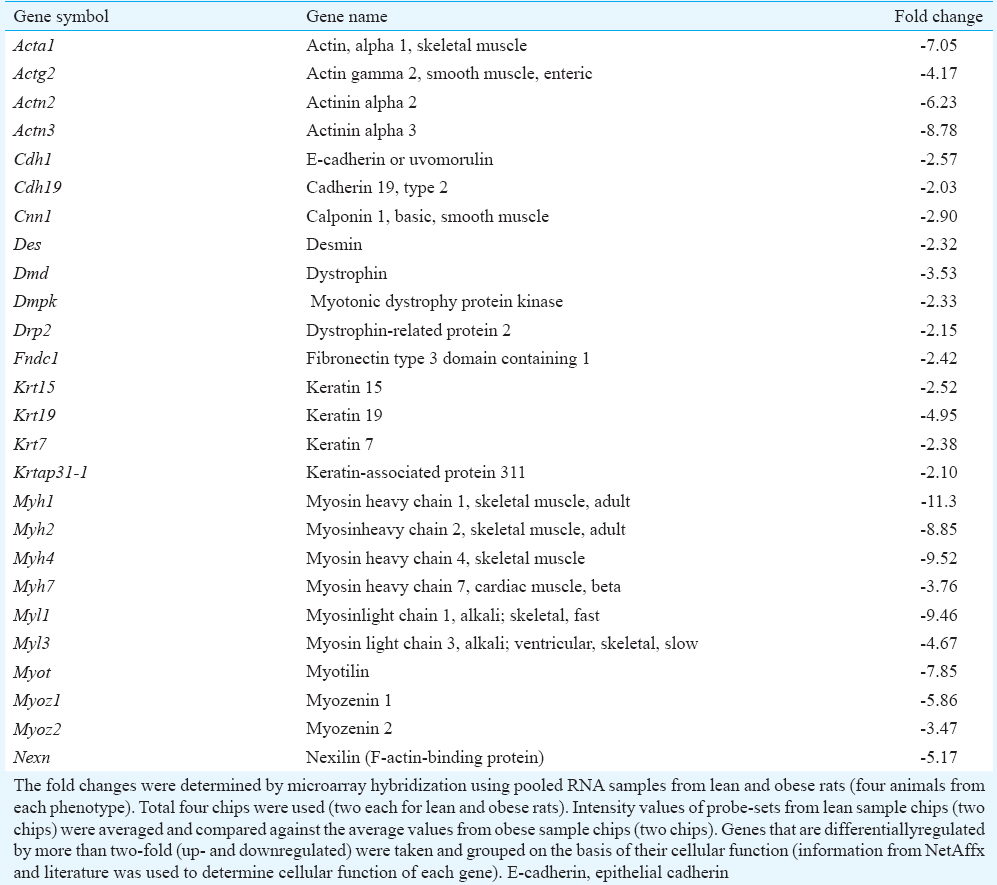
Differential expression of genes coding for proteins involved in formation of cytoskeleton, cell–to-cell interactions and extracellular matrix: Majority of the downregulated genes in retroperitoneal adipose tissue of WNIN/Ob obese rats coded for structural proteins that were involved in the formation of cytoskeleton, cell-to-cell interactions and ECM (Table IV). Genes related to cytoskeleton included actin-related proteins (such as Acta1, Actg2, Nexn and Xirp1), myosin-related proteins (such as Myh1, Myh2, Myl1 and Myl2), desmin (Des), proteins involved in the formation of cell junctions (Cdh1 and Cdh19), ECM proteins such as keratins (Krt7, Krt15 and Krt19) and collagen (Col19a1) were downregulated in adipose tissue of WNIN/Ob obese rats as compared with those of lean rats (Table IV). Genes coding for proteins involved in remodelling of ECM such as matrix metalloproteinases (Mmp12 and Mmp19) and tissue inhibitors of MMP (Timp1) were elevated in the adipose tissue of WNIN/Ob obese rats as compared with those of lean rats (Table II).
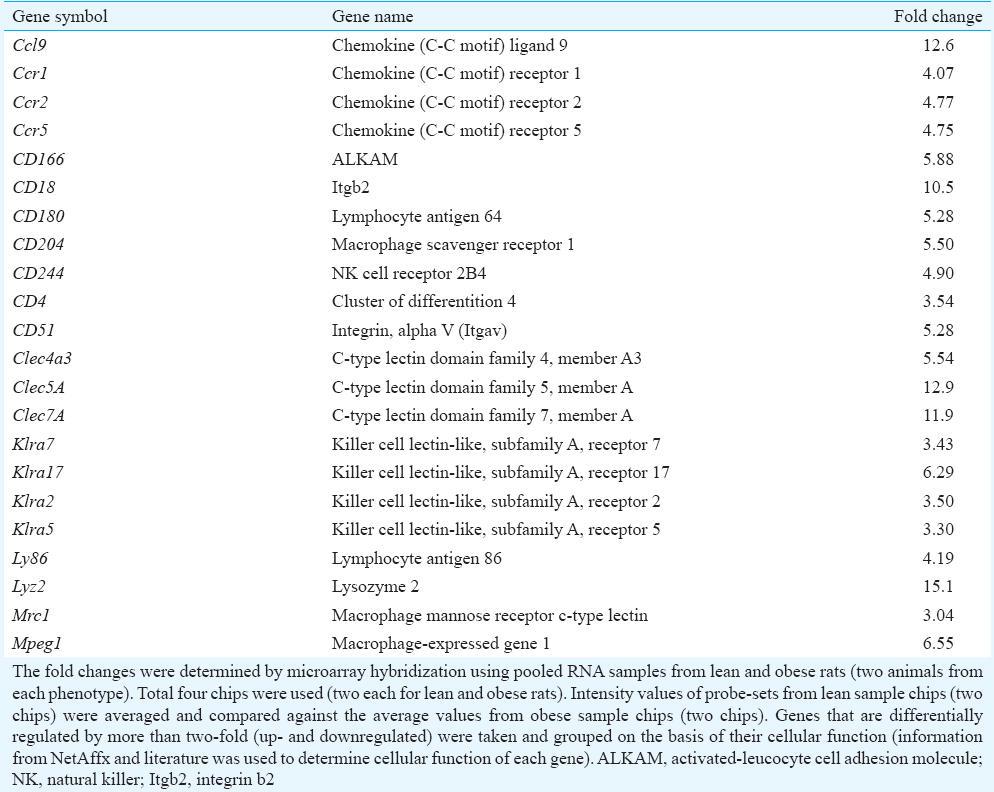
Differential expression of genes involved in immune system: Immune system-related genes made up to most of the upregulated genes in the adipose tissue of WNIN/Ob obese rats. These included clusters of differentiation (CD) genes, chemokine ligands (Ccl) and receptors (Ccr), natural killer cell receptors (klra), C-type lectin receptors (Clec) and integrins (Table III).
Validation of microarray data: Four upregulated genes (Scd1, Mpeg1, Me1 and Lipa) and three downregulated genes (adrb3, Igfbp5 and Myot) were selected for validation of microarray data by RT-PCR. All four upregulated genes showed similar observation as observed in microarray although the extent of fold change was different from microarray (Scd1, 3.6 vs. 4.52; Mpeg, 2.64 vs. 6.55; Me1, 2.17 vs. 4.6; Lipa, 4.0 vs. 11.35) (data not shown). Of the three downregulated genes, one showed significant decrease as observed in microarray (adrb3, 1.9 vs. 3.0). The fold change for other two downregulated genes (Igfbp5 and Myot) could not be quantified as their expression was very low in lean samples and not detectable in obese samples under the given conditions (data not shown).
Discussion
Elevation of genes coding enzymes involved in TG biosynthesis predict the increased re-esterification of fatty acids to TG in the adipose tissue of WNIN/Ob obese rats. Endogenously synthesized fatty acids may also contribute to adipocyte TG accumulation, as fatty acid biosynthesis genes were also elevated in this model. Elevated expression of HMP pathway genes (G6pd and Taldo1) in the adipose tissue of WNIN/Ob obese rats could provide the required reducing equivalents for the increased fatty acid and cholesterol biosynthesis. Elevation of Scd1 and Elovl 6 genes in the adipose tissue of obese rats suggests that fatty acid desaturation and elongation are increased in the adipose tissue of WNIN/Ob obese rats89.
Decreased catecholamine-induced lipolysis in adipose tissue is one of the well-characterized observations in obesity10. This is due to decreased expression of beta-adrenergic receptors and HSL10. In line with the observations in obese humans and animal models, WNIN/Ob obese rats had lowered expression of HSL gene expression which might have resulted in the increased fat accumulation in this model.
β3-AR gene expression is lower in the adipose tissue of obese rodent models, and its activation leads to fat loss and amelioration of obesity-induced insulin resistance11. Orphan nuclear receptor NR4A1 inhibits adipocyte differentiation, and it is underexpressed in the adipose tissue of obese Zucker rats and ob/ob mice12. Estrogen receptor alpha is implicated in the development of obesity, as knocking off this gene results in the increased adipose tissue mass13. AR knock-out mice develop late-onset obesity due to decreased energy expenditure14. WNIN/Ob obese rats had lower expression of genes coding for β3-AR, NR4A1, ERα and AR in the adipose tissue suggesting the role of these receptors in the development of obesity and insulin resistance in this model.
Glutathione peroxidases 1(GPx1) is expressed in the cytoplasm of majority of the cells with greater specificity towards hydrogen peroxide. GPx3, an extracellular enzyme, is the only isoform present in plasma and involved in reducing systemic oxidative stress15. Studies on obese humans and animals showed lowered plasma GPx3, due to the decreased expression of GPx3 in the adipose tissue15. GPx3 expression was low in adipose tissue of WNIN/Ob obese rats as observed in other obese animal models suggesting the possibility of increased systemic oxidative stress in this model. Elevated expression of GPx1 and glutathione reductase may be a protective mechanism against the elevated local oxidative stress in the adipose tissue of obese rats. Cathepsin S, K and D gene expressions were shown to be elevated in the adipose tissue of obese rats and animal models of obesity16 which are also elevated in the adipose tissue of WNIN/Ob obese rats.
MMPs are one important class of enzymes involved in the remodelling of ECM. The expression of MMP12 and TIMP1 genes is higher in the adipose tissue of diet-induced obese mice17. MMP 12, MMP19 and TIMP1 genes show elevated expression in the adipose tissue of obese humans17. In line with these observations, WNIN/Ob obese rats showed higher expression of genes coding for MMP12, MMP19 and TIMP1 in the adipose tissue, suggesting a possible role for ECM-remodelling and MMPs in the development of adipose tissue enlargement in this novel obese rat model.
Studies on animal models and human obesity showed elevated macrophage numbers in the adipose tissue18. Transcriptome analysis of the adipose tissue of WNIN/Ob obese rats revealed elevated expression of macrophage-specific genes such as CD68, Mpeg1 indicating the possible role of macrophages in the development of insulin resistance in this model.
The expression of various cyclin genes was elevated in adipose tissue of WNIN/Ob obese rats suggesting increased cell division in adipose tissue. However, the expression of marker genes for preadipocyte differentiation such as preadipocyte factor 1 (Pref1), CCAAT-enhancer binding proteins and peroxisome proliferator-activated receptor γ (PPAR γ) was not altered in the adipose tissue of WNIN/Ob obese rats. From these observations, it may be possible that despite enhanced clonal expansion of preadipocytes, there is no subsequent commitment of these cells to adipocytes in the adipose tissue of obese rats and at this age, adipose tissue expansion in these obese rats may be due to hypertrophy than hyperplasia. Adipocyte apoptosis is reported to be higher in animal and human obesity and considered to be responsible for infiltration of macrophages and the development of insulin resistance18. Elevated expression of apoptotic genes in the adipose tissue of WNIN/Ob obese rats along with the enhanced expression of macrophage-related genes, suggested possibly increased apoptosis of adipocytes in these obese rats.
miR143 and miR145 cluster is highly expressed in the adipose tissue and shown to increase during adipose tissue differentiation and in adipose tissue of animal models of obesity19. Mice lacking these miR143 and miR145 are protected from the diet-induced insulin resistance19. The expression of miR143 and miR145 genes was downregulated in the adipose tissue of WNIN/Ob obese rats. miR27a has been shown to be a negative regulator of adipogenesis by decreasing the expression of PPARγ20, and adipose tissue of WNIN/Ob obese rats had lower expression of miR27a.
SnoRNA catalyzes chemical modification of other classes of non-coding RNAs including rRNA, tRNA and small nuclear RNA (SnRNA). Involvement of SnoRNA has been shown in fat-induced cell death21. Except in the case of Prader-Willi syndrome, there are no studies linking SnoRNA with obesity. Probe-sets coding for snoRNA were downregulated to a major extent (more than 50-fold for some probe sets) in the adipose tissue of WNIN/Ob obese rats.
As microarray was done from whole adipose tissue, which possess majorly adipocytes along with preadipocytes, fibroblasts, immune cells, epithelial cells and nerve cells, contribution from cell types other than adipocytes to the reported gene expression changes cannot be ruled out. One of the major limitations of our study was the sample size as only two samples from each phenotype were used. Thus, careful interpretation is needed to analyse the results.
In conclusion, majority of the altered genes and pathways in the adipose tissue of WNIN/Ob obese rats were in line with the observations in other obese animal models and human obesity. Our findings indicated that WNIN/Ob obese rat model could be a good model to study the mechanisms involved in the development of obesity and associated comorbidities such as insulin resistance and dyslipidaemia. Downregulation of non-coding RNA such as SnoRNA appears to be a novel feature in this obese rat model.
Acknowledgment
Authors thank Dr B. Sesikiran, Former Director, NIN, for his constant encouragement throughout the study and Dr Thingnganing Longvah, Director-in-charge, NIN, for her support. The first author (SSSVP) acknowledges Council of Scientific and Industrial Research, India, for providing the fellowship. Authors acknowledge bioinformatics department at NIN for providing facilities for microarray data analysis, Dr Vishnuvardhan Rao and Shri Raju Naik, for help in the microarray analysis, Dr Ravikanth and Shri Sunil of Vimta Labs and Shriyut Mohanthy and Pankaj of Spinco Biotech for helping in the microarray work. Authors acknowledge Dr Surekha and Shri Muthanna for helping in microarray data analysis and Shri Vijay Kumar for helping in the documentation work.
Conflicts of Interest: None.
References
- Adipose tissue dysfunction in obesity, diabetes, and vascular diseases. Eur Heart J. 2008;29:2959-71.
- [Google Scholar]
- A microarray analysis of sexual dimorphism of adipose tissues in high-fat-diet-induced obese mice. Int J Obes (Lond). 2010;34:989-1000.
- [Google Scholar]
- Gene expression profile of omental adipose tissue in human obesity. FASEB J. 2004;18:215-7.
- [Google Scholar]
- National Institute of Nutrition. Annual report 2003-2004. Hyderabad, NIN. Available from: www.icmr.nic.in/annual/nin/annual-report_2003.htm
- Minimum information about a microarray experiment (MIAME)-toward standards for microarray data. Nat Genet. 2001;29:365-71.
- [Google Scholar]
- Role of stearoyl-CoA desaturases in obesity and the metabolic syndrome. Int J Obes (Lond). 2008;32:1076-82.
- [Google Scholar]
- Crucial role of a long-chain fatty acid elongase, Elovl6, in obesity-induced insulin resistance. Nat Med. 2007;13:1193-202.
- [Google Scholar]
- Adipocyte lipases and defect of lipolysis in human obesity. Diabetes. 2005;54:3190-7.
- [Google Scholar]
- Effect of adipocyte beta3-adrenergic receptor activation on the type 2 diabetic MKR mice. Am J Physiol Endocrinol Metab. 2006;290:E1227-36.
- [Google Scholar]
- Inhibition of adipocyte differentiation by Nur77, Nurr1, and Nor1. Mol Endocrinol. 2008;22:2596-608.
- [Google Scholar]
- Increased adipose tissue in male and female estrogen receptor-alpha knockout mice. Proc Natl Acad Sci USA. 2000;97:12729-34.
- [Google Scholar]
- Androgen receptor null male mice develop late-onset obesity caused by decreased energy expenditure and lipolytic activity but show normal insulin sensitivity with high adiponectin secretion. Diabetes. 2005;54:1000-8.
- [Google Scholar]
- Dysregulation of adipose glutathione peroxidase 3 in obesity contributes to local and systemic oxidative stress. Mol Endocrinol. 2008;22:2176-89.
- [Google Scholar]
- Cathepsin-D, a key protease in breast cancer, is up-regulated in obese mouse and human adipose tissue, and controls adipogenesis. PLoS One. 2011;6:e16452.
- [Google Scholar]
- Matrix metalloproteinases are differentially expressed in adipose tissue during obesity and modulate adipocyte differentiation. J Biol Chem. 2003;278:11888-96.
- [Google Scholar]
- Adipose tissue macrophages: their role in adipose tissue remodeling. J Leukoc Biol. 2010;88:33-9.
- [Google Scholar]
- Obesity-induced overexpression of miRNA-143 inhibits insulin-stimulated AKT activation and impairs glucose metabolism. Nat Cell Biol. 2011;13:434-46.
- [Google Scholar]
- miR-27a is a negative regulator of adipocyte differentiation via suppressing PPAR gamma expression. Biochem Biophys Res Commun. 2010;392:323-8.
- [Google Scholar]
- Small nucleolar RNAs U32a, U33, and U35a are critical mediators of metabolic stress. Cell Metab. 2011;14:33-44.
- [Google Scholar]


