
Translate this page into:
Side scatter versus CD45 flow cytometric plot can distinguish acute leukaemia subtypes
Reprint requests: Dr Tejinder Singh, Department of Pathology, Maulana Azad Medical College, New Delhi 110 002, India e-mail: tsinghmamc54@gmail.com
-
Received: ,
This is an open access article distributed under the terms of the Creative Commons Attribution-NonCommercial-ShareAlike 3.0 License, which allows others to remix, tweak, and build upon the work non-commercially, as long as the author is credited and the new creations are licensed under the identical terms.
This article was originally published by Medknow Publications & Media Pvt Ltd and was migrated to Scientific Scholar after the change of Publisher.
Abstract
Background & objectives:
Flow cytometry is an important tool to diagnose acute leukaemia. Attempts are being made to find the minimal number of antibodies for correctly diagnosing acute leukaemia subtypes. The present study was designed to evaluate the analysis of side scatter (SSC) versus CD45 flow dot plot to distinguish acute myeloid leukaemia (AML) from acute lymphoblastic leukaemia (ALL), with minimal immunological markers.
Methods:
One hundred consecutive cases of acute leukaemia were evaluated for blast cluster on SSC versus CD45 plots. The parameters studied included visual shape, CD45 and side scatter expression, continuity with residual granulocytes/lymphocytes/monocytes and ratio of maximum width to maximum height (w/h). The final diagnosis of ALL and AML and their subtypes was made by morphology, cytochemistry and immunophenotyping. Two sample Wilcoxon rank-sum (Mann Whitney) test and Kruskal-Wallis equality-of-populations rank tests were applied to elucidate the significance of the above ratios of blast cluster for diagnosis of ALL, AML and their subtypes. Receiver operating characteristic (ROC) curves were generated and the optimal cut-offs of the w/h ratio to distinguish between ALL and AML determined.
Results:
Of the 100 cases, 57 of ALL and 43 cases of AML were diagnosed. The median w/h ratio of blast population was 3.8 for ALL and 1 for AML (P<0.001). ROC had area under curve of 0.9772. The optimal cut-off of the w/h ratio for distinction of ALL from AML was found to be 1.6.
Interpretation & conclusions:
Our findings suggest that if w/h ratio on SSC versus CD45 plot is less than 1.6, AML may be considered, and if it is more than 1.6, ALL may be diagnosed. Using morphometric analysis of the blast cluster on SSC versus CD45, it was possible to distinguish between ALL and AML, and their subtypes.
Keywords
Acute leukaemia
ALL
AML
CD45
flow cytometry
side scatter
subtypes

Flow cytometry (FCM) is emerging as an important tool for the diagnosis of acute leukaemia1. With increasing numbers of monoclonal antibodies for haematopoietic cell markers becoming commercially available, routine flow cytometry panels are expanding up to 14 antibody panels with a concomitant increase in reagent cost2. However, clinical treatment is based predominantly on distinction between acute myeloid leukaemia (AML) from acute lymphoblastic leukaemia (ALL).
In the last decade, many flow cytometry laboratories attempted to find the minimal number of antibodies that could correctly diagnose acute leukaemia345. Consensus reagents for initial evaluation for haematopoietic neoplasm include a large number of antibodies. Haycocks et al6 have proposed 7 B-cell markers, 8 T-cell markers, and 12 myelomonocytic markers. Matarraz et al7 have proposed CD34 as well as monocytic markers along with myeloid markers for monocytic leukaemia.
In order to cut the cost of reagents, efficient means of triaging are being explored. The present study was designed to evaluate the detailed analysis of side scatter (SSC) versus CD45 dot plot for distinguishing AML from ALL with minimal immunological markers.
Material & Methods
One hundred newly diagnosed consecutive cases of acute leukaemia coming from the departments of Pathology, Medicine, Paediatrics at Lok Nayak Hospital, Delhi, India, from 2011 to 2013, were included in the study. The purposive sample size of 100 was considered keeping in view of feasibility as well as availability of the patients during the study period. Ethical clearance was taken from the ethics committee of Maulana Azad Medical College (MAMC), New Delhi. Informed written consent was taken from all participants.
Detailed clinical history including age, gender, duration of illness, pallor, weakness, fever, recurrent infections, bleeding, etc. was recorded. Physical examination included general physical examination and search for hepatosplenomegaly, sternal tenderness and lymphadenopathy, etc. Complete haemogram along with peripheral smear, bone marrow aspiration or biopsy were done as part of diagnostic work up. The peripheral smear (PS), bone marrow aspiration (BMA) and imprint slides were stained with Giemsa stain and blast count and morphology were evaluated. Cytochemistry on PS/BMA was done using myeloperoxidase (MPO), non-specific esterase (NSE), acid phosphatase and periodic-acid Schiff (PAS). A provisional diagnosis of ALL/AML based on morphology and cytochemistry was made.
Flow cytometry was performed on peripheral blood/bone marrow aspirate in EDTA on Beckman Coulter flow cytometer (FC500) using a panel of markers comprising CD10, CD19, CD20, CyCD22, CyCD3, CD2, CD5, CD7, CD13, CD33, CD117, CD11c, CD34, HLA-DR and CD45. Blood sample (2 ml) was collected in EDTA vial. Further processing was done using whole blood lyse method8. Test sample was prepared from whole blood/BMA by diluting it with isotone so that a total count of 3 to 5×10⁵ cells per tube was obtained.
Blasts were gated using side scatter versus CD45 plot and expression of the various surface and cytoplasmic markers was analyzed on this population. Cut-offs for surface markers were taken as ≥20 per cent and ≥10 per cent for cytoplasmic markers8.
The side scatter (SSC) versus CD45 plots were evaluated ensuring that CD45 was on x axis and SSC on y axis and the plot dimensions were constant in all plots (x axis with markings from 0-103 measuring 6 cm and y axis with markings from 0-1023 measuring 4.7 cm). The SSC versus CD45 plots were evaluated for visual shape of the blast cluster, its CD45 expression, side scatter expression and its continuity with residual granulocytes/lymphocytes/monocytes. Visually, shape was considered to be horizontally oval, when elongated and parallel to x axis and oval to vertically oval in others. CD45 expression was evaluated as negative (0-100), dim (100-101), moderate (101-102) and bright (>102), and SSC was graded as low (0-200), moderate (200-400) and high (>400). Wherever the CD45/SSC expression was variable, the brighter value was noted9.
A morphometric evaluation of the blast cluster was carried out. The maximum width and maximum height of the blast cluster was measured with the arithmetic scale at 100 per cent magnification on A4 size print out and ratio between maximum width and maximum height (w/h) of the cluster was recorded for each case.
Bone marrow biopsy and immunohistochemistry (IHC) were performed wherever required. The final diagnosis was made by clinical examination, morphology and cytochemistry, and immunophenotyping (IHC and FCM). ALL was subdivided into B-ALL and T-ALL and AML was subdivided into AML M0 to M7 FAB (French-American-British) subtypes10.
Statistical analysis: Median w/h ratios were calculated for each group and compared. Statistical analysis was done using STATA 11.1 software (STATA Corporation, Texas, USA). Two-sample Wilcoxon rank-sum (Mann-Whitney) test and Kruskal-wallis equality-of-populations rank test were performed to find out the significance of the w/h ratios of blast cluster on SSC versus CD45 plot, to differentiate ALL from AML and for their further subtyping. To clarify this point, Wilcoxon rank-sum test was used for quantitative parameters between the two groups. For subgroup analysis of AML involving three categories M3, M6, M7, Kruskal Wallis ANOVA was used.
Sensitivity and specificity of the w/h ratio were calculated using the final diagnosis as gold standard at different cut-off values. Based on these, receiver operating characteristic (ROC) curves were generated and optimal cut-off values of the w/h ratio to differentiate between ALL and AML obtained.
Results
The age of patients (n=100) ranged between 0.25 to 65 yr with mean age of 19.9±17.28 yr. There were 62 males and 38 females (M:F:1.63:1).
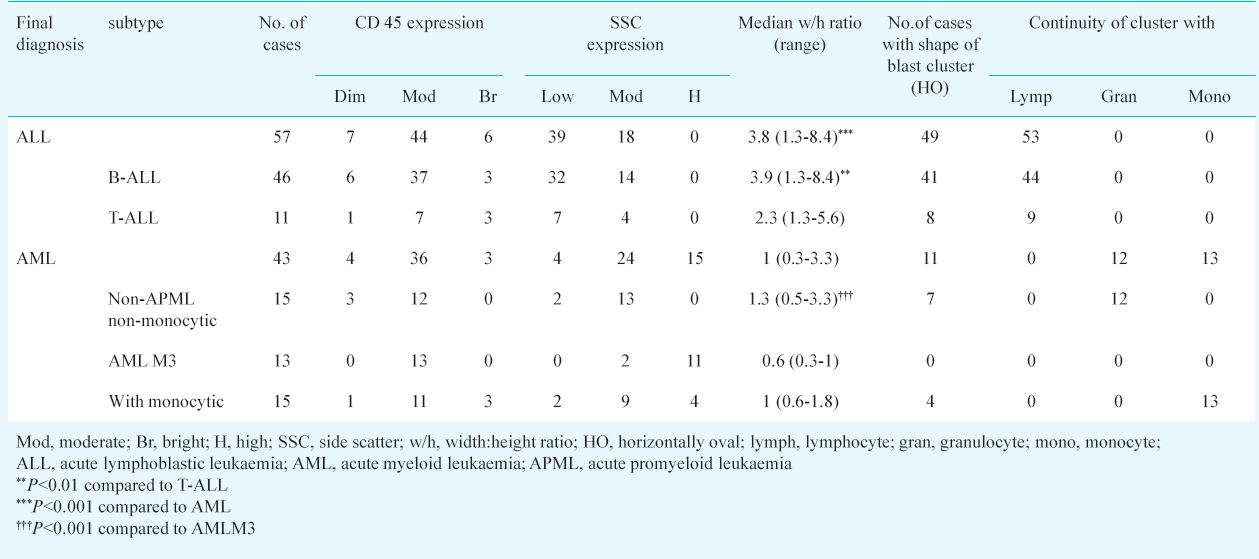
Based on morphology, cytochemistry and immunophenotyping 57 cases of ALL and 43 cases of AML were diagnosed. Amongst ALL cases, 46 were B-ALL and 11 were T-ALL. AML subtypes included three cases of AML M0, seven of AML M1, four of AML M2, 13 of AML M3, three of AML M4, 12 of AML M5 and one case of AML M7. Analysis of SSC versus CD45 plot showed CD45 dim in seven (12.2%), moderate in 44 (77%) and bright in six (10%) ALL cases. SSC was low in 39 (68%) and moderate in 18 (32%) of the 57 cases of ALL. The visual impression of the shape of blast cluster was horizontally oval along CD45 axis in 49 of 57 ALL (Table I, Fig. 1).

- SSC vs CD45 flow plot showing blast cluster with width/height ratio ≥ 1.6 in a case of ALL.
CD45 expression was dim in four (9%), moderate in 36 (83%) and bright in three (7%) of the 43 cases of AML and SSC was low in four (9%), moderate in 24 (56%) and high in 15 (34.8%). The visual impression of shape of blast cluster was horizontally oval along CD45 axis in only 11 of 43 cases. It was oval to vertically oval in 32 of 43 cases. (Table I, Fig. 2).

- SSC vs CD45 flow plot showing blast cluster with width/height ratio < 1.6 in a case of AML.
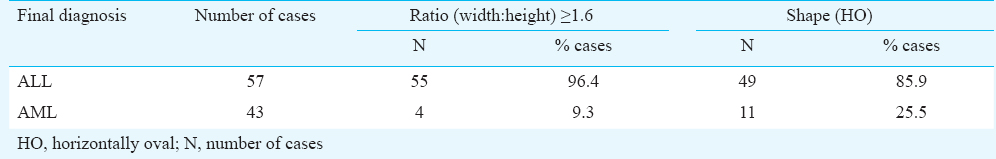
The median w/h ratio for ALL was 3.8 (range 1.3-8.4) which was significantly higher (P<0.001) than that of AML (1, range 0.3-3.3) (Table I). Based on the ROC curve generated, the optimal cut-off of the w/h ratio for distinction of ALL from AML was found to be 1.6 (Fig. 3). At this cut-off area under the curve was 0.9772, sensitivity was 96.49 per cent, specificity was 90.70 per cent (with respect to gold standard) and it was accurate in 94 per cent cases.
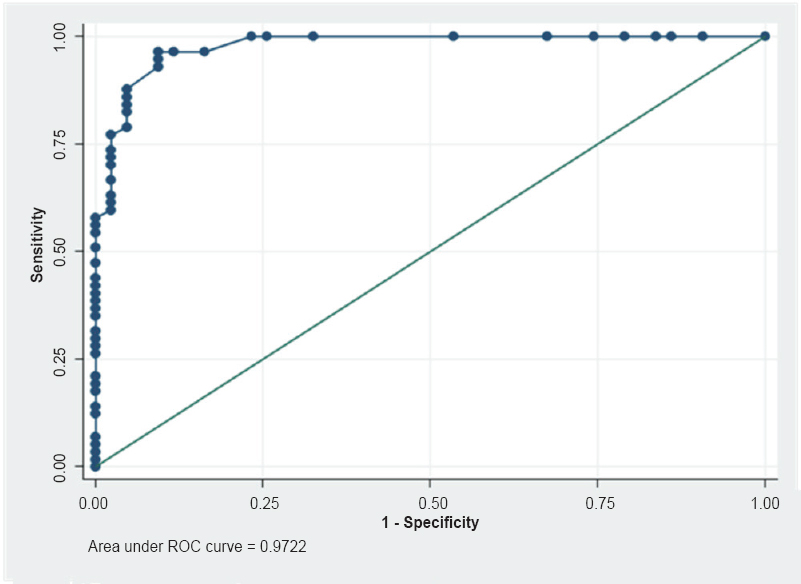
- Receiver operating characteristic (ROC) curve showing optimal cut-off of width/height ratio of 1.6 of blast cluster for diagnosis of ALL versus AML.
Fifty five of the 57 ALL cases and four of 43 AML cases had ratio more than or equal to 1.6 (Table II). Blasts were seen to be continuous with lymphocytes in 53 of 57 ALL cases. (Table I). Amongst AML cases, continuity with granulocytes was seen in 12 of 15 non-APML (acute promyeloid leukaemia) non-monocytic group and with monocytes in 13 of 15 monocytic AML. In the remaining two cases of monocytic AML the entire gated cluster was present in the monocytic region (Table I).
Subgroup analysis of ALL showed that B-ALL had a median w/h ratio of 3.9 (1.3-8.4) and T-ALL had a median w/h ratio of 2.3 (1.3-5.6) (P<0.01) (Table I). Subgroup analysis for AML (Table I) showed that non-APML non-monocytic group of AML (including AML M0, AML M1, AML M2, AML M7) had a median w/h ratio of 1.3, AMLM3 had a median w/h ratio of 0.6 and AML with monocytic differentiation (AML M4 and AML M5) had a median w/h ratio of 1. The difference between these three subgroups was found to be significant (P<0.001).
The difference between the w/h ratio of non-APML non-monocytic AML group versus AML M3 was significant (P<0.001) and versus AML with monocytic differentiation showed borderline significance (P=0.057). However, the latter could easily be differentiated from non-APML non-monocytic group by its continuity to monocytic region cells/discrete significant monocytic cluster while the first subgroup showed continuity with maturing granulocytes, wherever present.
The difference between the w/h ratio of AML M3 versus AML with monocytic differentiation was significant (P<0.01). The former cluster was not in the monocytic region and did not show continuity with the monocytic cells. Also, the difference between the w/h ratio of AML M3 was significantly lower than all the non-APML combined (P<0.001).
Discussion
Acute leukaemia is a common haematological malignancy. It is important to differentiate between lymphoid and myeloid acute leukaemia as these have different treatments. Due to the large number of antibodies in current use in acute leukaemia panel, the cost of immunophenotyping is often high and out of reach for many patients in developing countries. To minimize the panel of antibodies without missing the diagnosis, attempts are being made to evolve cost cutting methods6.
In our study, in the majority of cases of ALL the blast cluster had moderate CD45 (77%) and low SSC (68%) whereas in the majority of AML cases the blast cluster had moderate CD45 (84%) and moderate SSC (56%) and bright SSC (35%).
Haycocks et al6 found that blasts of AML were usually localized as a round/oval cluster and the blasts of ALL distributed along the CD45 axis in the CD45 versus SSC. This may be due to myeloblasts having small variation in CD45 expression and production of primary granules11. Lymphoblasts usually lack cytoplasmic granules, and are more uniform on the SSC axis. However, these show larger variation in surface CD45 expression; thus, often distribute along the CD45 axis11.
In the present study an attempt was made to identify an objective parameter on the SSC versus CD45 gated blasts to distinguish between ALL and AML. The w/h ratio on SSC versus CD45 plot was found to be a sensitive and specific test to differentiate between ALL and AML, and it was found that a cut-off ratio of 1.6 effectively differentiated between ALL and AML (sensitivity: 96.49%, specificity: 90.7%).
It was observed that in the ALL, the blast cluster was mostly continuous with lymphocytes whereas in non-APML non-monocytic AML the clusters were mostly continuous with maturing granulocytes. In AML with monocytic differentiation, the blast cluster was continuous with monocytes. It has been reported that the association of the blast populations with their normally maturing counterparts may also contribute to lineage identification of blasts6.
An observation of this study was the role of w/h ratio in subtyping of ALL and AML.
Amongst ALL cases, T-ALL was found to have a w/h ratio of 2.3 (1.3-5.6) versus 3.9 (1.3-8.4) of B-ALL. It is possible that this w/h ratio of T-ALL may be due to presence of internal complexities/granules. Amongst AML cases, it is clinically important to differentiate APML from other AMLs since it has a different biology and responds well to all-trans-retinoic acid (ATRA)12. The w/h ratio was found to be effective in differentiation of APML from all other AML. Hence it is suggested that instead of using the entire CD panel of antibodies upfront, SSC versus CD45 dot plot analysis initially can give a clue to add further antibody panel in a particular case. In case, w/h ratio is less than 1.6, further panel of AML antibodies may be put for confirmation along with limited lymphoid markers to exclude mixed phenotypic acute leukaemia (MPAL). Similarly, if w/h ratio is equal to or more than 1.6, a panel of ALL markers along with MPO may be used for confirmation to exclude MPAL13. This rare type of acute leukaemia has blast cells which express myeloid and/or lymphoid markers and, is mainly diagnosed using flow cytometry14. If facilities exist, more markers may also be put for aberrant expression detection15.
One limitation of the current study is that since the ratio of w/h may change if the plot is stretched asymmetrically, the dimensions of the x and y axis of the plot should remain in the fixed ratio. Alternatively, each laboratory may develop its own cut-offs of w/h ratios and subsequently stick to the same ratio of x and y axis of dot plots
Thus, it is concluded that, based on analysis of SSC versus CD45 plot, correct treatment can be instituted in most of the leukaemia patients, with minimal cost incurred for diagnosis. However, in case there is no financial constraint, it is suggested that the entire panel may be used to detect aberrant markers.
Acknowledgment
Authors acknowledge help of Dr S.N Dwivedi, Department of Biostatistics, AIIMS, New Delhi, for statistical analysis of the data.
Conflicts of Interest: None.
References
- Utilization of flow cytometry for diagnosis of hematologic malignancies in Thailand: increasing trends and diagnostic yields in 7,982 samples. J Med Assoc Thai. 2014;97:1296-301.
- [Google Scholar]
- Flow cytometry immunophenotyping in integrated diagnostics of patients with newly diagnosed cytopenia: one tube 10-color 14-antibody screening panel and 3-tube extensive panel for detection of MDS-related features. Int J Lab Hematol. 2015;37(Suppl 1):133-43.
- [Google Scholar]
- Optimal number of reagents required to evaluate hematolymphoid neoplasias: results of an international consensus meeting. Cytometry. 2001;46:23-7.
- [Google Scholar]
- Discriminant function analysis as decision support system for the diagnosis of acute leukemia with a minimal four color screening panel and multiparameter flow cytometry immunophenotyping. Leukemia. 2007;21:1204-11.
- [Google Scholar]
- 2006 Bethesda International Consensus recommendations on the immunophenotypic analysis of hematolymphoid neoplasia by flow cytometry: optimal reagents and reporting for the flow cytometric diagnosis of hematopoietic neoplasia. Cytometry B Clin Cytom. 2007;72(Suppl 1):S14-22.
- [Google Scholar]
- Optimizing antibody panels for efficient and cost-effective flow cytometric diagnosis of acute leukemia. Cytometry B Clin Cytom. 2011;80:221-9.
- [Google Scholar]
- Introduction to the diagnosis and classification of monocytic-lineage leukemias by flow cytometry. Cytometry B Clin Cytom 2015 August 18 DOB
- [Google Scholar]
- Flow Cytometry in Haematopathology (2nd ed). New Jersey: Humana Press; 2003.
- The contribution of cytochemistry and immunophenotyping to the reproducibility of the FAB classification in acute leukemia. Blood. 1986;68:900-5.
- [Google Scholar]
- Bone marrow pathology (2nd ed). Chicago, IL: ASCP Press; 2001. p. :265.
- Haematological & molecular profile of acute myelogenous leukaemia in India. Indian J Med Res. 2009;129:256-61.
- [Google Scholar]
- Clinico-hematological profile in biphenotypic acute leukemia. Indian J Cancer. 2009;46:160-8.
- [Google Scholar]
- The specific features of diagnosis of mixed-phenotype acute leukemia: A combination of B-cell antigen expressions according to the results of flow cytometry and morphological markers of myeloid differentiation in blast cells: A clinical case. Ter Arkh. 2015;87:97-100.
- [Google Scholar]
- Expression of aberrant CD markers in acute leukemia: A study of 100 cases with immunophenotyping by multiparameter flowcytometry. Cancer Biomark. 2015;15:501-5.
- [Google Scholar]


