
Translate this page into:
Serological survey for SARS-CoV-2 antibodies among tribal communities of Odisha post-second wave
For correspondence: Dr Sanghamitra Pati, ICMR-Regional Medical Research Centre, Chandrasekharpur, Bhubaneswar 751 023, Odisha, India e-mail: drsanghamitra12@gmail.com
-
Received: ,
This article was originally published by Wolters Kluwer - Medknow and was migrated to Scientific Scholar after the change of Publisher.
Abstract
Background & objectives:
Serial national level serosurveys in India have provided valuable information regarding the spread of COVID-19 pandemic in the general population, but the impact of the ongoing pandemic on the tribal population in India is not well understood. In this study, we evaluated the seroprevalence of COVID-19 antibodies in the tribal population of Odisha post-second wave (September 2021).
Methods:
A population-based, age-stratified, cross-sectional study design was adopted for the survey, carried out in seven tribal districts of Odisha from 30th August to 16th September 2021. A multistage random sampling method was used where serum samples were tested for antibodies against the SARS-CoV-2 nucleocapsid (N) protein in each district, and a weighted seroprevalence with 95 per cent confidence interval (CI) was estimated for each district.
Results:
A total of 2855 study participants were included from the seven tribal districts of Odisha in the final analysis. The overall weighted seroprevalence was 72.8 per cent (95% CI: 70.1-75.3). Serological prevalence was the highest among 18-44 yr (74.4%, 95% CI: 71.3-77.3) and from Sambalpur district [75.90% (66.90-83.10)]. Among participants, 41.93 per cent had received at least one dose of any COVID-19 vaccine. Kandhamal district had the highest number of fully immunized participants (24.78%), and in Sundergarh district, most of the study participants (58.1%) were unimmunized.
Interpretation & conclusions:
This study found high seroprevalence against SARS-CoV-2 in the tribal population of Odisha. The vaccination coverage is at par with the general population, and efforts to address some knowledge gaps may be needed to improve the coverage in the future.
Keywords
COVID-19
Odisha
SARS-CoV-2
seroprevalence
serosurvey
tribal population

The COVID-19 pandemic has spread to almost all countries of the world affecting over 258 million persons and causing over 5.16 million deaths1. While India accounts for around 34.54 million of these cases and 0.46 million deaths, the State of Odisha in Eastern India has reported around 1.04 million cases, largely spread over the two waves2. India introduced vaccines against COVID-19 in a phased manner in January 20213. The vaccination coverage has increased steadily, with over a billion doses across India and over 42 million in Odisha completed at present2. Vaccination has since added another layer to the existing dynamics of population-level immunity against SARS-CoV-2.
While there have been four rounds of national serological surveys undertaken in India since December 2020, similar surveys have also been undertaken in the State of Odisha in targeted urban and rural regions4-6. The National Serosurvey fourth round has shown a seroprevalence of SARS-CoV-2 antibodies in two tribal-dominated districts of Odisha in Koraput (32.6%) and Rayagada (37.3%) but not exclusively in the tribal community7. Such surveys would also help inform the levels and trends of immunity among specific vulnerable groups including the tribal population with an expanding vaccination programme in the backdrop.
Scheduled tribes (STs) constitute around eight per cent of the population in India and are generally residents in well-recognized pockets8. Odisha is unique among Indian States in that it has a significant (22.85% of ST population) and diverse [62 STs and 13 Primitive Vulnerable Tribal Groups (PVTGs)] tribal population9. These indigenous communities are generally considered socially and economically marginalized and at a disproportionately higher risk in case of public health emergencies10,11. While there is some evidence that tribal communities in India report a lower caseload and higher recovery rates, the mechanisms are not well understood12,13.
A serological survey was hence carried out to estimate and compare the age-specific prevalence of SARS-CoV-2 antibodies in tribal populations across Odisha, India. Since the study population in this survey exclusively involved the tribes of Odisha, which makes this first of its kind and will help plan and implement various upcoming tribal-level policy-making decisions of the State.
Material & Methods
A population-based, age-stratified, cross-sectional study design was adopted for the present survey based on the survey design and sampling framework adopted for national serosurveys by the Indian Council of Medical Research (ICMR)4,5. A written informed consent, parents/guardians informed consent and assent were obtained for study participants. Approval from the State Ethics Committee and the Institutional Human Ethical Committee on human research was taken from ICMR-Regional Medical Research Center (RMRC), Bhubaneswar. The study was conducted from August 30 to September 16, 2021 in seven districts of Odshia State (tribal sub-plan areas) where the tribal population is 50 per cent or more14. The profile of study districts is provided in Supplementary Table I. The total population of the seven districts is 20.1 per cent of the total population of Odisha. Overall, tribal population in the seven districts constitutes 61.8 per cent of the total population of the study districts.
| District name | Population | Male | Female | ST |
|---|---|---|---|---|
| Sambalpur | 1,041,099 | 526,877 | 514,222 | 34.12% |
| Sundargarh | 2,093,437 | 1,061,147 | 1,032,290 | 50.75% |
| Keonjhar | 1,801,733 | 906,487 | 895,246 | 45.45% |
| Kalahandi | 1,576,869 | 787,101 | 789,768 | 28.5% |
| Kandhamal | 733,110 | 359,945 | 373,165 | 53.58% |
| Mayurbhanj | 2,519,738 | 1,256,213 | 1,263,525 | 58.71% |
| Nabarangapur | 1,220,946 | 604,812 | 510,604 | 55.79% |
ST, scheduled tribe
Multistage random sampling method was used where clusters within the districts were selected through probability proportionate to size, and households in clusters were selected by systematic random sampling. The sample size for each district was calculated to be 395 (rounded off to 400) with an assumption of an expected prevalence of 50 per cent (reported in previous surveys), relative precision of 16 per cent, design effect of 2.5 and non-response rate of 10 per cent for a 95 per cent level of confidence15. Ten clusters in each district (a total of 70 clusters) were selected using the probability proportionate to size (PPS) sampling methodology using household population size from the census16. At least 40 consenting individuals (4 aged 6-9 yr, 8 aged 10-17 yr and 28 aged 18 yr and above) were enrolled from each cluster.
Households whose adults agreed to provide written informed consent for themselves and their children were included in the study. Pregnant women, bedridden patients and those with recognizable cognitive impairment were excluded from participating. Data were collected in an electronic data collection tool Open Data Kit (Open Source). Venous blood samples (3 ml) were collected in a gel vacutainer and were transferred to a local healthcare facility in less than 6 h (maintaining cold chain) for centrifugation. Separated serum from whole blood was tested in the ICMR-RMRC, Bhubaneswar, to determine the presence of total antibodies, including IgG antibodies against SARS-CoV-2 nucleocapsid (N) protein. IgG antibodies against N-protein was tested for all participants in an automated analyzer Cobas e411 (Roche Diagnostics, GmbH, Mannheim, Germany) using Elecsys anti-SARS-CoV-2 kit insert. Cut-off index (CoI) values of <1.0 were considered as nonreactive and CoI of ≥ 1.0 as reactive.
The seroprevalence of COVID-19 for each study district was estimated. The design weights in our analyses were accounted for and calculated as the product of the inverse of the sampling fraction for the selection of individuals, households, and clusters within each district17 (Supplementary Annexure). Persons who had received two doses of any approved COVID-19 vaccine and where at least 14 days had passed since the 2nd dose were considered ‘fully immunized’. Those who had not received any dose of vaccine were categorized as ‘unimmunized’ and the remaining as ‘partially immunized’. Analysis was carried out in the statistical software R version 4.0.3 (R Foundation for Statistical Computing, Vienna, Austria)18. The prevalence was calculated for seven districts using the presence of antibodies against SARS-CoV-2 with 95 per cent confidence interval (CI).
Results & Discussion
A total of 3127 households were approached and 2855 participants were included in the final analysis with an overall non-response rate of 6.14 per cent across all districts. Figure 1 provides the flow diagram of sample collection process. The overall weighted seroprevalence was 72.8 per cent (95% CI: 70.1-75.3) across all districts in Odisha. National serosurvey reports have shown a steady increase in the population level seroprevalence, from 0.73 per cent (95% CI: 0.34-1.13) in May-June 2020 to 24.1 per cent (95% CI: 23.0-25.3%) in December 2020-January 20215,19. Similarly, in the region, surveys in Delhi, Mumbai and Bhubaneswar in the urban areas have reported a seroprevalence between 24.71 per cent (95% CI: 24.01-25.42), 17.3 per cent (95% CI: 16 to 18.7) and 49.04 per cent (95% CI 46.39–51.68), respectively20-22. The fact that seroprevalence in a population is a function of time and the progression of the pandemic is well recognized, and repeated cross-sectional surveys from Indian cities such as Delhi, Mumbai and Bhubaneswar have shown such increasing trends20-22, the findings suggest that the pandemic has affected these groups similar to the general rural population in this region. This indicates a resumption of existing interconnections in the rural areas and forests after the inevitable relaxation of the restrictions imposed during the lockdowns. Furthermore, unawareness regarding the disease and protocols to prevent contamination were the other reasons for the spread.
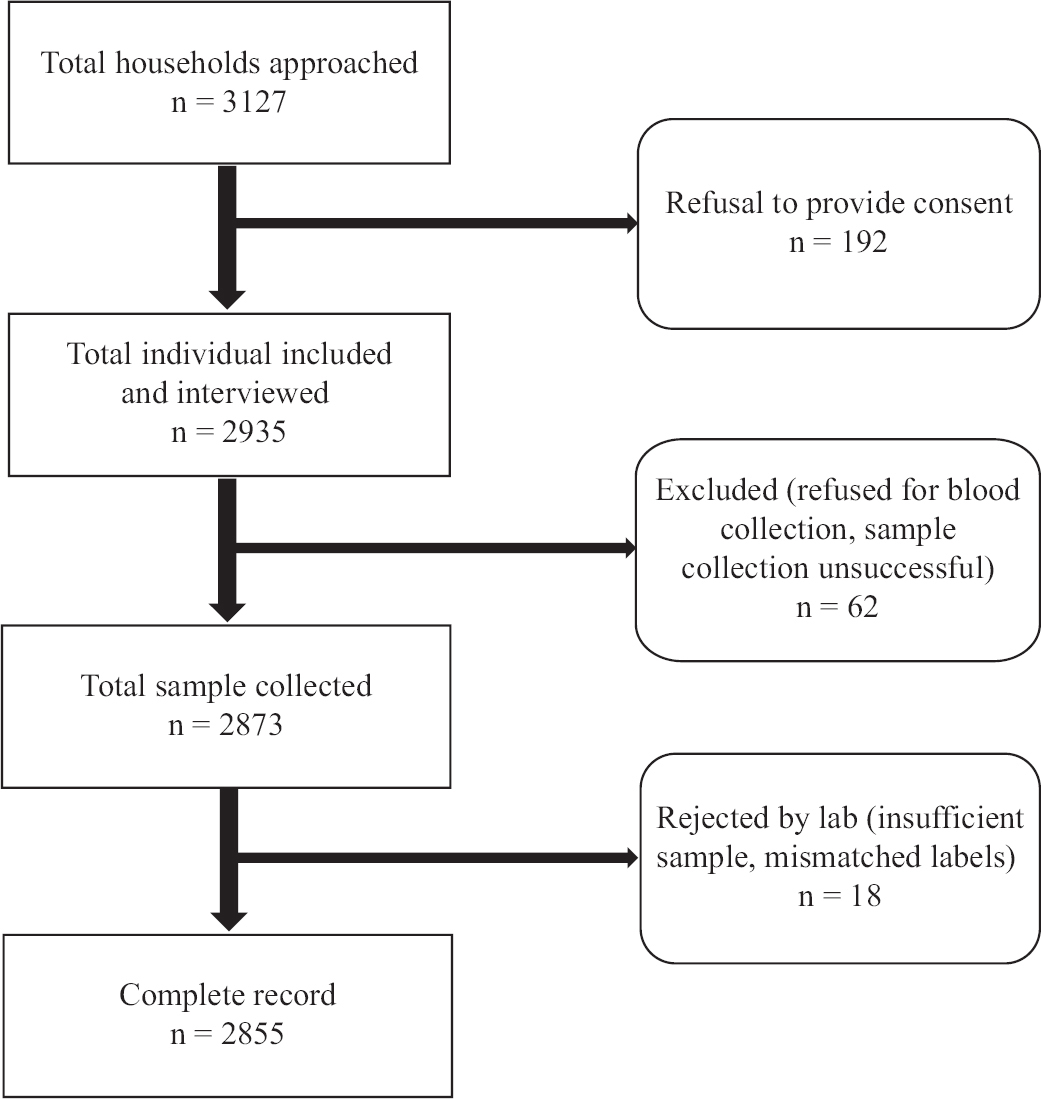
- Study flow diagram of the sample collection process.
The sociodemographic characteristics of the survey participants are depicted in the Table. The seroprevalence was found higher among males (74.2%, 95% CI: 71.5-76.8) than females (71.7%, 95% CI: 68.0-75.2); there was no significant difference across them. However, the higher prevalence in males may be explained by the relatively better vaccination coverage23.
| Characteristic | Ab against SARS-CoV-2 | Total | Vaccination status | Total | ||||
|---|---|---|---|---|---|---|---|---|
| Positive (n) | Seroprevalence, % (95% CI) | Weighted seroprevalence, % (95% CI) | Unimmunized, n (%) | Partially immunized, n (%) | Fully immunized, n (%) | |||
| Gender | ||||||||
| Male | 897 | 73.9 (71.3-76.3) | 74.2 (71.5-76.8) | 1213 | 123 (14.9) | 352 (42.8) | 347 (42.2) | 1162 |
| Female | 1194 | 72.7 (70.4-74.8) | 71.7 (68.0-75.2) | 1642 | 245 (21.0) | 508 (43.7) | 409 (35.2) | 822 |
| Age group (yr) | ||||||||
| 6-9 | 203 | 70.0 (64.3-75.2) | 68.6 (61.7-74.7) | 290 | - | - | - | - |
| 10-17 | 432 | 74.3 (70.5-77.8) | 73.8 (69.3-77.9) | 581 | - | - | - | - |
| 18-44 | 940 | 74.4 (71.9-76.8) | 74.4 (71.3-77.3) | 1262 | 154 (12.2) | 593 (46.9) | 515 (40.8) | 1262 |
| 45-60 | 374 | 72.9 (68.8-76.7) | 72.9 (67.4-77.7) | 513 | 153 (29.8) | 197 (38.4) | 163 (31.7) | 513 |
| >60 | 142 | 67.9 (61.1-74.2) | 66.4 (57.7-74.1) | 209 | 61 (29.1) | 70 (33.4) | 78 (37.3) | 209 |
| Ethnicity | ||||||||
| Listed ST | 1867 | 73.9 (72.1-75.6) | - | 2526 | 342 (19.4) | 806 (45.8) | 610 (34.7) | 1758 |
| PVTG | 224 | 68.0 (62.7-73.0) | - | 329 | 26 (11.5) | 54 (23.89) | 146 (64.6) | 226 |
ST, scheduled tribes; PVTG, particularly vulnerable tribal groups; Ab, antibodies; CI, confidence interval
Serological prevalence was the highest among 18-44 yr (74.4%, 95% CI: 71.3-77.3). The seroprevalence among children aged 6-9 yr was 68.6 per cent and among those aged 10-17 yr was 73.8 per cent. This was similar to other age groups of study participants, indicating a uniform spread of the pandemic across age groups. The third national serosurvey have reported similar trends among children and adolescents, with no significant difference found across the age groups5. Seroprevalence was higher among those with multimorbidity (79.65%, 95% CI: 72.85-85.40%) as compared to single chronic disease (68.38%, 95% CI: 59.86-76.08%) or no chronic diseases (73.07%, 95% CI:71.30-74.78%). Serological prevalence or presence of COVID-19-specific antibodies across the districts was between 69 and 76 per cent respectively, as shown in Figure 2. The seroprevalence was higher as compared to two tribal-dominated districts, Koraput (32.6%) and Rayagada (37.3%), reported in the fourth round of the national serosurvey7; however, the study participants enrolled in the present study exclusively belonged to the tribal community. Furthermore, the national serosurvey did not present disaggregated data on tribal groups7.

- Seroprevalence and vaccination coverage among the tribal population across districts.
Among the participants, 41.93 per cent had received at least one dose of any COVID-19 vaccine. Only 6.17 per cent of participants were hesitant about accepting the COVID-19 vaccines. The relative isolation of habitat and unique sociobehavioural characteristics necessitates a specific effort to generate evidence on the extent of the COVID-19 pandemic in these groups and identify the challenges related to vaccination coverage. We also found a high seroprevalence in PVTG groups (68%), although this was relatively lower than the other listed STs (74%), it appears that the pandemic did spread significantly among the most isolated groups in mainland India.
The proportion of unimmunized persons in the younger age groups was significantly lower (12.2%) than in the middle (29.8%) and older (29.2%) ages implying a better reach and acceptance in this age. Seroprevalence was higher in fully immunized persons (75.27%), but there was no significant difference between the two groups.
Vaccination coverage across the tribal population was in line with the general population, where around 42 per cent had received at least one dose of any of the COVID-19 vaccines. This is an outcome of the rapid pace of expansion of the world’s largest vaccination programme where 1.19 billion doses were administered along with good acceptance across the diverse groups in the region and will increase further with time2. The common reason for not availing vaccination was the unavailability of vaccination slot (36.19%), unawareness regarding COVID-19 vaccines (35.43%) and lack of knowledge on where vaccines are available (8.20%). History of respiratory illness in the past three months and seroprevalence is provided in the Supplementary Table II.
| Characteristic | Ab against SARS-CoV-2 | Total | ||
|---|---|---|---|---|
| Negative (n) | Positive (n) | Seroprevalence, % (95% CI) | ||
| Prior COVID-19 test results | ||||
| Negative | 95 | 281 | 74.73 (70.02-79.04) | 376 |
| Positive | 4 | 53 | 92.98 (83.10-98.05) | 57 |
| History of symptoms | ||||
| No | 664 | 1750 | 72.49 (70.66-74.27 | 2414 |
| Yes | 100 | 341 | 77.32 (73.13-81.15) | 441 |
| Types of symptoms | ||||
| Cough | 64 | 271 | 80.90 (76.27-84.96) | 335 |
| Runny nose | 52 | 205 | 79.77 (74.33-84.50) | 257 |
| Difficulty in breathing | 12 | 59 | 83.10 (72.34-90.95) | 71 |
| Diarrhoea | 8 | 21 | 72.41 (72.34-87.27) | 29 |
| Myalgia | 26 | 115 | 81.56 (74.16-87.59) | 141 |
| Headache | 0 | 0 | 0 | 0 |
| Sore throat | 12 | 39 | 76.47 (62.51-87.21) | 51 |
| Loss of taste | 0 | 20 | 100.00 | 20 |
| Hospitalization | ||||
| Yes | 0 | 4 | 100 | 4 |
| No | 4 | 49 | 92.45 (81.79-97.90) | 53 |
Ab, antibodies; CI, confidence interval
The vaccination coverage among the PVTGs was higher than the other tribes, with over 89 per cent having received at least a single dose of the COVID-19 vaccine. This implies excellent reach of the region’s vaccination programme and little to no vaccine hesitancy in the PVTGs.
It is encouraging to note that we found minimal levels of vaccine hesitancy (6%) among the tribal communities of Odisha. This is in contrast to the higher levels of vaccine hesitancy seen in other parts of the world24. The major causes of not receiving the vaccine to date were supply-side bottlenecks and lack of knowledge on the availability of such vaccines. Due to their genetic makeup, the severity of COVID-19 was not much among them and was well managed with limited healthcare.
The study draws its strength from the large sample size and robust sampling design that improves the generalizability of the results to the target population. However, this survey study had one major limitation. As the study was conducted during an expanding vaccination drive, it was not possible to differentiate whether the presence of antibodies against SARS-CoV-2 was due to prior natural infection or vaccination. An additional IgG estimation against the spike (S) protein of SARS-CoV-2 could, however, substantiate this differentiation.
Our findings show a high seroprevalence against SARS-CoV-2 among the tribal population and PVTGs. This is evident across sociodemographic subgroups such as age and gender. The vaccination coverage is at par with the general population, and efforts may be required to address some knowledge gaps to improve coverage during the coming days.
Acknowledgment:
This study was part of a larger research project titled ‘Odisha Tribal Family Health Survey’ in collaboration with ICMR-RMRC, Bhubaneswar, Odisha and was approved by the Ministry of Tribal Affairs, Government of India, during the year 2020-2021. This research project is a collaborative project of Scheduled Castes & Scheduled Tribes Research & Training Institute (SCSTRTI), ST & SC, Minorities and Backward Classes Welfare Department, Govt. of Odisha and ICMR- RMRC, Bhubaneswar, Odisha, India.
Financial support & sponsorship: The study was funded by the Scheduled Castes and Scheduled Tribes Research & Training Institute (SCSTRTI), Bhubaneswar, Odisha, India.
Conflicts of Interest: None.
References
- Coronavirus disease (COVID-19). Available from: https://www.who.int/emergencies/diseases/novel-coronavirus-2019
- Available from: https://mygov.in/covid-19/
- Strategy for COVID-19 vaccination in India:The country with the second highest population and number of cases. NPJ Vaccines. 2021;6:60.
- [Google Scholar]
- National sero-surveillance to monitor the trend of SARS-CoV-2 infection transmission in India:Protocol for community-based surveillance. Indian J Med Res. 2020;151:419-23.
- [Google Scholar]
- SARS-CoV-2 seroprevalence among the general population and healthcare workers in India, December 2020-January 2021. Int J Infect Dis. 2021;108:145-55.
- [Google Scholar]
- SARS-CoV-2 antibody seroprevalence in India, August–September, 2020:findings from the second nationwide household serosurvey. Lancet Glob Health. 2021;9:E257-66.
- [Google Scholar]
- Seroprevalence of IgG antibodies against SARS-CoV-2 among the general population and healthcare workers in India, June-July 2021:A population-based cross-sectional study. PLoS Med. 2021;18:e1003877.
- [Google Scholar]
- Available from: https://www.scstrti.in/index.php/communities/pvtg
- ECLA, Caribbean. The impact of COVID-19 on indigenous peoples in Latin America (Abya Yala): Between invisibility and collective resistance. UN, Santiago: CEPAL; 2021.
- A qualitative exploratory study using one health approach for developing an intervention package for elimination of human anthrax in an endemic district of Odisha, India. Indian J Med Res. 2021;153:394-400.
- [Google Scholar]
- COVID-19 and indigenous peoples. Available from: https://www.un.org/development/desa/indigenouspeoples/covid-19.html
- For Odisha tribals, physical distancing has been a way of life. Available from: https://www.thehindu.com/news/national/for-odisha-tribals-physical-distancing-has-been-a-way-of-life/article33359011.ece
- National sero-surveillance to monitor the trend of SARS-CoV-2 infection transmission in India:Protocol for community-based surveillance. Indian J Med Res. 2020;151:419-23.
- [Google Scholar]
- Steps in applying probability proportional to size (PPS) and calculating basic probability weights. Available from: https://www.studocu.com/in/document/university-of-calicut/bcom/psws-probability-prop-size-bierrenbach/21290600
- (Very) basic steps to weight a survey sample. Available from: https://bookdown.org/jespasareig/Book_How_to_weight_a_survey/introduction.htht#basic_steps
- [Google Scholar]
- Available from: https://www.r-project.org/
- Prevalence of SARS-CoV-2 infection in India:Findings from the National Serosurvey, May-June 2020. Indian J Med Res. 2020;152:48-60.
- [Google Scholar]
- The seroprevalence and trends of SARS-CoV-2 in Delhi, India:A repeated population-based seroepidemiological study. medRxiv 2020 Doi:10.1101/2020.12.13.20248123
- [Google Scholar]
- Seroprevalence of SARS-CoV-2 in slums and non-slums of Mumbai, India, during June 29-July 19, 2020. medRxiv 2020 Doi:10.1101/2020.08.27.20182741
- [Google Scholar]
- Seroprevalence of SARS-CoV-2 in Bhubaneswar, India:Findings from three rounds of community surveys. Epidemiol Infect. 2021;149:e139.
- [Google Scholar]
Supplementary Annexure
Step-1. Construction of Base/Design Weights
Basic formula:
Design weight= 1/(Probability of selection)
This should reflect at each stage of sampling.
Also,
Overall probability of selection= product of individual probabilities of selection at each stage.
This survey follows a 3-stage sampling design in sequence as given below:
1. Selection of clusters within each district by probability proportionate to size
2. Households (HH) within clusters by systematic random sampling
3. Individuals selected within HH by response/lack thereof
A. Probability of selection of clusters (P1)
P1 = nc * vi/D
where,
nc= No. of clusters selected in the district
vi= Total population of cluster (i)
D= Total population of district
B. Probability of selection of HH (P2)
P2 = Si/Hi
where,
Si= Number of HH included in survey from cluster (i)
Hi= Total no. of HH in cluster (i)
C. Probability of selection of individual
P3 = Sij/hij
where,
Sij = Number of persons selected from HH (h) from cluster (i)
hij = Total persons living in HH (h) of cluster (i)
Therefore,
Overall probability of selection of individual (k) within HH (h) from cluster (i), Pijk
Pijk = P1 * P2 * P3
Overall design weight (w) for individual (k)
wk = 1/Pijk
therefore,
The following variables need to be created and/or added to the dataset:
1. Total number of clusters selected from the district
2. Population size of each cluster selected
3. Total population size of district
4. Total HH present in each cluster
5. HH included in survey from each cluster
6. Number of individuals who participated in survey from each HH
7. Total persons in each included HH
Step-2: Adjustments for Age, Gender and Ethnicity
AKA- Adding post-stratification weights
Not necessary for age (as recruitment has been done in predefined strata) and for non-response rates (as sampling has been continued until the target sample size is obtained in order to account for non-response)
A. For Gender
Source of base proportions= Census data from district
Weights for males:
Wmale = Males in district/Total district population/Males in sample from district/total sample from district
Weights for females
Wfemale = Females in district/Total district population/Females in sample from district/Total sample from district
B. For Ethnicity and region
To be done ONLY for the STATE LEVEL aggregations
Source of base proportions= Census data from state
Weights for region (e.g. North):
Wnorth = Population of northern district/Total state population/Samples from northern district/Total sample size
Similarly, calculations for Central and Southern states to be made.
Weights for ethnicity (e.g. ST)
WST = ST population in the state/Total state population/Samples from ST persons/Total sample size
Similarly, calculations for OBC, SC and other castes to be made.
Step-3: Combining of weights
Simple product after separately constructing the weights, Total Weight (WT)
WT = W1 * W2 * W3 ..... Wn
Step-4: Trimming of weights
To be done for each stratum.
Check for range and outliers in the weights.
PRINCIPLE to verify trimming: (Sum of trimmed weights) = (Sum of original weights)
If, (within each district/strata)
wi= Original weight
wUL= Upper limit of weight that has been set
Then,
Trimmed weight (wi(T)) is calculated conditionally as:
If wi < wUL, then wi(T) = wi
If wi ≥ wUL, then wi(T) = wUL
Verification of principle by fraction method:
FT = Total of Original weights/Total of trimmed weights
Adjustment necessary further to arrive at a final adjusted trimmed weight (wi(TT))
If, wi(T) < wUL, then wi(TT) = wi(T) * FT
Check if re-calculated FT=1


