Translate this page into:
Role of leptin on the expression of low density lipoprotein receptor
Reprint requests: Dr N.C. Chandra, Department of Biochemistry, All India Institute of Medical Sciences Patna 801505, India e-mail: chandra_nc1@rediffmail.com
* Present address: Department of Biochemistry, All India Institute of Medical Sciences, Patna 801 505, India
-
Received: ,
This is an open-access article distributed under the terms of the Creative Commons Attribution-Noncommercial-Share Alike 3.0 Unported, which permits unrestricted use, distribution, and reproduction in any medium, provided the original work is properly cited.
This article was originally published by Medknow Publications & Media Pvt Ltd and was migrated to Scientific Scholar after the change of Publisher.
Abstract
Background & objectives:
Leptin resistance oriented hyperleptinaemia is a common problem in obese subjects in association with hypercholesterolaemia. The most common target for hypercholesterolaemia is impaired low density lipoprotein receptor (LDLR). This study was carried out to investigate whether any alteration in LDLR expression could explain the occurrence of hypercholesterolaemia in the event of hyperleptinaemia.
Methods:
Expression of LDLR and SREBP2 (sterol regulatory element binding protein 2) were examined in HepG2 cells by RT-PCR and Western blotting. JAK2 inhibitor II was used to verify the effect of JAK-STAT (Janus Kinase-Signal Transducer and Activator of Transcription) pathway (common mediator for cytokine signaling). Co-localization of LDLR and insulin receptor (IR) was examined by confocal microscopy.
Results:
Leptin was found to reduce the expression of LDLR and its transcription factor SREBP2. On the other hand, a weak signal for stimulation of LDLR by leptin was noted to be mediated by JAK2 pathway. But the joint effect of the two signaling pathways kept LDLR only in depressed mode in presence of leptin. Confocal microscopy showed that LDLR made an intensively co-localized complex with insulin receptor in presence of leptin.
Interpretation & conclusions:
Our results show that though leptin stimulates LDLR expression very weakly through JAK-STAT signaling pathway, it mainly imposes inhibition on LDLR expression by inhibiting transcription factor SREBP2. The inter-association between LDLR and IR may be a reason to render LDLR functionally inactive in presence of leptin.
Keywords
Hypercholesterolemia
insulin receptor
JAK-STAT
leptin-LDL receptor
SREBP2

Leptin (from Greek ‘leptos’ means thin), a 16-kDa protein hormone, is a product of obese gene1. It is produced primarily by white adipose tissue and also by tissues like gut, placenta, liver and kidney. Leptin is secreted into bloodstream and typically circulated in proportion to body fat mass2 in free and bound form. Leptin resistance in humans is reported to be one of the causes of obesity. Besides obesity, persisting hyperleptinemia due to leptin resistance are also found to be potentially involved in stimulating other atherogenic effectors, such as induction of endothelial dysfunction, stimulation of inflammatory mediators, oxidative stress, decrease in paraoxonase activity, platelet-aggregation/migration and proliferation of vascular smooth muscle cells3. The relation between serum concentration of leptin and serum lipids (lipoproteins) is not yet clear.
Leptin crosses the blood-brain barrier and mediates its actions through the long form of the leptin receptor (OB-Rb), which is linked to the downstream JAK-STAT (Janus Kinase Signal Transducer and Activator of Transcription) signaling system for its activity4. Interacting with its receptor in brain, leptin modulates food intake and associated insulin action56 and signaling pathways7. Leptin treatment of adipocytes reduces insulin stimulation of carbohydrate and lipid metabolism as well as protein synthesis. Reports have shown that mutations in leptin and leptin receptor gene lead to severe obesity8910. With the exception of the ob/ob mouse11 and two children from one family of Pakistani origin9 all models of rodent and human obesity studied, were characterized by hyper-leptinaemia12 due to leptin resistance.
Obesity induces diabetes (insulin resistance) and hypercholesterolaemia13. The most obvious reason for hypercholesterolaemia is either having an inactive or under-expressed low-density lipoprotein receptor (LDLR). Impairment of the LDLR activity leads to the accumulation of LDL particles in the circulation leading to the development of atherosclerosis, a well documented phenomenon even in non-obese subjects. Though atherosclerosis is a long known phenomenon which gets precipitated in association with type-2 diabetes mellitus, it is also emerging as a major event in leptin resistance. The existing studies on the role of leptin in the modulation of metabolic fluxes, particularly those which are involved in developing atherosclerosis are still very young and are debatable issues.
The impaired insulin receptor in type-2 diabetes blocks the signal from extracellular insulin across the plasma membrane. Insulin has previously been found to be a transcriptional regulator of LDLR1415. We have earlier shown an inter-association between insulin receptor (IR) and LDL receptor (LRLR) showing IR dependent regulation of LDLR activity16. The known mechanism for regulating transcription of LDLR is a function of the cytosolic cholesterol pool and the abundance of activated transcription factor sterol regulatory element binding protein-2 (SREBP2)17 in cell nucleus. Reduced cell surface LDLR expression slows down the rate of clearance of LDL from circulation18. The deposition of LDL in blood vessels potentiates plaque formation and in the long run precipitates atherosclerosis. It is also not known whether SREBP2 mediated feedback regulation is the only way to control LDLR expression.
Since hypercholesterolemia and hyperleptinemia are two side effects found to be associated with the development of human obesity, the primary objective of the study was to see the effects of leptin on LDLR and SREBP2 and to explore whether there are other possible signaling mechanisms to modulate the expression of LDL receptor.
Material & Methods
This study was conducted in the Department of Biochemistry, All India Institute of Medical Sciences, New Delhi, India.
Nitrocellulose membrane was purchased from Genotech Incorporation, CA, USA. Secondary antibodies with HRP (Horse radish Peroxidase) conjugates were from Bangalore Genei, Bangalore India. Enhanced Chemi Luminescence reagent, primary and secondary antibodies conjugated to either FITC or PE were obtained from Santacruz Biotechnologies, CA, USA.
Cell culture and lysate preparation: HepG2 cells were grown to 70 per cent confluence on 100 mm petriplates in DMEM supplemented with 10 per cent FBS (foetal bovine serum) and antibiotic/antimycotic (penicillin, streptomycin and amphotericin-B) and maintained at 37°C in 5 per cent CO2 environment. The cells were harvested in trypsin-EDTA solution, centrifuged and the pellets were lysed in lysis buffer [50mM Tris-HCl (pH=7.4), 300mM NaCl, 0.5 per cent (v/v) Triton X-100, 5mM EDTA, 2mM PMSF (phenylmethylsulfonyl fluoride), 10mg/ml leupeptin and 10U/ml aprotinin]. The supernatant was collected and the protein content was determined by the Bradford method19.
Leptin treatment: Leptin was purchased from Sigma, USA. HepG2 cells were serum starved for 3h. Different concentrations of leptin (0, 0.1, 0.5, and 1.0nM) were added in the cell culture medium and the cells were incubated at 37°C for 30 min. Though the elevated serum leptin level in human obesity was found around 1 ± 0.2 nM, we used leptin in the cell culture medium of our in vitro study to a maximum concentration of 1nM20. Lysate was prepared and 60 - 80μg protein was run on SDS-PAGE. Western blotting was performed with specific antibodies to detect the expression of LDLR and SREBP2.
SDS-PAGE and Western blotting: SDS-PAGE and western blotting were carried out as described by us earlier16. Briefly, the protein samples were denatured with loading buffer (containing 1% SDS, 5% β-mercaptoethanol) and resolved in a 10 per cent SDS - PAGE. The proteins were then transferred on to a nitrocellulose sheet (35 V for 12 h at 4°C). The sheet was incubated in blocking buffer (5% Blot-Quick blocking power in 0.01 M PBS containing 0.05% Tween-20) for 2 h at room temperature on rocker platform. Anti-LDLR goat polyclonal, anti-SREBP2 mouse monoclonal, anti-β actin mouse monoclonal antibodies (Santacruz Biotechnology, CA, USA) diluted in 0.01 M PBS (pH 7.4)-Tween-20 (0.1%) were added at 1: 3000, 1: 500 and 1:2000 dilutions respectively and the membrane was incubated at room temperature for 2 h. The membrane was then washed thrice in 0.01 M PBS-0.1% Tween-20 and incubated with anti-goat HRP conjugate (1: 10,000) or anti-mouse HRP conjugate (1:3000) for 2h at room temperature. This was followed by three washes in PBS-Tween buffer. The blots were then developed by ECL (electrochemiluminiscence) in the dark and the bands were captured on X-ray films. The expression was determined densitometrically and represented as percentage integrated density value (%IDV) using Alpha-Innotech gel documentation system (USE) normalized against respective β-actin values.
Inhibition of JAK-STAT signaling by Jak2 inhibitor II: Jak2 inhibitor II was purchased from Calbiochem, San Diego California, USA. HepG2 cells were grown as described previously and incubated with JAK2 inhibitor II in varying concentrations (0, 50, 100, 250, 500 and 1000 nM) for 8 h at 37°C. In the absence of the inhibitor (0 nM JAK II inhibitor), equal concentrations of the DMSO, the solvent in which the inhibitor was dissolved was added. Based on the LDLR expression at these concentrations by western blotting, three concentrations (250, 500 and 1000 nM) of JAK2 inhibitor II were chosen to study the effect of leptin on LDLR expression. Leptin (0, 0.5 and 1.0 nM final concentrations in the medium) was added after 8 h of JAK2 inhibitor II treatment and incubated at 37°C for 30 min. Cell lysate was prepared and Western blotting was performed to see the expression of LDLR as before16.
Reverse transcriptase PCR: RNA was reverse-transcribed using High capacity cDNA reverse transcriptase kit (Applied Biosystems Inc., USA) starting from 1μg RNA as per the manufacturer's instructions. The cDNA (complementary DNA) hence obtained was amplified using specific primers for LDL receptor viz. forward: 5’-AAG GAC ACA GCA CAC AAC CA– 3’ and reverse: 5’-CAA AGG AAG ACG AGG AGC AC-3’ and for 18SrRNA (internal control) viz. forward: 5’-GTA ACC CGT TGA ACC CCA TT -3’ and reverse: 5’-CCA TCC AAT CGG TAG TAG CG -3’ (primers were procured from Fermentas, India). 250 ng of cDNA was used at a final volume of 20μl for amplification with each primer with an annealing temperature of 60.4◦ C for LDLR and 59◦ C for 18SrRNA respectively for 35 cycles each (PCR conditions used: 1.2mM MgCl2, 1× PCR buffer with NH4SO4, 0.25mM dNTP mix, 0.25 units of Taq polymerase and nuclease-free water). The mean expression of the LDLR transcript was determined densitometrically and the values represented as percentage integrated density values (%IDV) normalized against respective 18SrRNA values.
Confocal microscopy: HepG2 cells were seeded on 12mm cover glasses taken in a 6 well culture plate with 5 × 10⁵ cells per well and were cultured till these attained 70 - 80 per cent confluence. Following serum starvation for 3 h, leptin (0 and 1.0 nM concentration) was added to the medium and incubated for 30 min. The cells were washed twice with ice cold 0.01 M PBS and fixed in absolute acetone at 4°C for 10 min. Blocking was carried out in 1 per cent BSA at room temperature for 1 h. The cells were then washed thrice with PBST and incubated with anti-LDLR goat polyclonal antibody (1: 25 dilution) and incubated overnight at 4°C in a humid chamber. The cells were labelled with the secondary antibody [anti goat PE conjugate (red)] at 1: 50 dilution in the dark. After washing, primary anti-insulin receptor β chain rabbit polyclonal antibody and secondary anti-rabbit FITC conjugate (green) antibody-labelling steps for the IR (insulin receptor) were repeated. The cover glasses were mounted in glycerol - PBS (1:1 v/v) and stored in the dark at -20° C. The images were captured on a Nikon Laser scanning confocal microscope; Model Ti-E with NIS-elements software, Japan.
Statistical analysis: The results were expressed as mean ± SD of three experimental repeats. All expression data have been normalized against the respective internal control. Statistical analysis was carried out using One-way Analysis of variance followed by Dunnett's multiple comparison.
Results
Expression of LDLR and SREBP2 by leptin: The inhibition of LDLR expression induced by 0.1 nM leptin remained more or less the same up to a concentration of 1nM leptin in the medium (Fig. 1A). When the mRNA level was compared against the protein expression of LDLR, it was apparent that the maximum inhibition of LDLR protein expression was only attained at 0.1 nM leptin concentration; although mRNA level was continually decreased with increasing concentrations of leptin (Fig. 1B). This indirectly suggested the plausibility of either instability of the mRNA or some limits on post-transcriptional modification to keep the protein expression constant from 0.1 to 1.0 nM leptin concentration. The expression of the transcription factor (SREBP2) was also found to be continuously decreased with increasing concentrations of leptin from 0.1 to 1.0 nM (Fig. 1C).
![A. Expression of LDL receptor (LDLR) protein in HepG2 cells with increasing concentration of leptin. The figure shows LDLR protein expression by western blotting. Leptin showed inhibition of LDL receptor expression. Each bar in the graph represents mean ± SD [(% Integrated density value (IDV) normalized against respective β-actin expression]; n=3; statistical analysis was carried out by one-way ANOVA followed by Dunnette's multiple comparison; **P<0.01. B. Expression of LDL receptor mRNA in HepG2 cells with increasing concentration of leptin. The figure depicts the LDLR transcript expression by semi-quantitative RT-PCR. LDLR mRNA was inhibited in a dose dependent manner with increasing leptin concentration. Data represented as mean ± SD (%IDV normalized against respective β-actin expression); n=3; statistical analysis was carried out by one-way ANOVA followed by Dunnette's multiple comparison; **P<0.01. C. Expression of SREBP2 in HepG2 cells with various concentration of leptin in the culture medium. The figure represents the expression of SREBP2 by Western blotting. Leptin inhibited the expression of SREBP2. Each bar in the graph represents mean ± SD (%IDV normalized against respective β-actin expression); n=3; statistical analysis was carried out by one-way ANOVA followed by Dunnette's multiple comparison; **P<0.01.](/content/175/2014/140/4/img/IJMR-140-524-g001.png)
-
A. Expression of LDL receptor (LDLR) protein in HepG2 cells with increasing concentration of leptin. The figure shows LDLR protein expression by western blotting. Leptin showed inhibition of LDL receptor expression. Each bar in the graph represents mean ± SD [(% Integrated density value (IDV) normalized against respective β-actin expression]; n=3; statistical analysis was carried out by one-way ANOVA followed by Dunnette's multiple comparison; **P<0.01. B. Expression of LDL receptor mRNA in HepG2 cells with increasing concentration of leptin. The figure depicts the LDLR transcript expression by semi-quantitative RT-PCR. LDLR mRNA was inhibited in a dose dependent manner with increasing leptin concentration. Data represented as mean ± SD (%IDV normalized against respective β-actin expression); n=3; statistical analysis was carried out by one-way ANOVA followed by Dunnette's multiple comparison; **P<0.01. C. Expression of SREBP2 in HepG2 cells with various concentration of leptin in the culture medium. The figure represents the expression of SREBP2 by Western blotting. Leptin inhibited the expression of SREBP2. Each bar in the graph represents mean ± SD (%IDV normalized against respective β-actin expression); n=3; statistical analysis was carried out by one-way ANOVA followed by Dunnette's multiple comparison; **P<0.01.
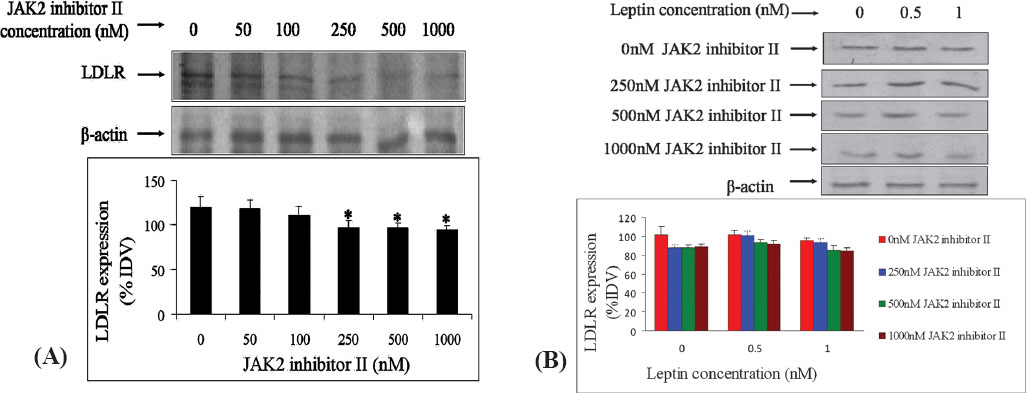
Effect of JAK2 inhibitor II on the expression of LDLR by leptin: It was found that JAK2 inhibitor II inhibited the expression of LDLR in a dose dependent manner (0, 50, 100, 250, 500 and 1000 nM) with a significant inhibition at higher concentrations (Fig. 2A). β-actin was used as internal control. This showed that JAK-STAT pathway was involved in mediating the signal for LDL expression. We found that leptin had an inhibitory effect on the expression of LDLR (Fig. 1). But treatment of HepG2 cells with different concentrations of an inhibitor of JAK-STAT pathway, alone and in presence of different concentrations of leptin, demonstrated a competitive role of leptin with JAK-STAT inhibitor on LDLR expression through JAK-STAT pathway (Fig. 2B). But without any inhibitor leptin had an inhibitory effect on LDLR expression (Fig. 2B). This demonstrated a dominance of the SREBP2 mediated regulation of LDLR over JAK-STAT pathway. Therefore, it was apparent from the above study that besides SREBP2 mediated regulation of LDLR, cytokine-like leptin can regulate the LDLR expression by sending signals through JAK-STAT pathway.
-
(A) Expression of LDL receptor (LDLR) in HepG2 cells in the presence of different concentrations (0 to 1000 nM) of JAK2 inhibitor II. LDLR expression was detected by western blotting in presence of varying concentrations of JAK2 inhibitor II. Each bar in the graph represents mean ± SD (%IDV normalized against respective β-actin expression); n=3. (B) Expression of LDL receptor by HepG2 cells in the presence of various leptin concentrations with 0, 250, 500 and 1000 nM JAK2 inhibitor-ll. Using three concentrations (250, 500 and 1000 nM) of the JAK2 inhibitor II from Figure 2A, their effects on modulation of LDLR expression was detected by Western blotting.
Confocal microscopy: Confocal microscopy with specific fluorescent tagged antibodies of these two receptors showed that the co-localized association (yellow fluorescence) of the two receptors was enhanced in presence of leptin (Fig. 3). Hence the functionality of LDLR may be abolished by the inaccessibility of LDL to the binding site of LDLR in the bound state with IR.
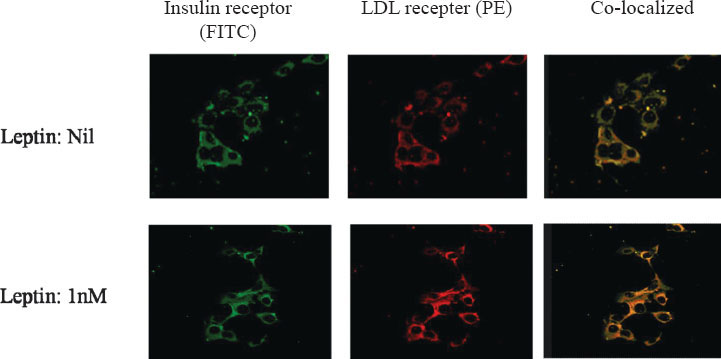
- Confocal microscopy showing effect of leptin on co-localization of LDL receptor and insulin receptor. Insulin receptor was stained with FITC (Fluorescein sothiocyanate; green) and LDL receptor was stained with PE (Phycoerythrin; red). The co-localization of the two receptors (green and red) was observed as yellow colour. The density of yellow colour was increased with 1nM leptin. This showed increased co-localization with leptin.
Discussion
Leptin crosses the blood-brain barrier (BBB) and mediates its action through the long form of the leptin receptor (OB-Rb), which is linked to the downstream JAK-STAT signaling system for its activity21. Interacting with its receptor in brain, leptin nurtures its inhibitory role on associated insulin stimulated metabolic pathways6, besides its effects on food intake and energy metabolism. Treatment of adipocytes with leptin reduces insulin stimulation of carbohydrate and lipid metabolism as well as insulin stimulation of protein synthesis. Mutations in the leptin and leptin receptor gene have been shown to cause severe obesity and leptin resistance221. Both human and animal obesity has been characterized by hyperleptinaemia91011 which is a contributing evidence for leptin resistance, obesity induced diabetes (insulin resistance) and hypercholesterolaemia12.
This study in HepG2 cell culture system has found leptin as a repressor of LDL receptor expression at 0.1 to 1.0 nM concentration. In earlier studies, LDL-receptor expression was found to be regulated by the feedback regulation of endoplasmic reticulum based transcription factor SREBP217. In the present study leptin has been found to act as a repressor of SREBP2 expression in HepG2 cells. Since SREBP2 is a transcription factor of LDLR, the repressed expression of LDLR was in turn due to the repressed expression of SREBP2 in the presence of leptin. Hence, the reduced expression of LDLR in presence of abundant leptin concentrations, a situation of leptinaemia or leptin resistance, was mediated through the SREBP2 mediated feedback mechanism in the regulation of LDLR transcription and its expression on the surface membrane of cells. Earlier studies have reported the relationship between leptin receptor (acting via its hypothalamic receptor (OB-Rb)) and JAK-STAT pathway222324 for the induction of downstream intracellular signaling. In our study, we found that JAK2 inhibitor II inhibited LDLR expression. Thus the effect of this inhibitor showed that the leptin-induced modulation of LDLR expression also worked through the JAK-STAT pathway. A competitive role of leptin with JAK-STAT inhibitor has become apparent on LDLR expression through JAK-STAT pathway. But the inhibition of SREBP2 expression got the priority for net inhibitory role of leptin to keep LDLR in repressed mode.
Available literature provides evidence that leptin resistance (higher serum level of leptin) is a cause of developing hypercholesterolaemia, atherosclerosis and related cardiovascular disease2526. Existence of functionally impaired LDL receptors has been reported earlier27 with hypercholesterolaemia associated type-2 diabetes mellitus. Studies from our laboratory have demonstrated the existence of a co-localized association of IR (insulin receptor) and LDLR (LDL receptor) on the plasma membrane of biological cells1628. This association was found to lock the two receptors in a way, so as to inactivate their functional activity.
This study showed a decreased expression of LDLR by leptin. In addition, the probability of having an inactive LDLR became more apparent from the chances of existence of the co-localized LDLR-IR complex in presence of leptin. This kind of co-localized co-adherence prevents the availability of free functional LDLR from extracellular LDL clearance.
The two receptors, LDLR and IR, were found to remain co-localized by confocal microscopy. Previous studies claimed that obesity and type-2 diabetes facilitated leptin resistence25. Non-functionality of insulin receptor was found to be one of the reasons for developing diabetes29. Hypercholesterolaemia was documented as a consequence of either type-2 diabetes or leptin resistance. In the experiment on the co-localization of LDLR and IR with 1.0 nM leptin by confocal microscopy, more intense yellow colour was observed than without leptin in the medium, depicting an enhanced co-localization of the two receptors. This showed that leptin promoted LDLRs and IRs to remain in contact or in a more rigid co-localized state. As a result, LDLRs were not free to execute its normal activity. On the contrary, IR receptors also became non-functional because of their coherence with LDLRs in the co-localized state. We feel that stearic hindrance may play a critical role to obstruct insulin and LDL from their binding to their cognate receptors. As a result, inability of IRs to relay the message from their ligand, insulin, may induce the probability of insulin resistance and consequently, inactivity of LDLR to clear extracellular LDL, which in turn may instill the tendency of developing hypercholesterolaemia.
In conclusion, our study showed that leptin played a dual role. It repressed LDLR expression and at the same time it kept LDLR and IR inactive in a complex co-localized state. More leptin concentration (found in leptin resistance) may increase the strength of such association to a great extent. This may contribute to the development of hypercholesterolaemia with insulin resistance in a situation of leptin resistance by hindering the access of insulin and LDL to their cognitive receptors.
Acknowledgment
The authors are thankful to the Department of Physiology, AIIMS, New Delhi for providing access to the confocal microscope facility.
References
- Positional cloning of the mouse obese gene and its human homologue. Nature. 1994;372:425-32.
- [Google Scholar]
- Quercetin suppresses inflammation by reducing ERK1/2 phosphorylation and NF kappa B activation in Leptin-induced Human Umbilical Vein Endothelial Cells (HUVECs) BMC Res Notes. 2013;6:275.
- [Google Scholar]
- Identification of the critical sequence elements in the cytoplasmic domain of leptin receptor isoforms required for Janus kinase/signal transducer and activator of transcription activation by receptor heterodimers. Mol Endocrinol. 2002;16:859-72.
- [Google Scholar]
- Leptin signaling in the central nervous system and the periphery. Recent Prog Horm Res. 2004;59:305-31.
- [Google Scholar]
- Differential regulation of leptin transport by the choroids plexus and blood-brain barrier and high affinity transport systems for entry into hypothalamus and across the blood-cerebrospinal fluid barrier. Endocrinology. 2000;141:1434-41.
- [Google Scholar]
- Evidence that the diabetes gene encodes the leptin receptor: identification of a mutation in the leptin receptor gene in db/db mice. Cell. 1996;84:491-5.
- [Google Scholar]
- Congenital leptin deficiency is associated with severe early-onset obesity in humans. Nature. 1997;387:903-8.
- [Google Scholar]
- A mutation in the human leptin receptor gene causes obesity and pituitary dysfunction. Nature. 1998;392:398-401.
- [Google Scholar]
- Diabetes and Insulin in regulation of brain cholesterol metabolism. Cell Metab. 2010;12:567-79.
- [Google Scholar]
- Estradiol regulates insulin dependent stimulation of LDL-receptor expression in HepG2 cells. Indian J Clin Biochem. 2006;21:8-14.
- [Google Scholar]
- Regulation of low-density-lipoprotein-receptor mRNA by insulin in human hepatoma HepG2 cells. Eur J Biochem. 1989;181:727-31.
- [Google Scholar]
- The association between insulin and low density lipoprotein receptors. Diab Vasc Dis Res. 2012;9:196-4.
- [Google Scholar]
- SREBP transcription factors: master regulators of lipid homeostasis. Biochemie. 2004;86:839-48.
- [Google Scholar]
- The low density lipoprotein pathway and its relation to atherosclerosis. Ann Rev Biochem. 1979;46:897-930.
- [Google Scholar]
- A rapid and sensitive method for the quantitation of microgram quantities of protein using the principle of protein dye binding. Anal Biochem. 1976;72:248-54.
- [Google Scholar]
- Leptin in the general population, differences in sex hormones, blood lipids, gender and life style characteristics. The Open Behav Sci J. 2011;5:8-15.
- [Google Scholar]
- New leptin receptor mutations in mice: Lepr(db-rtnd), Lepr(db-dmpg) and Lepr(db-rlpy) J Nutr. 2003;133:1265-71.
- [Google Scholar]
- Leptin activation of Stat3 in the hypothalamus of wild-type and ob/ob mice but not db/db mice. Nat Genet. 1996;14:95-7.
- [Google Scholar]
- The leptin receptor activates janus kinase 2 and signals for proliferation in a factor-dependent cell line. Mol Endocrinol. 1997;11:393-9.
- [Google Scholar]
- Leptin resistance: A possible interface of inflammation and metabolism in obesity-related cardiovascular disease. J Am Coll Cardiol. 2008;52:1201-10.
- [Google Scholar]
- Severe hypercholesterolemia, hypertriglyceridemia, and atherosclerosis in mice lacking both leptin and the low density lipoprotein receptor. J Biol Chem. 2001;276:37402-8.
- [Google Scholar]
- Cell surface expression of LDL receptor is decreased in type-2 diabetic patients and is normalized by insulin therapy. Diab Care. 2003;26:1540-4.
- [Google Scholar]
- Modulation by insulin of the co-localized LDL receptor in normal and type-I diabetic subjects. Int J Clin Med. 2011;2:231-45.
- [Google Scholar]
- Chapter-28, Joslin's diabetes mellitus. (14th ed). Lippincott Williams & Wilkins; 2005.
- [Google Scholar]


