
Translate this page into:
Risk factors for clinically significant diffuse parenchymal lung abnormalities persisting after severe COVID-19 pneumonia
For correspondence: Dr Sahajal Dhooria, Department of Pulmonary Medicine, Postgraduate Institute of Medical Education & Research, Chandigarh 160 012, India e-mail: sahajal@gmail.com
-
Received: ,
This article was originally published by Wolters Kluwer - Medknow and was migrated to Scientific Scholar after the change of Publisher.
Abstract
Background & objectives:
The risk factors for clinically significant diffuse parenchymal lung abnormalities (CS-DPLA) persisting after severe coronavirus disease 2019 (COVID-19) pneumonia remain unclear. The present study was conducted to assess whether COVID-19 severity and other parameters are associated with CS-DPLA.
Methods:
The study participants included patients who recovered after acute severe COVID-19 and presented with CS-DPLA at two or six month follow up and control group (without CS-DPLA). Adults volunteers without any acute illness, chronic respiratory illness and without a history of severe COVID-19 were included as healthy controls for the biomarker study. The CS-DPLA was identified as a multidimensional entity involving clinical, radiological and physiological pulmonary abnormalities. The primary exposure was the neutrophil-lymphocyte ratio (NLR). Recorded confounders included age, sex, peak lactate dehydrogenase (LDH), advanced respiratory support (ARS), length of hospital stay (LOS) and others; associations were analyzed using logistic regression. The baseline serum levels of surfactant protein D, cancer antigen 15-3 and transforming growth factor-β (TGF-β) were also compared among cases, controls and healthy volunteers.
Results:
We identified 91/160 (56.9%) and 42/144 (29.2%) participants with CS-DPLA at two and six months, respectively. Univariate analyses revealed associations of NLR, peak LDH, ARS and LOS with CS-DPLA at two months and of NLR and LOS at six months. The NLR was not independently associated with CS-DPLA at either visit. Only LOS independently predicted CS-DPLA at two months [adjusted odds ratios (aOR) (95% confidence interval [CI]), 1.16 (1.07-1.25); P<0.001] and six months [aOR (95% CI) and 1.07 (1.01-1.12); P=0.01]. Participants with CS-DPLA at six months had higher baseline serum TGF-β levels than healthy volunteers.
Interpretation and conclusions:
Longer hospital stay was observed to be the only independent predictor of CS-DPLA six months after severe COVID-19. Serum TGF-β should be evaluated further as a biomarker.
Keywords
Biomarker
interstitial lung abnormalities
interstitial lung disease
long COVID-2019
lung fibrosis
sequelae

Several patients have persistent respiratory symptoms, reduced lung function and imaging abnormalities after coronavirus disease 2019 (COVID-19) pneumonia1-3. At six months, the reported prevalence of these abnormalities has variably ranged between 20 and 100 per cent4-9. Age, severity of hypoxemia and overall critical illness, co-morbidities and others have been found to be independent risk factors for prolonged mechanical ventilation in patients with COVID-1910. Age, peak C-reactive protein (CRP), the severity of hypoxemia at admission, mechanical ventilation and the length of hospital stay (LOS) have been associated with residual imaging abnormalities4,7,9,11,12. As these radiologic sequelae may be clinically insignificant, their relevance has been questioned13,14.
The true prevalence and predictors of ‘clinically significant’ lung abnormalities after COVID-19 pneumonia remain uncertain. In this study, we defined clinically significant diffuse parenchymal lung abnormalities (CS-DPLA) after severe COVID-19 pneumonia using a multidimensional model. We report the prevalence of CS-DPLA at two and six months after discharge and analyze the factors associated with CS-DPLA. Our primary objective was to assess whether the severity of acute COVID-19, defined by the neutrophil-lymphocyte ratio (NLR), a known surrogate marker of severity, was associated with CS-DPLA. Furthermore, it was explored whether the serum levels of biomarkers previously used in interstitial lung disease, namely surfactant protein D (SP-D), cancer antigen 15-3 (CA 15-3)/mucin 1 and transforming growth factor-β (TGF-β) would differ between participants with or without CS-DPLA.
Material & Methods
Study design & setting: This study was conducted at the department of Pulmonary Medicine, Postgraduate Institute of Medical Education & Research, Chandigarh, between January 2021 and February 2022. The Institutional Ethics Committee approved the study protocol (NK/6845/MD/785). A written informed consent was obtained from all the participants.
Participants: The participants were prospectively recruited from a follow up cohort of post-COVID-19 patients. The study included consecutive patients enrolled after recovery from the acute phase of the COVID-19 illness if they satisfied all the following criteria: (i) age ≥18 yr; (ii) diagnosis of COVID-19 by a real-time reverse transcriptase(RT)-PCR for severe acute respiratory syndrome coronavirus 2 (SARS-CoV-2) or a positive rapid antigen assay for SARS-CoV-2; (iii) severe COVID-19 pneumonia requiring hospitalization and supplemental oxygen or advanced respiratory support (ARS); and (iv) provided a written informed consent to participate in the study and the use of their data for research. Participants with pre-existing structural lung disease, pregnant or lactating women were excluded from the study.
The study participants were divided into two groups i.e. cases and controls. Both these groups were designated separately for the follow up visits at two and six months. Cases were defined as participants with CS-DPLA after COVID-19 pneumonia. Clinically significant DPLA was defined as radiologically diffuse involvement of ≥20 per cent of the lung parenchyma with any of the following: (i) dyspnoea severity on the modified Medical Research Council (mMRC) scale ≥2; (ii) resting oxygen saturation <95 per cent; (iii) ≥4 per cent desaturation on exercise testing; or (iv) abnormal spirometry. Controls were defined as participants without CS-DPLA. All study participants presenting at the two month visit and most participants presenting for the six month visit underwent chest computed tomography (CT), which was used to assess the radiological involvement. Participants unwilling for chest CT at six months underwent chest radiography with the subsequent assessment of radiologic severity.
For the biomarker study, the first 80 patients were selected who presented for a follow up visit. Twenty adult volunteers without any acute illness, chronic respiratory illness and without a history of severe COVID-19 were included as healthy controls.
Procedures: The following information was collected: age, sex, history of tobacco smoking, comorbid illness, the blood NLR at hospital admission, the ratio of oxygen saturation to fractional inspired oxygen (SFR) at admission, the worst value of serum lactate dehydrogenase (peak LDH), the worst value of serum C-reactive protein (CRP) during hospitalization (peak CRP), type of respiratory support [routine oxygen supplementation with nasal prongs or mask, oxygen delivery using highflow nasal cannula (HFNC), non-invasive ventilation (NIV) or invasive mechanical ventilation (IMV)], the peak requirement of fractional inspired oxygen (FiO2) during the acute illness and the length of stay (LOS) in the hospital. The following assessments was performed at the baseline (at the time of discharge), two months and six months: clinical history and examination, dyspnoea severity on the mMRC scale (Supplementary Appendix), resting oxygen saturation on pulse oximetry, exercise testing using six-minute walk test (6MWT) or one-minute sit-to-stand test (in participants unable to perform 6MWT) and a thin-section CT of the chest (or chest radiography for unwilling subjects at six months). Spirometry was performed at the follow up visits only. The respiratory condition, dyspnoea severity and vital status of subjects who did not present for follow up were ascertained telephonically.
Volumetric acquisition for the chest CT and reconstructed thin-collimation (1 mm) sections (Supplementary Appendix) were also performed. Two experienced radiologists blinded to the study participants’ clinical and laboratory details independently categorized the extent of parenchymal involvement due to COVID-19 into ≥20 or <20 per cent by visually inspecting both the lung fields on the chest CT images15. Disagreements were resolved by discussion to reach a consensus. They also recorded the presence of ground-glass opacities, consolidation, parenchymal bands, reticulation and traction bronchiectasis (or honeycombing) using standard definitions16 (Fig. 1).
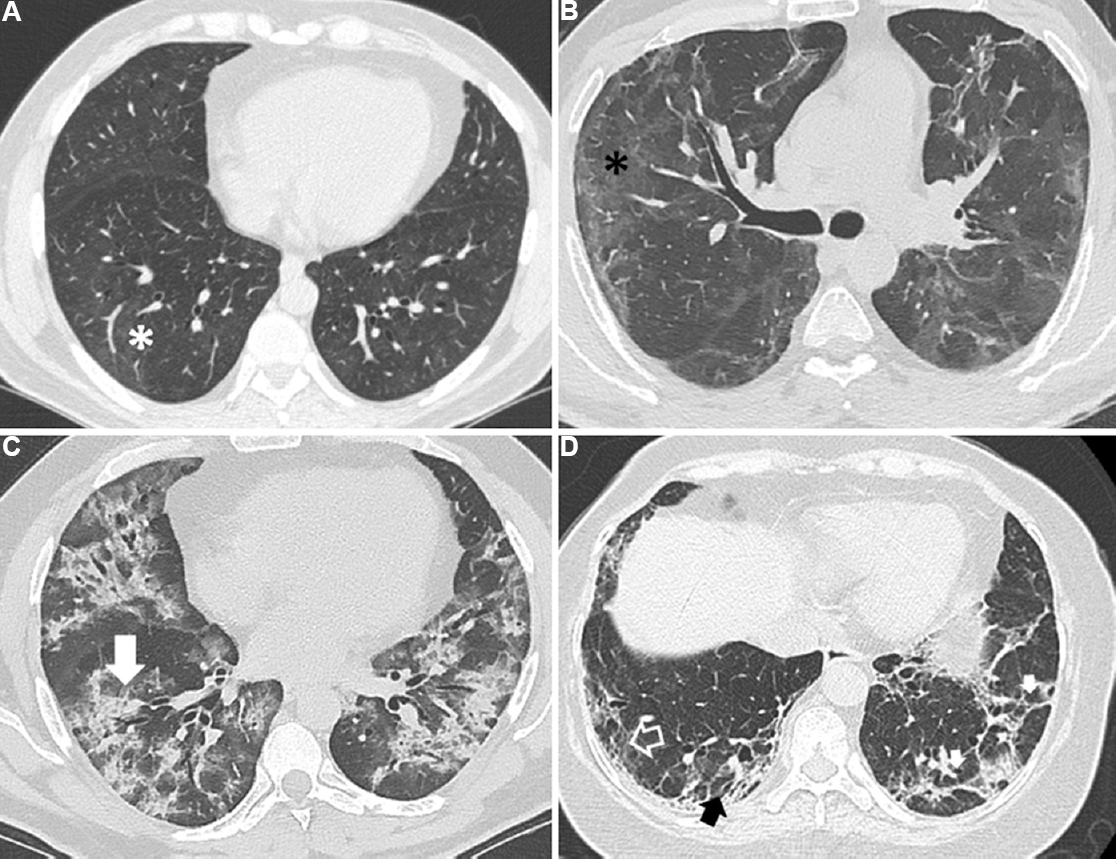
- Representative images of thin-section computed tomography (CT) scans of the chest showing various radiological abnormalities in study participants. (A) Subtle ground glass opacities (asterisk) affecting <20 per cent of the lung parenchyma in a subject without clinically significant diffuse parenchymal lung abnormalities; (B) Ground glass opacities (asterisk) and parenchymal bands affecting ≥20 per cent of lung parenchyma; (C) Chest CT showing predominantly consolidation (arrow) and ground glass opacities; (D) Chest CT showing areas with parenchymal bands (small solid white arrows), reticulation (open arrow) and traction bronchiectasis (black arrow).
The forced vital capacity (FVC), forced expiratory volume in the 1st sec (FEV1) and the FEV1 to FVC ratio was recorded during spirometry17 (Supplementary Appendix). Spirometry was considered abnormal if either the FEV1/FVC ratio (obstructive defect) or FVC [with a normal FEV1/FVC (restrictive defect)] was below the corresponding lower limit of normal for our population18. Further, the 6MWT has performed and the distance walked during the test (6MWD) was recorded (Supplementary Appendix). The nadir oxygen saturation during the test was recorded using finger pulse oximetry. Desaturation was defined as ≥4 per cent fall in oxygen saturation anytime during the test. In subjects unable to perform the 6MWT, exertional oxygen desaturation was assessed during a one-minute sit-to-stand test (Supplementary Appendix). Percentage of the predicted (%pred) values for FVC and 6MWD18-20 were calculated.
Blood samples (5 ml) were collected from the study participants at baseline (at hospital discharge) and the isolated serum was stored at −80°C. The levels of surfactant proteins-D (SP-D), cancinoembryonic antigen (CA) 15-3 and transforming growth factor-beta (TGF)-β using the enzyme-linked immunoassay kits (NOVOS Biological, Centennial, CO, USA) were measured as per the manufacturer’s instructions (Supplementary Appendix).
Variables and outcomes: The primary exposure was the NLR at admission. Other markers associated with the severity of COVID-19 illness were also tested in univariate analysis, which included peak LDH, peak CRP, the SFR at admission and the peak FiO2 required during acute illness. The potential confounders were age; sex; smoking; comorbidities such as diabetes mellitus, hypertension, coronary artery disease, obesity, chronic liver disease, chronic kidney disease, or obstructive airway disease; the requirement of ARS (mechanical ventilation or HFNC) and the LOS. The strength of association between the primary exposure and the confounders with the outcome of interest: CS-DPLA at the two and six month visits was assessed using odds ratios (ORs). The secondary outcome was the comparison of the levels of SP-D, CA 15-3 and TGF-β among cases, controls and healthy volunteers.
Statistical analysis: A formal sample size calculation was not performed, as the prevalence of CS-DPLA as defined in this study was not known at study initiation. The prospective cohort used as the source of the cases and controls in this study was time bound with the last inclusion in August 2021 and follow up till February 2022. All analyses were performed using the Statistical Package for the Social Sciences (SPSS) software for MS Windows (version 22; SPSS Inc.; Chicago, IL, USA). Descriptive data was presented as mean±standard deviation (SD), median (interquartile range) or number (percentage). The categorical variables were compared using the Chi-squared test (or Fischer’s exact test) and continuous variables using Student’s t test (or Mann-Whitney U test). Cohen’s Kappa statistics was used to assess the agreement between radiologists for scoring disease extent on chest CT. The association of the primary exposure and confounding factors with CS-DPLA was assessed by the univariate and multivariate logistic regression analyses. Multicollinearity was assessed amongst the markers of acute COVID-19 severity by calculating Spearman’s correlation coefficients and the variation inflation factor. For multivariate analysis, the primary exposure, the demographic variables known to be risk factors for diffuse parenchymal lung abnormalities (age, sex and smoking) and any variables with a P<0.1 in univariate analyses were entered as covariates. The OR and aOR was calculated for the tested covariates, along with the 95 per cent confidence intervals (CI).
Results
A total of 285 participants were screened, of which 236 were included in the prospective cohort (Fig. 2), with a mean age of 56.2 yr (34.3% women). Of these, 180 (76.3%) participants made a follow up visit at two and/or six months. Participants lost to follow up (n=56; 23.7%) had lower dyspnoea severity, lesser radiologic lung involvement and a lower prevalence of resting hypoxemia at baseline (Supplementary Table I). Three participants died during the follow up, all of them within the first two months. The probable causes of death were myocardial infarction, advanced renal failure and pulmonary embolism. One hundred and sixty and 110 participants presented for the two-month and six month visits, respectively. There was moderate agreement among the radiologists for categorizing the extent of lung parenchymal involvement with post COVID-19 DPLA in the two months (weighted Cohen’s kappa, 0·75) and six months (weighted Cohen’s kappa, 0·76) chest CT scans. About 176/180 (97.8%) of our participants received glucocorticoids during hospitalization, while 141/180 (78.3%) of the participants received low-medium dose glucocorticoids after discharge. About 14/180 (7.8%) of our participants developed infections during the follow up (4 urinary tract infection, 2 tuberculosis, 2 wound infection and pulmonary aspergillosis, tracheostomy site infection, infective diarrhoea, recurrent COVID-19, chickenpox and cellulitis in 1 participant each).
| Baseline parameters | All participants (n=236), n (%) | Lost to follow up (n=56), n (%) | Under follow up (n=180), n (%) | P |
|---|---|---|---|---|
| Age (yr), mean±SD | 56.2±11.4 | 54.3±11.9 | 56.8±11.2 | 0.14 |
| Male sex | 155 (65.7) | 36 (64.3) | 119 (66.1) | 0.8 |
| Smokers | 41 (17.4) | 4 (7.1) | 37 (20.6) | 0.02 |
| Co-morbid illnesses | ||||
| Any | 196 (83.1) | 44 (78.6) | 152 (84.4) | 0.31 |
| Diabetes mellitus | 137 (58.1) | 29 (51.8) | 108 (60) | 0.28 |
| Hypertension | 109 (46.2) | 23 (41.4) | 86 (47.8) | 0.38 |
| Obesity | 75 (31.8) | 13 (23.2) | 62 (34.4) | 0.12 |
| Coronary artery disease | 28 (11.9) | 7 (12.5) | 21 (11.7) | 0.87 |
| Chronic kidney disease | 11 (4.7) | 5 (56) | 6 (3.3) | 0.14 |
| Obstructive airway disease | 11 (4.7) | 2 (3.6) | 9 (5) | 1.00 |
| Others | 29 (12.3) | 6 (10.7) | 23 (12.8) | 0.68 |
| Parameters during acute illness, median (IQR) | ||||
| NLR at admission | 11.2 (6.8-22.6) | 7.8 (4.9-12.7) | 13.8 (7.6-23.9) | <0.001 |
| Peak LDH, U/l | 434 (338-572) | 389 (307-493) | 447 (355-600) | 0.01 |
| Peak CRP, mg/l | 67.7 (33.6-128.6) | 66.5 (25.1-129) | 68.1 (35.8-128.8) | 0.69 |
| SpO2/FiO2 ratio at admission | 204±105 | 204±107 | 204±104 | 0.99 |
| Peak FiO2 required | 0.63±0.26 | 0.59±0.26 | 0.65±0.26 | 0.18 |
| Highest level of respiratory support | ||||
| Oxygen supplementation only | 168 (71.2) | 45 (80.4) | 123 (68.3) | 0.08 |
| Advanced respiratory support | 68 (28.8) | 11 (56) | 57 (31.7) | 0.08 |
| High-flow nasal oxygen | 23 (9.7) | 5 (8.9) | 18 (10) | |
| Non-invasive ventilation | 32 (13.6) | 4 (7.1) | 28 (15.6) | |
| Invasive mechanical ventilation | 13 (5.5) | 2 (3.6) | 11 (6.1) | |
| Drugs for acute COVID-19 | ||||
| Glucocorticoids | 230 (97.5) | 54 (96.4) | 176 (97.8) | 0.58 |
| Remdesivir | 161 (68.2) | 37 (66.1) | 124 (68.9) | 0.69 |
| Tocilizumab | 27 (11.4) | 5 (8.9) | 22 (12.2) | 0.50 |
| Length of hospital stay, mean±SD | 13.1±8 | 9.6±5.1 | 14.2±8.4 | <0.001 |
| Parameters at discharge | ||||
| Dyspnoea severity, mMRC scale | <0.001 | |||
| 0 | 5 (2.1) | 1 (1.8) | 4 (2.2) | |
| 1 | 18 (7.6) | 10 (17.9) | 8 (4.4) | |
| 2 | 74 (31.4) | 23 (41.1) | 51 (28.3) | |
| 3 | 59 (25) | 15 (26.8) | 44 (24.4) | |
| 4 | 80 (33.9) | 7 (12.5) | 73 (40.6) | |
| Resting oxygen saturation, ± | 95±4 | 97±3 | 95±4 | 0.002 |
| 6MWD, ± | 297±113 | 344±93 | 281±115 | 0.001 |
| Percentage of the predicted, ± | 66.0±23.9 | 75.7±18.7 | 62.6±24.6 | <0.001 |
| Abnormalities on chest CT | ||||
| ≥20 per cent involvement | 206 (87.3) | 43 (76.8) | 163 (90.6) | 0.007 |
| Ground glass opacities | 225 (95.3) | 52 (92.9) | 173 (96.1) | 0.31 |
| Consolidation | 145 (61.4) | 27 (48.2) | 118 (65.6) | 0.02 |
| Parenchymal bands | 131 (55.5) | 35 (62.5) | 96 (53.3) | 0.28 |
| Reticulation | 74 (31.4) | 12 (21.4) | 62 (34.4) | 0.07 |
| Traction bronchiectasis | 9 (3.8) | 2 (3.6) | 7 (3.9) | 0.91 |
COVID-19, coronavirus disease 2019; CT, computed tomography; FiO2, fraction of inspired oxygen; LDH, lactate dehydrogenase; mMRC, modified Medical Research Council; NLR, neutrophil-lymphocyte ratio; SpO2, oxygen saturation by pulse oximetry; l, litre; mg, milligram; U, units; IQR, interquartile range; SD, standard deviation; CRP, C-reactive protein; 6MWD, six minute walk distance
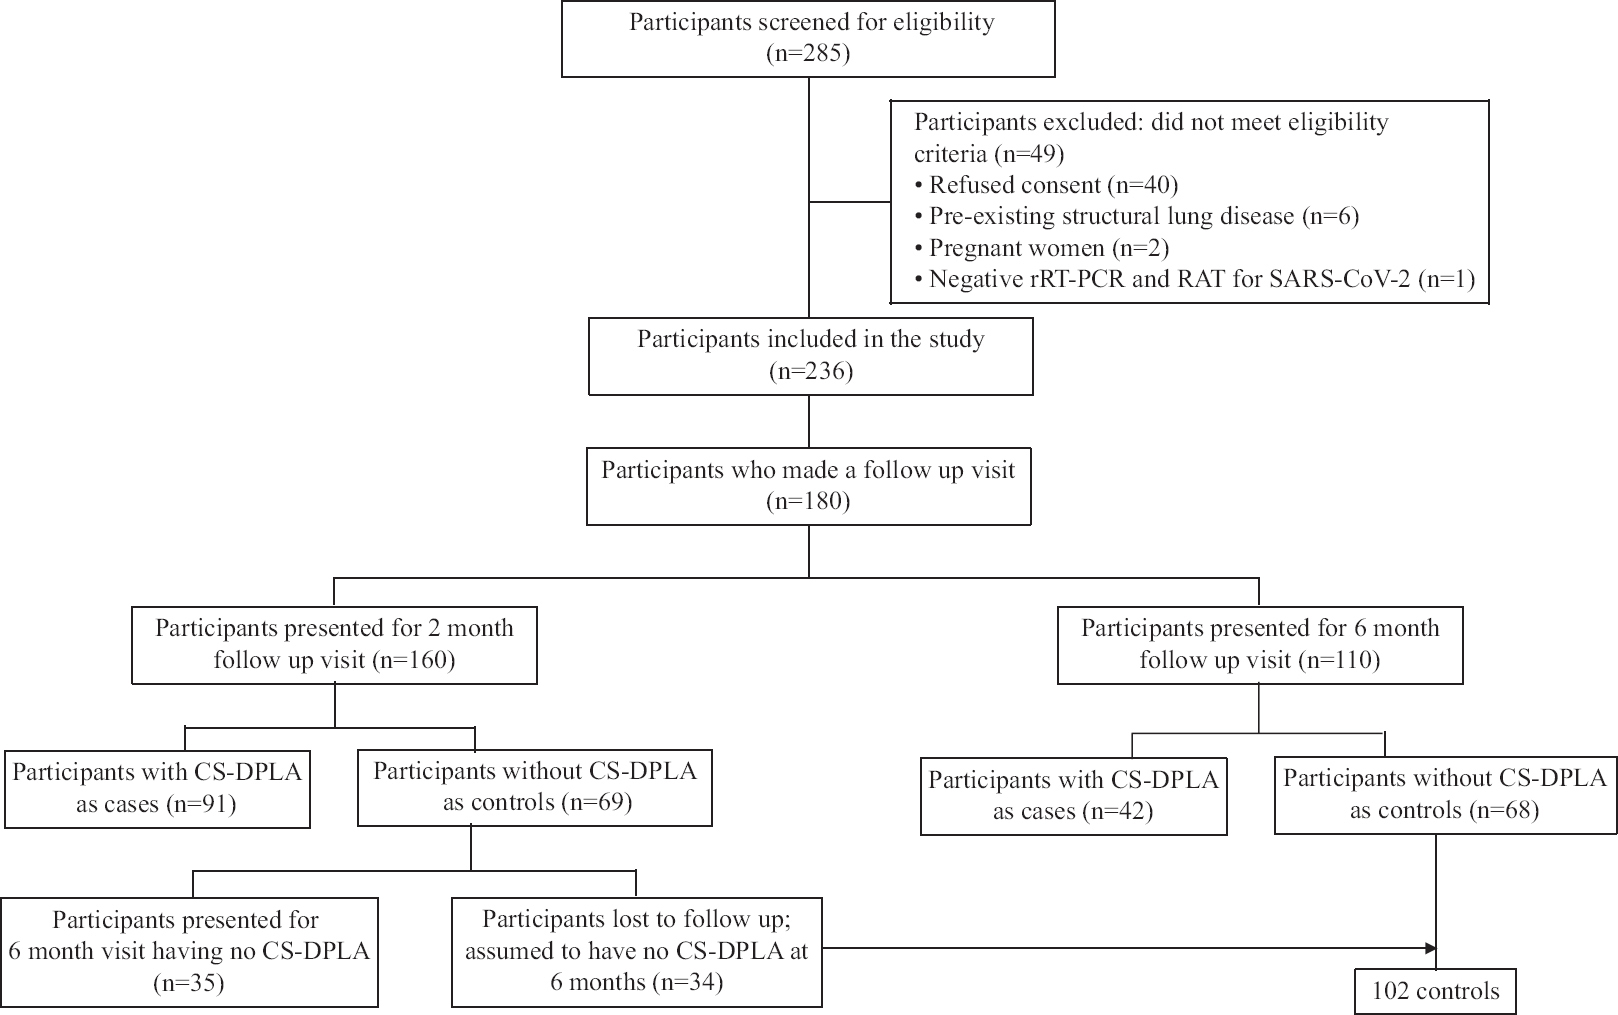
- Participant flow chart.
Prevalence of clinically significant diffuse parenchymal lung abnormalities (CS-DPLA) at two and six months: Of the 160 participants, who made a follow up visit at two months, 91 (56.9%) had CS-DPLA (cases), whereas 69 (43.1%) subjects qualified as controls. Thirteen participants (controls) had dyspnoea severity of mMRC grade 2 or more at two months but had <20 per cent lung involvement on the chest CT; all improved at six months. Of the 91 subjects with CS-DPLA (cases) at two months, 36 continued to have CS-DPLA at six months (counted as cases at six months), 19 did not have CS-DPLA at six months (counted as controls at six months), while 36 were lost to follow up. Among the 36 who were lost to follow up, 26 did not have significant dyspnoea and nine had significant dyspnoea on telephonic enquiry at six months. One participant could not be contacted.
At six months, 110 partcipants presented for follow up. Thirty four participants, who did not have CS-DPLA at two months, did not present for further follow up. On telephonic enquiry, none complained of respiratory symptoms. Therefore, we assumed these 34 participants as not having CS-DPLA at six months either. We made this assumption because all the controls from the two month visit, who presented for the six month visit (n=35) remained free of CS-DPLA at the latter visit also (Fig. 2). Thus, 144 participants were included in the six month analysis. Of these, 42 (29.2%) had CS-DPLA (cases), whereas 102 (70.8%) participants qualified as controls. The radiologic assessment was performed on chest radiography for 32 of the 110 subjects at six months as they refused to undergo chest CT scan (five qualified as cases, while 27 were designated as controls). Six participants did not present at two months but had CS-DPLA at six months. The dyspnoea severity was higher while the %pred FVC and the 6MWD were lower in the cases compared to controls at two and six months (Supplementary Table II).
| Follow up parameters | Two months’ visit | Six months’ visit | ||||
|---|---|---|---|---|---|---|
| Controls (n=69) | Cases (n=91) | P | Controls (n=68) | Cases (n=42) | P | |
| Dyspnoea severity, mMRC scale | 1±0.6 | 1.7±1.0 | <0.001 | 0.4±0.6 | 1±0.9 | <0.001 |
| Resting oxygen saturation | 98±1 | 97±2 | <0.001 | 99±1 | 98±1 | 0.19 |
| FVC, l | 2.54±0.69 | 2.06±0.61 | <0.001 | 2.64±0.77 | 2.29±0.58 | 0.01 |
| FVC, per cent predicted | 79.5±11.9 | 63.6±13.5 | <0.001 | 80.5±12.6 | 70.3±10.4 | <0.001 |
| 6MWD, metres | 370±96 | 304±122 | 0.001 | 414±90 | 370±111 | 0.03 |
| Per cent predicted | 83±19.7 | 67.9±25.7 | 0.001 | 91.9±17.6 | 83±23.4 | 0.03 |
The values represent either mean±SD. ILD, interstitial lung disease; mMRC, modified Medical Research Council; SD, standard deviation; FVC, forced-vital capacity; 6MWD, six-minute walk distance
About 13 and 60 per cent of our participants were free of dyspnoea (mMRC grade 0) at two months and six months, respectively (Fig. 3). Among participants with CS-DPLA at two months, 85.7 per cent had a restrictive defect, 2.8 per cent had obstructive defect, whereas 8.3 per cent had normal spirometry. Among participants with CS-DPLA at six months, 88.9 per cent had restrictive defect, 4.8 per cent had obstructive defect and 9.5 per cent had normal spirometry. Participants with CS-DPLA at two months had significant improvement in FVC at the six month follow up [mean (SD), 332 (287) ml] as compared to those without [mean (SD), 176 (237) ml; P=007]. About 74.4 per cent of the participants undergoing a chest CT at six months had persistent ground glass opacities, whereas 33.3 per cent had traction bronchiectasis (Supplementary Table III).
| Abnormality | Two months visit | Six months visit* | ||||
|---|---|---|---|---|---|---|
| Controls (n=69), n (%) | Cases (n=91), n (%) | P | Controls (n=41) | Cases (n=37) | P | |
| Ground-glass opacities | 53 (76.8) | 83 (91.2) | 0.01 | 24 (58.5) | 34 (91.9) | 0.001 |
| Consolidation | 3 (4.3) | 14 (15.4) | 0.03 | 3 (7.3) | 0 | 0.24 |
| Parenchymal bands | 32 (46.4) | 67 (73.6) | <0.001 | 22 (53.7) | 31 (83.8) | 0.004 |
| Reticulation | 9 (13) | 44 (48.4) | <0.001 | 3 (7.3) | 16 (43.2) | <0.001 |
| Traction bronchiectasis | 3 (4.3) | 22 (24.2) | 0.001 | 6 (14.6) | 20 (54.1) | <0.001 |
*Abnormalities reported for 78 participants who underwent CT at six months. CS-DPLA, clinically significant diffuse parenchymal lung abnormalities; CT, computed tomography
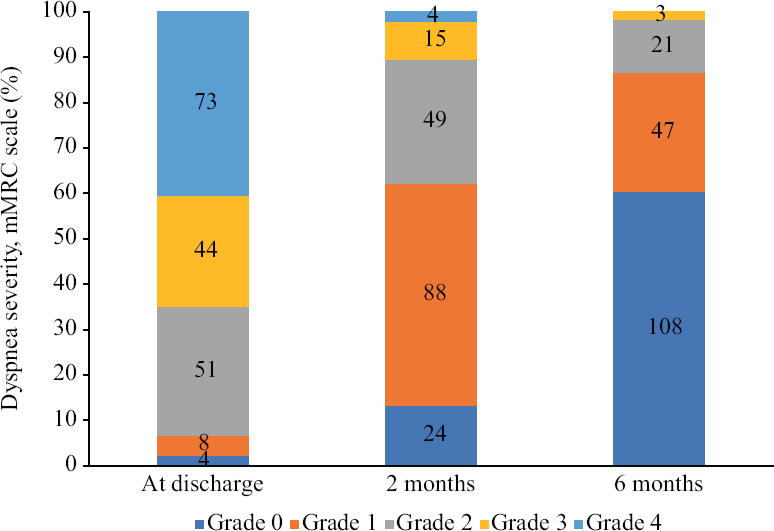
- Dyspnoea severity graded on the modified Medical Research Council (mMRC) scale in study participants at the two and six month visits.
Predictors of CS-DPLA at two and six months: Participants with CS-DPLA at two months had higher NLR at admission and peak LDH, longer LOS and required ARS more commonly than the controls (Table I). Participants with CS-DPLA at six months had higher NLR at admission and a longer hospital LOS. Multicollinearity was absent amongst the measures of acute COVID-19 severity (NLR, peak LDH, peak CRP, SFR and peak FiO2). Multivariate analysis showed that hospital LOS was the only factor that independently predicted CS-DPLA (Table II) at two months [aOR (95% CI, 1.16 (1.07-1.25); P<0.001] and six months [aOR (95% CI, 1.07 [1.01-1.12]; P=0.01).
| Baseline parameters | CS-DPLA at two months | CS-DPLA at six months | ||||
|---|---|---|---|---|---|---|
| Controls (n=69), n (%) | Cases (n=91), n (%) | P | Controls (n=102), n (%) | Cases (n=42), n (%) | P | |
| Age (yr), mean±SD | 55.8±11.8 | 57.5±9.9 | 0.34 | 55.6±12.1 | 57.5±10.5 | 0.38 |
| Male | 43 (62.3) | 62 (68.1) | 0.44 | 67 (65.7) | 29 (69.0) | 0.7 |
| Smokers | 16 (23.2) | 18 (19.8) | 0.6 | 25 (24.5) | 6 (14.3) | 0.18 |
| Co-morbid illnesses | ||||||
| Major | 60 (87) | 74 (81.3) | 0.34 | 86 (84.3) | 35 (83.3) | 0.88 |
| Others | 10 (14.5) | 8 (8.8) | 0.26 | 16 (15.7) | 6 (14.3) | 0.83 |
| Parameters during acute illness, median (IQR) | ||||||
| NLR at admission | 10.4 (7.5-17.8) | 19.4 (10.7-30.7) | <0.001 | 9.8 (6.6-18) | 18.5 (11.7-30.1) | 0.002 |
| Peak LDH, U/l | 409 (315-510) | 497 (395-710) | 0.001 | 432 (323-566) | 462 (366-725) | 0.15 |
| Peak CRP, mg/l | 59.5 (32.3-138) | 71 (45.1-130) | 0.13 | 59.8 (33.3-121.1) | 75.5 (35-155.3) | 0.3 |
| SpO2/FiO2 ratio at admission, mean±SD | 209±104 | 193±102 | 0.38 | 207±101 | 206±112 | 0.95 |
| Peak FiO2 required, mean±SD | 0.64±0.27 | 0.66±0.27 | 0.64 | 0.64±0.26 | 0.65±0.28 | 0.77 |
| Respiratory support during acute illness | 0.003 | 0.34 | ||||
| Oxygen supplementation only | 54 (78.3) | 51 (56) | 76 (74.5) | 28 (66.7) | ||
| Advanced respiratory support | 15 (21.7) | 40 (44) | 26 (25.5) | 14 (33.3) | ||
| Parameters at discharge | ||||||
| Length of hospital stay, mean±SD | 10.7±6 | 18±8.8 | <0.001 | 12±7.4 | 17.7±10.2 | <0.001 |
| Dyspnoea severity, mMRC scale | <0.001 | 0.04 | ||||
| 0 | 2 (2.9) | 0 | 4 (3.9) | 0 | ||
| 1 | 3 (4.3) | 1 (1.1) | 5 (4.9) | 3 (7.1) | ||
| 2 | 27 (39.1) | 15 (16.5) | 39 (38.2) | 9 (21.4) | ||
| 3 | 22 (31.9) | 20 (22) | 26 (25.5) | 8 (19) | ||
| 4 | 15 (21.7) | 55 (60.4) | 28 (27.5) | 22 (52.4) | ||
| Resting oxygen saturation, mean±SD | 97±2 | 93±4 | <0.001 | 96±3 | 94±4 | 0.001 |
| 6MWD, mean±SD | 301±117 | 240±111 | 0.005 | 300±113 | 249±96 | 0.04 |
| Percentage of the predicted, mean±SD | 67.2±24.6 | 53.4±24.1 | 0.003 | 6.6±23.8 | 56.3±21.6 | 0.05 |
| Abnormalities on baseline chest CT | ||||||
| ≥20 per cent parenchymal involvement | 61 (88.4) | 91 (100) | 0.001 | 88 (86.3) | 39 (92.9) | 0.39 |
| Ground-glass opacities | 69 (100) | 86 (94.5) | 0.07 | 100 (98) | 38 (90.5) | 0.06 |
| Consolidation | 41 (59.4) | 74 (81.3) | 0.002 | 56 (54.9) | 32 (76.2) | 0.02 |
| Parenchymal bands | 40 (58.0) | 40 (44.0) | 0.08 | 59 (57.8) | 23 (54.8) | 0.73 |
| Reticulation | 20 (29) | 35 (38.5) | 0.21 | 31 (30.4) | 19 (45.2) | 0.09 |
| Traction bronchiectasis | 1 (1.4) | 5 (5.5) | 0.24 | 2 (2) | 2 (4.8) | 0.58 |
CT, computed tomography; FiO2, fraction of inspired oxygen; LDH, lactate dehydrogenase; mMRC, modified Medical Research Council; NLR, neutrophil-lymphocyte ratio; SpO2, oxygen saturation by pulse oximetry; CRP, C-reactive protein; SD, standard deviation; IQR, interquartile range; 6MWD, six minute walk distance
| Parameters | CS-DPLA at two months | CS-DPLA at six months | ||||||
|---|---|---|---|---|---|---|---|---|
| OR (95 per cent CI) | P | aOR (95 per cent CI) | P | OR (95 per cent CI) | P | aOR (95 per cent CI) | P | |
| Age, yr | 1.02 (0.99-1.05) | 0.32 | 1.02 (0.98-1.06) | 0.25 | 1.02 (0.98-1.05) | 0.37 | 1.02 (0.98-1.05) | 0.36 |
| Male sex | 1.29 (0.67-2.49) | 0.44 | 1.78 (0.78-4.07) | 0.17 | 1.17 (0.54-2.52) | 0.7 | 1.10 (0.48-2.51) | 0.82 |
| Smoking | 0.82 (0.38-1.75) | 0.60 | 0.61 (0.23-1.60) | 0.32 | 0.51 (0.19-1.36) | 0.18 | 0.54 (0.20-1.48) | 0.23 |
| Major co-morbidity | 0.65 (0.27-1.57) | 0.34 | 0.93 (0.35-2.46) | 0.88 | ||||
| NLR at admission | 1.05 (1.02-1.08) | 0.001 | 1.02 (0.99-1.06) | 0.16 | 1.04 (1.01-1.06) | 0.008 | 1.02 (0.99-1.05) | 0.16 |
| Peak LDH | 1.00 (1.00-1.01) | 0.003 | 1.00 (0.99-1.00) | 0.30 | 1.00 (1.00-1.00) | 0.12 | ||
| Peak CRP | 1.00 (0.99-1.01) | 0.18 | 1.00 (0.99-1.01) | 0.16 | ||||
| SpO2/FiO2 ratio at admission | 0.99 (0.99-1.00) | 0.38 | 1.00 (0.99-1.00) | 0.95 | ||||
| Peak FiO2 | 1.34 (0.41-4.35) | 0.63 | 1.23 (0.31-4.83) | 0.77 | ||||
| Advanced respiratory support | 2.82 (1.39-5.72) | 0.004 | 1.44 (0.60-3.45) | 0.41 | 1.46 (0.67-3.19) | 0.34 | ||
| Length of hospital stay | 1.19 (1.11-1.27) | <0.001 | 1.16 (1.07-1.25) | <0.001 | 1.08 (1.03-1.13) | 0.001 | 1.07 (1.01-1.12) | 0.01 |
OR, odds ratio; aOR, adjusted OR; CI, confidence intervals; CRP, C-reactive protein; FiO2, fraction of inspired oxygen; LDH, lactate dehydrogenase; NLR, neutrophil-lymphocyte ratio; SpO2, oxygen saturation by pulse oximetry
Biomarkers: The cases at two months had higher baseline serum levels of SP-D and CA 15-3 than the healthy volunteers and higher SP-D than the controls (Table III). Among those without CS-DPLA, the CA 15-3 was significantly elevated than the healthy volunteers. Participants with CS-DPLA at six months had higher baseline serum levels of TGF-β than the healthy volunteers.
| Biomarker | Healthy controls (n=20) | CS-DPLA at two months | CS-DPLA at six months | ||
|---|---|---|---|---|---|
| Controls (n=29) | Cases (n=49) | Controls (n=41) | Cases (n=23) | ||
| Surfactant protein D, U/ml | 4.1 (0.8-7.6) | 3.1 (1.4-6.2) | 6 (2.6-10.7)a,b | 4.1 (1.5-10.2) | 5.3 (2.9-10.2) |
| Cancer antigen 15-3/Mucin 1, U/ml | 14 (3.3-42.1) | 42.3 (16.9-72.1)a | 51.3 (23.1-88.7)a | 50 (21.8-71.1)a | 38.9 (8.9-92.5) |
| Transforming growth factor-β, pg/ml | 638.7 (500.5-826.9) | 750.6 (308.7-978) | 812.2 (607.1-968.8) | 714 (359.5-978) | 841.3 (707.5-1100)a |
The values represent the median (IQR). aP<0.05 for comparison with healthy volunteers; bP<0.05 for comparison with diseased controls without CS-DPLA at follow up. CS-DPLA, clinically significant diffuse parenchymal lung abnormalities; IQR, interquartile range
Discussion
We did not find an independent association of the NLR at the time of hospital admission for severe COVID-19 with CS-DPLA in our study. The length of hospital stay was found to be the only factor independently associated with CS-DPLA at two and six months after severe COVID-19 pneumonia. We also found TGF-β as a potential biomarker of CS-DPLA at six months.
The prevalence of residual lung imaging abnormalities at six months has been reported to range between 20 and 100 per cent4-7. The wide variation is due to the reporting of even minor residual CT findings in several studies, which might be clinically inconsequential. About 10 per cent of patients with post-COVID-19 DPLA may have abnormal spirometry, while 20-60 per cent may have diffusion impairment, depending on the initial COVID-19 severity5,6. Viewing radiologic, lung function and oxygenation abnormalities in isolation fails to provide a precise understanding of their clinical significance. Our composite assessment approach based on breathlessness, radiologic abnormalities, spirometry and measures of gas exchange is thus clinically more relevant. Our choice of 20 per cent involvement on a visual assessment of the chest CT as the threshold for defining significant radiologic involvement was arbitrary. However, it was based on the conventional practice for defining clinically significant disease in systemic sclerosis-related ILD15. Dyspnoea severity of ≥2 on the mMRC scale was considered as clinically significant based on previous evidence for the clinical relevance of this threshold in patients with idiopathic pulmonary fibrosis21.
The prevalence of CS-DPLA at two and six months was about 60 and 30 per cent, respectively in hypoxemic patients discharged after hospitalization for severe COVID-19. The true prevalence is likely to be lower as nearly one fourth of our participants were lost to follow up. These participants had lower dyspnoea severity, higher oxygen saturation and lesser radiologic involvement at discharge and would be expected to have a lower prevalence of CS-DPLA than those who presented for follow up. The prevalence of post-COVID-19 sequelae in the longer term is generally considered to be 10 per cent in unselected patient populations11,22. About 60 per cent of our study participants were free of dyspnoea at six months. In three previously reported large follow up studies, 70-74 per cent of patients had no dyspnoea at six months of follow up5,6,8. This is attributable to the baseline difference in the study populations. All our study participants required supplemental oxygen and several required mechanical ventilation. Contrastingly, in two of the previous studies5,6, hospitalized participants with milder illnesses were also included; while, in the study by Wu et al8, patients who had been mechanically ventilated were excluded5,6,8.
The NLR was selected as a surrogate for COVID-19 severity as it has been found to correlate with the severity and outcomes of acute illness in several studies23-25. Confounders were selected based on the results of previous studies on COVID-19 sequelae4,7,11,12,26. Age, severity of the acute illness (measured using a variety of parameters in different studies including the severity of hypoxemia, tachycardia, radiologic score, LDH, CRP and others), mechanical ventilation and hospital LOS might predict residual radiologic and physiologic abnormalities4,7,11,12,26. The parameters of acute COVID-19 severity (NLR, peak LDH, peak CRP, SFR and peak FiO2) did not predict CS-DPLA at six months in our study, although NLR had a significant association in the univariate model. We found only the hospital LOS to be independently associated with CS-DPLA at six months. The length of hospital stay has been the most consistent predictor of pulmonary sequelae across studies4,7,9,26. This indicates that lung parenchymal injury during severe COVID-19 pneumonia is multifactorial11. The initial severity of the SARS-CoV-2 infection (reflected by NLR, LDH, CRP, hypoxemia and others) causing extensive diffuse alveolar damage is an important factor. However, it is possibely that the duration for which the lung injury persists, both because of the infection and the effects of the medical management including ARS, best predicts clinically significant lung sequelae in the longer term27. The duration of intensive care unit (ICU) stay and mechanical ventilation could be more precise measures of the duration of lung injury. However, due to the blurred boundaries between ICU and non-ICU units, extensive use of HFNC, frequently alternating usage of NIV and HFNC and changing triggers for IMV during the deluge of the COVID-19 pandemic, the two parameters could not be measured accurately28.
Substantial differences found between COVID-19 related and classical acute respiratory distress syndrome, could be due to the facts that the biomarkers indicative of endothelial injury, were found to be higher in COVID-19-related ARDS, supporting different pathophysiological pathways for these two syndromes29. Further, COVID-19 leaves behind substantial sequelae that mimic an interstitial lung disease process30. SP-D, a marker of lung injury and TGF-β, a key cytokine involved in lung fibrosis has been previously used as prognostic and severity markers for chronic ILDs31-33. SP-D was found elevated and correlated with disease severity during acute COVID-19 illness in a previous study34. Another study reported higher levels of TGF-β in patients with radiologic changes suggesting lung fibrosis after COVID-1935. In our study, patients with CS-DPLA at two months had elevated levels of SP-D and CA 15-3. CA 15-3 was also elevated in the control group as compared to healthy volunteers and thus seems to offer a lesser discriminant potential. Participants with CS-DPLA at six months had elevated TGF-β at the baseline visit possibly reflecting the initiation of a profibrotic pathway in such patients right at the time of hospital discharge (or even earlier). These serum cytokines, especially SP-D and TGF-β should be explored further as biomarkers for predicting significant residual lung sequelae after COVID-19. Besides, elevated TGF-β levels provide a pathophysiological basis for ongoing studies of TGF-β inhibitors such as pirfenidone and other antifibrotic agents in patients with persistent residual abnormalities after severe COVID-19 (Clinicaltrials.gov identifiers; NCT04653831, NCT04282902, NCT04607928, NCT04856111, NCT04541680, NCT04338802 and NCT04619680)30,36.
The findings of the present study indicate that a considerable proportion of patients may continue to have CS-DPLA at six months, especially those with severe acute disease and prolonged hospitalization. Elevated levels of TGF-β at the time of discharge may indicate a higher risk of having CS-DPLA at six months. Such participants must be followed up closely after discharge from the hospital. Besides, our study proposes a framework for a multidimensional assessment of patients after recovery from acute COVID-19.
The present investigation is limited by its single centre design and significant attrition. We tried mitigating the bias due to attrition by comparing the characteristics of included participants with those lost to follow up. We could not measure the biomarkers in all included participants due to logistic constraints. Furthermore, the diffusion capacity of the lungs and baseline spirometric parameters could not be measured due to COVID-19 restrictions. Several participants underwent only chest radiography during the six-month visit as they refused a repeat CT evaluation. Chest CT has its limitations as it involves radiation exposure, and thus, repeat studies cannot be obtained frequently. Electrical impedance tomography is an imaging technique that reconstructs the images of a specific body part based on the electrical conductivity of biological tissue. It does not involve radiation and can also provide information on the dynamic changes in the lung. Its successful use in COVID-19 survivors has been reported recently37. We assumed participants not having CS-DPLA at two months as not having CS-DPLA at six months either, as they did not have any respiratory complaints. Although a limitation, it is unlikely that participants who have disease resolution at two months would have any recurrence. Furthermore, most of our cases at six months were derived from those who had CS-DPLA at two months as well.
The findings of the present study suggest that among hypoxemic patients hospitalized for severe COVID-19, about 40 per cent participants continued to have dyspnoea severity of at least mMRC grade 1 at six months after discharge. CS-DPLA was present in about 60 and 30 per cent at the two and six month follow up, respectively. The length of hospital stay was found to be the only independent predictor of CS-DPLA at six months. SP-D and TGF-β should be further explored as biomarkers for assessing the risk of CS-DPLA after severe COVID-19 pneumonia.
Data statement: Data collected for the study, including de-identified participant data and related documents, including the protocol, statistical analysis plan and informed consent form, will be made available to qualified researchers after the publication of the manuscript upon reasonable request via application to the corresponding author.
Financial support and sponsorship
None.
Conflicts of interest
None.
References
- Multidisciplinary approach for post-acute COVID-19 syndrome: Time to break down the walls. Eur Respir J. 2021;58:2101090.
- [Google Scholar]
- The conundrum of 'long-COVID-19': A narrative review. Int J Gen Med. 2021;14:2491-506.
- [Google Scholar]
- High-dose versus low-dose prednisolone in symptomatic patients with post-COVID-19 diffuse parenchymal lung abnormalities: An open-label, randomised trial (the COLDSTER trial) Eur Respir J. 2022;59:2102930.
- [Google Scholar]
- Inflammatory burden and persistent CT lung abnormalities in COVID-19 patients. Sci Rep. 2022;12:4270.
- [Google Scholar]
- 6-month consequences of COVID-19 in patients discharged from hospital: A cohort study. Lancet. 2021;397:220-32.
- [Google Scholar]
- 1-year outcomes in hospital survivors with COVID-19: A longitudinal cohort study. Lancet. 2021;398:747-58.
- [Google Scholar]
- Characteristics and prognostic factors of pulmonary fibrosis after COVID-19 pneumonia. Front Med (Lausanne). 2021;8:823600.
- [Google Scholar]
- A follow-up study of lung function and chest computed tomography at 6 months after discharge in patients with coronavirus disease 2019. Can Respir J. 2021;2021:6692409.
- [Google Scholar]
- Persistent health problems beyond pulmonary recovery up to 6 months after hospitalization for COVID-19: A longitudinal study of respiratory, physical, and psychological outcomes. Ann Am Thorac Soc. 2022;19:551-61.
- [Google Scholar]
- Factors influencing liberation from mechanical ventilation in coronavirus disease 2019: Multicenter observational study in fifteen Italian ICUs. J Intensive Care. 2020;8:80.
- [Google Scholar]
- European Respiratory Society statement on long COVID follow-up. Eur Respir J. 2022;60:2102174.
- [Google Scholar]
- Medium-term impact of COVID-19 on pulmonary function, functional capacity and quality of life. Eur Respir J. 2021;58:2004015.
- [Google Scholar]
- Residual lung disease at six-month follow-up CT after COVID-19: Clinical significance is a key issue. Radiology. 2021;301:E406-8.
- [Google Scholar]
- Sequelae of COVID-19 pneumonia: Is it correct to label everything as post-COVID lung fibrosis? J Postgrad Med. 2021;67:224-7.
- [Google Scholar]
- Interstitial lung disease in systemic sclerosis: A simple staging system. Am J Respir Crit Care Med. 2008;177:1248-54.
- [Google Scholar]
- Fleischner Society: Glossary of terms for thoracic imaging. Radiology. 2008;246:697-722.
- [Google Scholar]
- Development of a simple computer program for spirometry interpretation. J Assoc Physicians India. 2002;50:567-70.
- [Google Scholar]
- An official European Respiratory Society/American Thoracic Society technical standard: Field walking tests in chronic respiratory disease. Eur Respir J. 2014;44:1428-46.
- [Google Scholar]
- Reference equation for six minute walk test in healthy Western India population. J Clin Diagn Res. 2016;10:CC01-4.
- [Google Scholar]
- mMRC dyspnoea scale indicates impaired quality of life and increased pain in patients with idiopathic pulmonary fibrosis. ERJ Open Res. 2017;3:00084-2017.
- [Google Scholar]
- Development and validation of a clinical risk score to predict the occurrence of critical illness in hospitalized patients with COVID-19. JAMA Intern Med. 2020;180:1081-9.
- [Google Scholar]
- Development and validation of a prediction model for 30-day mortality in hospitalised patients with COVID-19: The COVID-19 SEIMC score. Thorax. 2021;76:920-9.
- [Google Scholar]
- Characteristics and outcomes of US children and adolescents with multisystem inflammatory syndrome in children (MIS-C) compared with severe acute COVID-19. JAMA. 2021;325:1074-87.
- [Google Scholar]
- Six-month follow-up chest CT findings after severe COVID-19 pneumonia. Radiology. 2021;299:E177-86.
- [Google Scholar]
- A prospective study of 12-week respiratory outcomes in COVID-19-related hospitalisations. Thorax. 2021;76:402-4.
- [Google Scholar]
- Transforming a general hospital to an infectious disease hospital for COVID-19 over 2 weeks. Front Public Health. 2020;8:382.
- [Google Scholar]
- Markers of endothelial and epithelial pulmonary injury in mechanically ventilated COVID-19 ICU patients. Crit Care. 2021;25:74.
- [Google Scholar]
- Pulmonary fibrosis and COVID-19: The potential role for antifibrotic therapy. Lancet Respir Med. 2020;8:807-15.
- [Google Scholar]
- An epithelial biomarker signature for idiopathic pulmonary fibrosis: An analysis from the multicentre PROFILE cohort study. Lancet Respir Med. 2017;5:946-55.
- [Google Scholar]
- Efficacy and safety of pirfenidone in systemic sclerosis-related interstitial lung disease –A randomised controlled trial. Rheumatol Int. 2020;40:703-10.
- [Google Scholar]
- Circulating plasma biomarkers of survival in antifibrotic-treated patients with idiopathic pulmonary fibrosis. Chest. 2020;158:1526-34.
- [Google Scholar]
- Serum surfactant protein D in COVID-19 is elevated and correlated with disease severity. BMC Infect Dis. 2021;21:737.
- [Google Scholar]
- Post-COVID-19 patients who develop lung fibrotic-like changes have lower circulating levels of IFN-βbut higher levels of IL-1αand TGF-β. Biomedicines. 2021;9:1931.
- [Google Scholar]
- A multicenter survey study of antifibrotic use for symptomatic patients with post-COVID-19 interstitial lung abnormalities. Lung India. 2022;39:254-60.
- [Google Scholar]
- Long-term dyspnea, regional ventilation distribution and peripheral lung function in COVID-19 survivors: A 1 year follow up study. BMC Pulm Med. 2022;22:408.
- [Google Scholar]
Supplementary Material
Appendix: Detailed methodology of study assessments
Assessment of dyspnoea
The severity of dyspnoea was assessed at the baseline, two and six months using the Modified Medical Research Council (mMRC) scale1. The mMRC scale is a self-rating tool that measures the level of disability that breathlessness poses on day-to-day activities on a five point scale. On this scale, 0 represents no breathlessness except on strenuous exercise; 1, shortness of breath while hurrying on level ground or walking up a slight hill; 2, the patient walks slower than people of the same age on the level because of breathlessness or has to stop to catch a breath when walking at his/her own pace on the level; 3, has to stop for breath after walking about 100 m or after a few minutes on the level and 4 signifies that the patient is too breathless to leave the house or breathless while dressing or undressing.
Spirometry
Spirometry was performed according to the American Thoracic Society (ATS)/European Respiratory Society (ERS) guidelines using an ultrasonic flow sensor spirometer (NDD Medizintechnik AG, Zurich, Switzerland)2. Measurements included the forced vital capacity (FVC) and forced expiratory volume in the 1st sec (FEV1). The predicted values and the lower limits of normal (LLN) were calculated using the standard reference equations3. The ratio of FEV1/FVC was calculated. If the ratio of FEV1/FVC was less than the LLN, the subject was considered to have an obstructive defect. If the ratio of FEV1/FVC was more than the LLN, but FVC was below the LLN for FVC, the subject was considered to have a restrictive defect. Spirometry was considered normal if the ratio, FVC and FEV1 were all above the respective LLN values.
Six minute walk test (6MWT)
A 6MWT was performed according to the ATS/ERS guidelines4. The subject was made to sit on a chair near the start line and the heart rate (HR), blood pressure and pulse oximetric saturation were measured. The subject was asked to rate his/her dyspnoea and fatigue on the Borg scale. The subject was provided the recommended standardized initial instructions: “The aim of this test is to walk as far as possible for six minutes. You will walk along this hallway between the markers, as many times as you can in six minutes. I will let you know as each minute goes past, and then at six minutes, I will ask you to stop where you are. Six minutes is a long time to walk, so you will be exerting yourself. You are permitted to slow down, to stop and to rest as necessary, but please resume walking as soon as you are able. Remember that the objective is to walk as far as possible for six minutes, but don‘t run or jog”. The subject was positioned at the start line. A portable pulse oximeter was fixed to his/her finger. A timer was started when the subject started walking. The assessor walked slightly behind the subject observing the oxygen saturation. Standardized phrases of encouragement were said after each minute. If the subject felt breathless, fatigued, or giddy, or the saturation fell below 80 per cent at any time, he/she was asked to stop. The subject was asked to recommence walking once the saturation was ≥90 per cent. He/she was encouraged to walk again every 30 sec. The minimum oxygen saturation and maximum HR was recorded during the test and the end-of-test oxygen saturation and HR. The post-test Borg dyspnoea and fatigue rating were also recorded. The total distance walked during the test was measured and recorded. The predicted values was calculated using the available reference equation for our population, derived by Fernandes, et al: 553.289 + (−2.11 × age) + (45.323 × sex; men=1 and women=0)5.
One minute sit-to-stand test
In participants, in whom 6MWT could not be performed, one-minute sit-to-stand test (1STST) was performed to detect exercise-induced oxygen desaturation. The 1STST was performed as previously described with a chair of standard height without armrests, placed against a wall6. The subject was advised to sit upright with knees and hips flexed at right angles and the feet placed flat on the floor a hip-width apart. The subject was told to hold his/her arms stationary by placing the hands on the hips. He/she was asked to perform repetitions of standing up and then sitting down in the same position at a safe and comfortable, self-paced speed as many times as possible for one minute. He/she was instructed not to use his/her arms for support while getting up or sitting down. The subject was permitted to rest during the one-minute period if he/she required to. A finger pulse oximeter was connected throughout the test to record the oxygen saturation and HR and the minimum oxygen saturation during the test was recorded.
Assessment of computed tomography
The computed tomography (CT) of the chest was performed on the third generation dual source CT 128 slice scanner- Somatom Definition Flash (Siemens Healthcare, Forchheim, Germany) or CT 256 Slice scanner (Philips Brilliance iCT) at the baseline, two and six months. We reconstructed thin collimation (1 mm) sections. Two radiologists (M.G., N.P.), with more than 20 and seven year of experience, respectively interpreted The CT chest. The radiologists were blinded to the clinical and laboratory details of the study subjects. The radiologists first independently evaluated the extent of lung parenchymal involvement with COVID-19-related abnormalities and categorized them into ≥20 per cent or <20 per cent. Disagreements in the initial categorization were resolved by discussion and a consensus was reached. The radiologists also interpreted each CT on DICOM images and recorded the findings. Using standard definitions, the presence of ground-glass opacities, consolidation, parenchymal bands, reticulation and traction bronchiectasis (or honeycombing) was recorded in consensus7. Reticulation was defined as a lacy or meshwork pattern resulting from intralobular or interlobular septal thickening. Irregular lines, subpleural lines or atelectatic bands were categorized into parenchymal bands.
Methodology for measuring the levels of biomarkers
Venous blood (5 ml) was collected in plain vials from the included cases, controls and healthy volunteers. After incubation at room temperature for 30 min, blood samples were centrifuged at 286 g for 20 min to collect serum, which was stored at −80°C till further processing.
The level of transforming growth factor-β (TGF-β), human cancer antigen (CA) 15-3 and human surfactant protein (SP)-D was measured using the enzyme-linked immunosorbent assay (ELISA). Human TGF-β1 (catalogue # NBP-1-91252), human CA 15-3/mucin-1 (catalogue # NBP2-59962) and human SP-D (catalogue # DSFPD0) immunoassay kits (NOVUS Biologicals, Centennial, Colorado, United States) was used following the manufacturer's instructions. Serum samples were transferred to 4°C for overnight storage. Briefly, the serum samples were allowed to thaw, diluted 1:10 with the diluent buffer provided with the kit and incubated at ambient temperature for 30 min. After incubation, the supernatant was aspirated and washing was repeated twice. Only for the TGF-β1 antigen assay, the serum samples were treated with 1N HCL and 1N NaOH before antibody treatment. After washing, samples were incubated in streptavidin-horsedish peroxidase (HRP) conjugate and respective antibodies at room temperature for one hour with continuous shaking at 400 rpm. Samples were washed again three times. After washing, substrates were added to each well and incubated at 37°C for another 15 min. The reaction was stopped with stopping buffer. For each antigen, standards were prepared by serial dilution with ionized water. Optical densities of samples and standards were determined at 450 nm (references 620 nm) on Multiskan EX (Thermo Fisher Scientific, Uppsala, Sweden) microplate photometer. A standard curve was created by plotting the absorbance for each standard concentration on the ordinate against the concentrations of antigens used on the abscissa. A best-fit curve was drawn through the points of the graph. To determine the concentration of antigens for each sample, first we found the absorbance value on the ordinate and extended a horizontal line to the standard curve. At the point of intersection, a vertical line was extended to the abscissa and the corresponding concentration of the respective antigens was noted.
References
1. Fletcher CM. Standardised questionnaire on respiratory symptoms: A statement prepared and approved by the MRC Committee on the Aetiology of Chronic Bronchitis (MRC breathlessness score). BMJ 1960; 2: 1665.
2. Miller MR, Hankinson J, Brusasco V, Burgos F, Casaburi R, Coates A, et al. Standardisation of spirometry. Eur Respir J 2005; 26: 319-38.
3. Aggarwal AN, Gupta D, Jindal SK. Development of a simple computer program for spirometry interpretation. J Assoc Physicians India 2002; 50: 567-70.
4. Holland AE, Spruit MA, Troosters T, Puhan MA, Pepin V, Saey D, et al. An official European Respiratory Society/American Thoracic Society technical standard: Field walking tests in chronic respiratory disease. Eur Respir J 2014; 44: 1428-46.
5. Fernandes L, Mesquita AM, Vadala R, Dias A. Reference equation for six minute walk test in healthy western India population. J Clin Diagn Res 2016; 10: CC01-4.
6. Briand J, Behal H, Chenivesse C, Wémeau-Stervinou L, Wallaert B. The 1-minute sit-to-stand test to detect exercise-induced oxygen desaturation in patients with interstitial lung disease. Ther Adv Respir Dis 2018; 12: 1753466618793028.
7. Hansell DM, Bankier AA, MacMahon H, McLoud TC, Müller NL, Remy J. Fleischner Society: Glossary of terms for thoracic imaging. Radiology 2008; 246: 697-722.


