
Translate this page into:
Prognostic significance of baseline serum ferritin in newly diagnosed multiple myeloma cases: A retrospective study from southern India
For correspondence: Mrs Reshmy G.S., Department of Biochemistry, Amrita School of Medicine, Amrita Institute of Medical Sciences, Kochi 682 041, Kerala, India e-mail: reshmygs@aims.amrita.edu
-
Received: ,
Accepted: ,
Abstract
Background & objectives
Ferritin levels, crucial for iron homeostasis, may hold prognostic significance in multiple myeloma (MM) due to their responsiveness to inflammation. The objective of this study was to evaluate the prognostic significance of baseline serum ferritin levels in predicting progression-free survival (PFS) and overall survival (OS) in newly diagnosed south Indian patients with multiple myeloma.
Methods
We retrospectively analysed records of 152 newly diagnosed multiple myeloma (NDMM) patients, grouping them by ferritin levels: group 1 with low ferritin (LF) (<300 ng/ml, n=68) and group 2 with high ferritin (HF) (≥300 ng/ml, n=84). Cox Proportional Hazard Models were used to identify prognostic risk factors for PFS and OS.
Results
NDMM patients with elevated diagnostic ferritin levels exhibited significantly higher levels of creatinine (P=<0.0001), lactate dehydrogenase (LDH, P=0.005), C-reactive protein (CRP, P=0.02), erythrocyte sedimentation rate (ESR, P=0.04), rate of disease progression (P=0.002), and death (P=0.011), along with a notable decrease in albumin (P=<0.0001) and haemoglobin (P=0.04) compared to MM patients with low ferritin levels. Time-to-event analysis revealed shorter PFS (P=0.0053) and OS (P=0.014) in the HF group. Elevated ferritin independently predicted progression [HR=2.59, 95% confidence interval (CI): 1.29-5.16, P=0.006] and was associated with increased mortality risk (HR=2.93, 95% CI: 1.19-7.24, P=0.02). Hazard ratios for progression and mortality increased with an increase in ferritin levels. Ferritin showed a weak positive correlation with plasma cell per cent (r=0.122, 95% CI: -0.07-0.31). Ferritin also provided better prediction (25.8 and 32.4%) of PFS and OS than CRP (14.7 and 15.8%).
Interpretation & conclusions
High ferritin levels in multiple myeloma are linked to worse prognosis and poor outcomes, highlighting the need for further research to validate and expand these findings
Keywords
Ferritin
newly diagnosed multiple myeloma
oxidative damage
overall survival
progression-free survival

Multiple myeloma (MM) is a haematological malignancy due to the neoplasm of plasma cells. It is the second most prevalent haematological cancer1. Even with advancements in therapy, MM remains an incurable disease, with relapse being a common issue. Prognostic markers are important for understanding survival outcomes, disease progression, and therapeutic responses in MM patients. However, the heterogeneity of this disease makes this challenging, as each patient experiences different outcomes. Though many advancements have occurred in developing combination therapies to increase the survival period of MM patients, the methods for monitoring them have not progressed at the same pace. Monitoring MM requires a comprehensive approach that includes tracking the disease progression and treatment response to prevent future relapses. The present monitoring methods include serum or urine protein electrophoresis, serum free light chain (sFLC) assay, bone marrow examination, imaging studies, complete blood count (CBC), minimal residual disease (MRD) assessment, cytogenetics, and molecular testing2. Although there is a wide range of tools for monitoring myeloma, each has its limitations. For instance, tests like sFLC and M protein may fail to reflect patient disease status accurately, while on the other hand, methods like MRD, imaging, and bone marrow aspiration although accurate and precise, may be painful, invasive, or expensive3. Even if patient-specific treatments are the way of the future, there remains a lot of research interest in uncovering new biomarkers that can aid in prognosis and therapeutic decision-making for MM patients.
Various processes play a role in the multifactorial aetiology of MM, with oxidative damage being one contributing factor. Iron drives oxidative damage within cancer cells through Fenton reactions, which produce reactive hydroxyl radicals (•OH) from hydrogen peroxide (H2O2). These radicals damage DNA, proteins, and lipids, causing oxidative stress. Ferritin binds to iron, keeping it soluble and non-toxic. It delivers iron solely for cellular functions and protects the cells from the damaging effects of iron4. Previous investigations have shown ferritin as a valid marker for iron levels in the body and it thereby facilitates the assessment of the oxidative and inflammatory effects of iron4. Ferritin is an iron-storage protein and an acute-phase reactant that indicates both iron overload and inflammation. Therefore, elevated serum ferritin levels signify an underlying pathological process. A systematic review and meta-analysis conducted by Ramírez-Carmona et al5 highlighted elevated serum ferritin in cancer patients, establishing it as a biomarker for advanced tumours. Shesh et al6 detailed ferritin dysregulation in various cancers, linking it to tumour growth, resistance, angiogenesis, and immune modulation. Coffman et al4 further described ferritin’s angiogenic role, counteracting High Molecular Weight Kininogen (HKa) anti-angiogenic effects. Elevated ferritin has also been shown to be an important marker in haematological malignancies. Sadighi et al7 demonstrated that hyper-ferritinemia worsens overall and event-free survival in acute myeloid leukaemia (AML), with iron chelators improving the outcomes. Gesher et al8 also linked high serum ferritin to cancer, with strong associations in haematological, hepatobiliary, and respiratory malignancies.
Interest in ferritin’s potential as a prognostic marker in MM, a highly inflammatory haematological malignancy, has increased over the years. MM clones depend on systemic cytokines for growth and survival. Mielnik et al9 demonstrated that pro-inflammatory cytokines promote MM progression by driving angiogenesis and enhancing ferritin synthesis10, leading to iron restriction and anaemia through blocked iron release. Campanella et al11 and Rosa et al12 associated elevated ferritin in haematological malignancies with iron overload, causing oxidative stress, immune suppression, and bone marrow dysfunction. Their studies also showed that ferritin influences cytokines, disrupts erythropoiesis and iron regulation, and promotes osteoclast activity, contributing to bone resorption and bone density loss. Given its involvement in these pathological processes, ferritin may play a crucial role in MM progression by contributing to immune suppression, bone resorption, and anaemia6,13. Despite its significance, limited research has assessed ferritin as a prognostic marker for MM. Investigating serum ferritin levels could provide insights into its role in predicting disease progression and patient outcomes in MM.
A Korean study14 in 2009 highlighted the influence of ferritin on MM prognosis. In 2014, Strasser-Weippl and Ludwig15 reported that ferritin levels correlated with MM tumour burden and existing prognostic markers. In 2021, Zhang16 demonstrated that serum ferritin is a prognostic biomarker for diagnosis and relapse. A 2022 study by Dong et al13 found that MM patients with high baseline ferritin levels had a poorer prognosis, with worse progression-free survival (PFS) and overall survival (OS). Their study also suggested that ferritin enhances the prognostic value of ISS and R-ISS for OS prediction. In 2023, Plano et al17 explored ferritin’s potential as a prognostic marker in NDMM patients from Italy, identifying it as a possible therapeutic target. Despite these findings, few studies have evaluated ferritin’s prognostic significance in MM, limiting its routine clinical application. More research is needed to establish ferritin as a reliable prognostic marker and bridge this knowledge gap.
Indian studies have not yet evaluated serum ferritin’s prognostic significance in MM. Given MM’s heterogeneity and ethnic variations, prognosis may differ across populations. We therefore aimed to evaluate baseline ferritin’s role in predicting outcomes among NDMM patients including progression and mortality.
Materials & Methods
This single-centre retrospective cohort study analysed 647 consecutive MM cases from January 2013 to December 2023 at the department of Biochemistry, Amrita Institute of Medical Sciences, Kochi. Patients were selected non-randomly based on the available medical records after obtaining consent from the institutional review board.
Inclusion/exclusion criteria
As per the International Myeloma Working Group (IMWG) diagnostic criteria16, newly diagnosed MM patients were included. NDMM patients with incomplete data due to loss of follow up, other malignancies, or autoimmune diseases were excluded. Since MM is common in older adults, concomitant conditions like diabetes, hypertension, obesity, cardiovascular, renal diseases, and dyslipidaemia were not considered as the criteria for exclusion.
After applying these criteria, 332 MM patients were considered, and among them serum ferritin values were available for 152. Based on internal data, a median ferritin cut off of 300 ng/ml was used, categorising patients into group 1 (low ferritin, <300 ng/ml, n=68) and group 2 (high ferritin, ≥300 ng/ml, n=84).
Data collection
Baseline demographic data included age, gender, comorbidities, myeloma type, diagnosis date, International Staging System (ISS), induction start date, regimen type, response per IMWG criteria18, autologous stem cell transplantation (ASCT) status, maintenance regimen, relapse/progression date, death date (if applicable), and last follow up. Laboratory data included haemoglobin, calcium, creatinine, albumin, β2M, cytogenetics, plasma cell percentage, C-reactive protein (CRP), erythrocyte sedimentation rate (ESR), and lactate dehydrogenase (LDH), collected from medical records.
Ferritin was measured by ECLIA; calcium, creatinine, albumin, LDH, and haemoglobin by colorimetric methods; CRP and β2M by Immunoturbidimetric; ESR by modified Westergren; and plasma cell percentage by smear morphology.
Sample size calculation
Using survival rates of 40 per cent (low ferritin) and 17.9 per cent (high ferritin) from a prior study12, with 80 per cent power and 95 per cent confidence, the minimum required sample was 59 per group, totalling 118 patients.
Statistical analysis
Time-to-event analysis was performed using the Kaplan-Meier method to assess OS and PFS. OS was evaluated from the time of diagnosis to the date of last follow up or death from any cause, whichever occurred first. PFS was assessed from the time of diagnosis to the date of progression, death, or last follow up, whichever occurred first. Patients were censored at the last follow up date. The log-rank test was used to assess the differences between the groups. Categorical variables were expressed using frequency and percentage, and the chi-square test was used to compare variables between the patients with and without elevated ferritin levels. Continuous variables were summarised by median and interquartile range (IQR), and the Mann-Whitney U test was used to compare the variables between the two groups.
The Cox Proportional Hazards Model was used to adjust for the potential confounding factors affecting OS and PFS. The Cox Model assumes that the effects of different variables on survival are constant over time, and it can be adjusted for potential confounders. For the multivariable model for PFS, predictors were selected by forward stepwise selection with a threshold of P<0.1. Multivariable regression was not performed for OS because of the small number of events occurring. The results of the Cox proportional hazards analyses are summarised by the hazard ratio (HR), and 95 per cent confidence interval (CI). The proportional hazards assumption was verified graphically using Schoenfeld Residuals. Schoenfeld residuals were used to verify the proportional hazard assumption. Cox regression with natural cubic splines was used to visualise the survival rates depending on ferritin values. Additionally, feature selection from the confounding factors affecting PFS was performed using the Forward-Backward Early Dropping (FBED) selection regression19 method. The predictive ability of serum ferritin levels and CRP was assessed, and its predictive performance was quantified and compared using Somers’ D. Spearman rank correlation was performed to assess the relationship of ferritin with, plasma cell percentage, CRP, and ESR. A P<0.05 was considered statistically significant. Statistical analysis was performed using R Version 4.4.1 ( https://cran.r-project.org/bin/windows/base/old/4.4.1/ ).
Results
Patient demographics and baseline characteristics
The study included 152 patients with a median age of 61 yr (range: 54-68), 62.5 per cent male and 37.5 per cent female. High ferritin (HF) patients had significantly higher creatinine (P<0.0001), LDH (P=0.005), CRP (P=0.02), ESR (P=0.04), and exhibited increased disease progression (P=0.002) and mortality (P=0.011) compared to those with low ferritin. They also had lower albumin (P<0.0001) and haemoglobin (P=0.04). Patients’ characteristics and outcomes remained relatively stable over time, as shown in supplementary figure 1 and 2.
Treatment regimens
First-line induction therapy was given to all patients except two, with Velcade (Bortezomib), Cyclophosphamide, and Dexamethasone (VCD) being the predominant regimen (73.5% in group 1, 83.3% in group 2). Response to induction therapy did not significantly differ between groups (P=0.264). Twenty-eight patients underwent ASCT, and 116 received maintenance therapy, primarily with singlet regimens (66.2% in group 1 and 69% in group 2; Table I).
| Variables |
Group I (LF) Ferritin <300 ng/ml, n=68 |
Group II (HF) Ferritin ≥300 ng/ml, n=84 |
P value |
|---|---|---|---|
| Gender, n (%) | |||
| Male | 41 (60.3) | 54 (64.3) | 0.736 |
| Female | 27 (39.7) | 30 (35.7) | |
| Median age (yr) (Q1-Q3) | 61 (56.7-69) | 61.5 (53-67.25) | 0.373 |
| Type of myeloma, n (%) | |||
| IgG | 38 (55.9) | 53 (63.1) | 0.325 |
| IgA | 11 (16.2) | 07 (8.3) | |
| IgM | 01 (1.5) | 00 (0) | |
| ĸ light chain | 12 (17.6) | 14 (16.7) | |
| λ light chain | 06 (8.8) | 10 (11.9) | |
| Median calcium (mg/dl) (Q1-Q3) | 9.2 (8.69-9.7) | 9.11 (8.5-9.96) | 0.96 |
| Median creatinine (mg/dl) (Q1-Q3) | 1.11 (0.825-1.48) | 2.1 (1.04-4.995) | <0.0001 |
| Median haemoglobin (g/dl), (Q1-Q3) | 9.5 (8.1-11.8) | 8.9 (7.8-10.05) | 0.04 |
| Bone lesions, n (%) | |||
| Yes | 42 (62) | 59 (70.2) | 0.3 |
| No | 26 (38) | 25 (29.8) | |
| Median albumin(g/dl), (Q1-Q3) | 3.7 (3.4-4.2) | 3.18 (2.6-3.7) | <0.0001 |
| Median Beta2 microglobulin (mg/ml), (Q1-Q3) | 4.18 (3-6.83) | 5.45 (3.37-12.4) | 0.07 |
| Median LDH (IU/l), (Q1-Q3) | 179 (144-229) | 215 (182.5-288) | 0.005 |
| FISH myeloma panel, n (%) | |||
| High risk | 12 (17.6) | 06 (7.1) | 0.099 |
| Standard risk | 21 (30.9) | 24 (28.6) | |
| Not recorded | 35 (51.5) | 54 (64.3) | |
| ISS staging, n (%) | |||
| I | 17 (25) | 12 (14.3) | 0.335 |
| II | 17 (25) | 22 (26.2) | |
| III | 22 (32.4) | 36 (42.9) | |
| not recorded | 12 (17.6) | 14 (16.7) | |
| Median CRP(mg/L)(Q1-Q3) | 7.25 (1.68-15.27) | 14.38 (4-40.06) | 0.02 |
| MedianESR(mm/hr) (Q1, Q3) | 80 (43-97) | 92 (61-110) | 0.04 |
| Median plasma cell % (Q1, Q3) | 29 (16-45) | 34 (22-62) | 0.307 |
| Induction regimen, n (%) | |||
| VCD | 50 (73.5) | 70 (83.3) | 0.217 |
| VRD | 08 (11.8) | 09 (10.7) | |
| Others | 08 (11.8) | 05 (6) | |
| Not taken | 02 (2.9) | 00 (0) | |
| Response to induction, n (%) | |||
| ORR (CR+VGPR+PR) | 58 (85.3) | 74 (88.1) | 0.264 |
| PD | 03 (4.4) | 03 (3.6) | |
| Not recorded | 07 (10.3) | 07 (8.3) | |
| Autologous stem cell transplant, n (%) | |||
| Yes | 12 (17.6) | 16 (19) | 0.991 |
| No | 56 (82.4) | 68 (81) | |
| Maintenance regimen, n (%) | |||
| Singlet | 45 (66.2) | 58 (69) | 0.721 |
| Doublet | 05 (7.4) | 08 (9.5) | |
| LFU | 18 (26.5) | 18 (21.4) | |
| Disease progression, n (%) | |||
| Yes | 20 (29.4) | 47 (56) | 0.002 |
| No | 48 (70.6) | 37 (44) | |
| Clinical status, n (%) | |||
| Dead | 06 (8.8) | 22 (26.2) | 0.011 |
| Alive | 62 (91.2) | 62 (73.8) |
LDH, lactate dehydrogenase; ISS, international staging system; CRP, C-reactive protein; ESR, erythrocyte sedimentation rate; VCD, velcade cyclophosphamide dexamethasone; VRD, velcade revlimid dexamethasone; ORR, overall response rate; CR, complete response; VGPR, very good partial response; PR, partial response; PD, progressive disease; LFU, lost to follow up
Kaplan-Meier analysis showed significant differences in PFS and OS between the two groups. Median PFS was 108.2 months for patients with ferritin levels <300 ng/ml, compared to 40.8 months for those with ferritin ≥300 ng/ml (P=0.0053), indicating a 62 per cent shorter PFS in the HF group. OS also differed significantly between the groups (P=0.014; Fig. 1A and B). Schoenfeld residuals confirmed that the proportional hazards assumption was met (P=0.114, Supplementary Fig. 3).
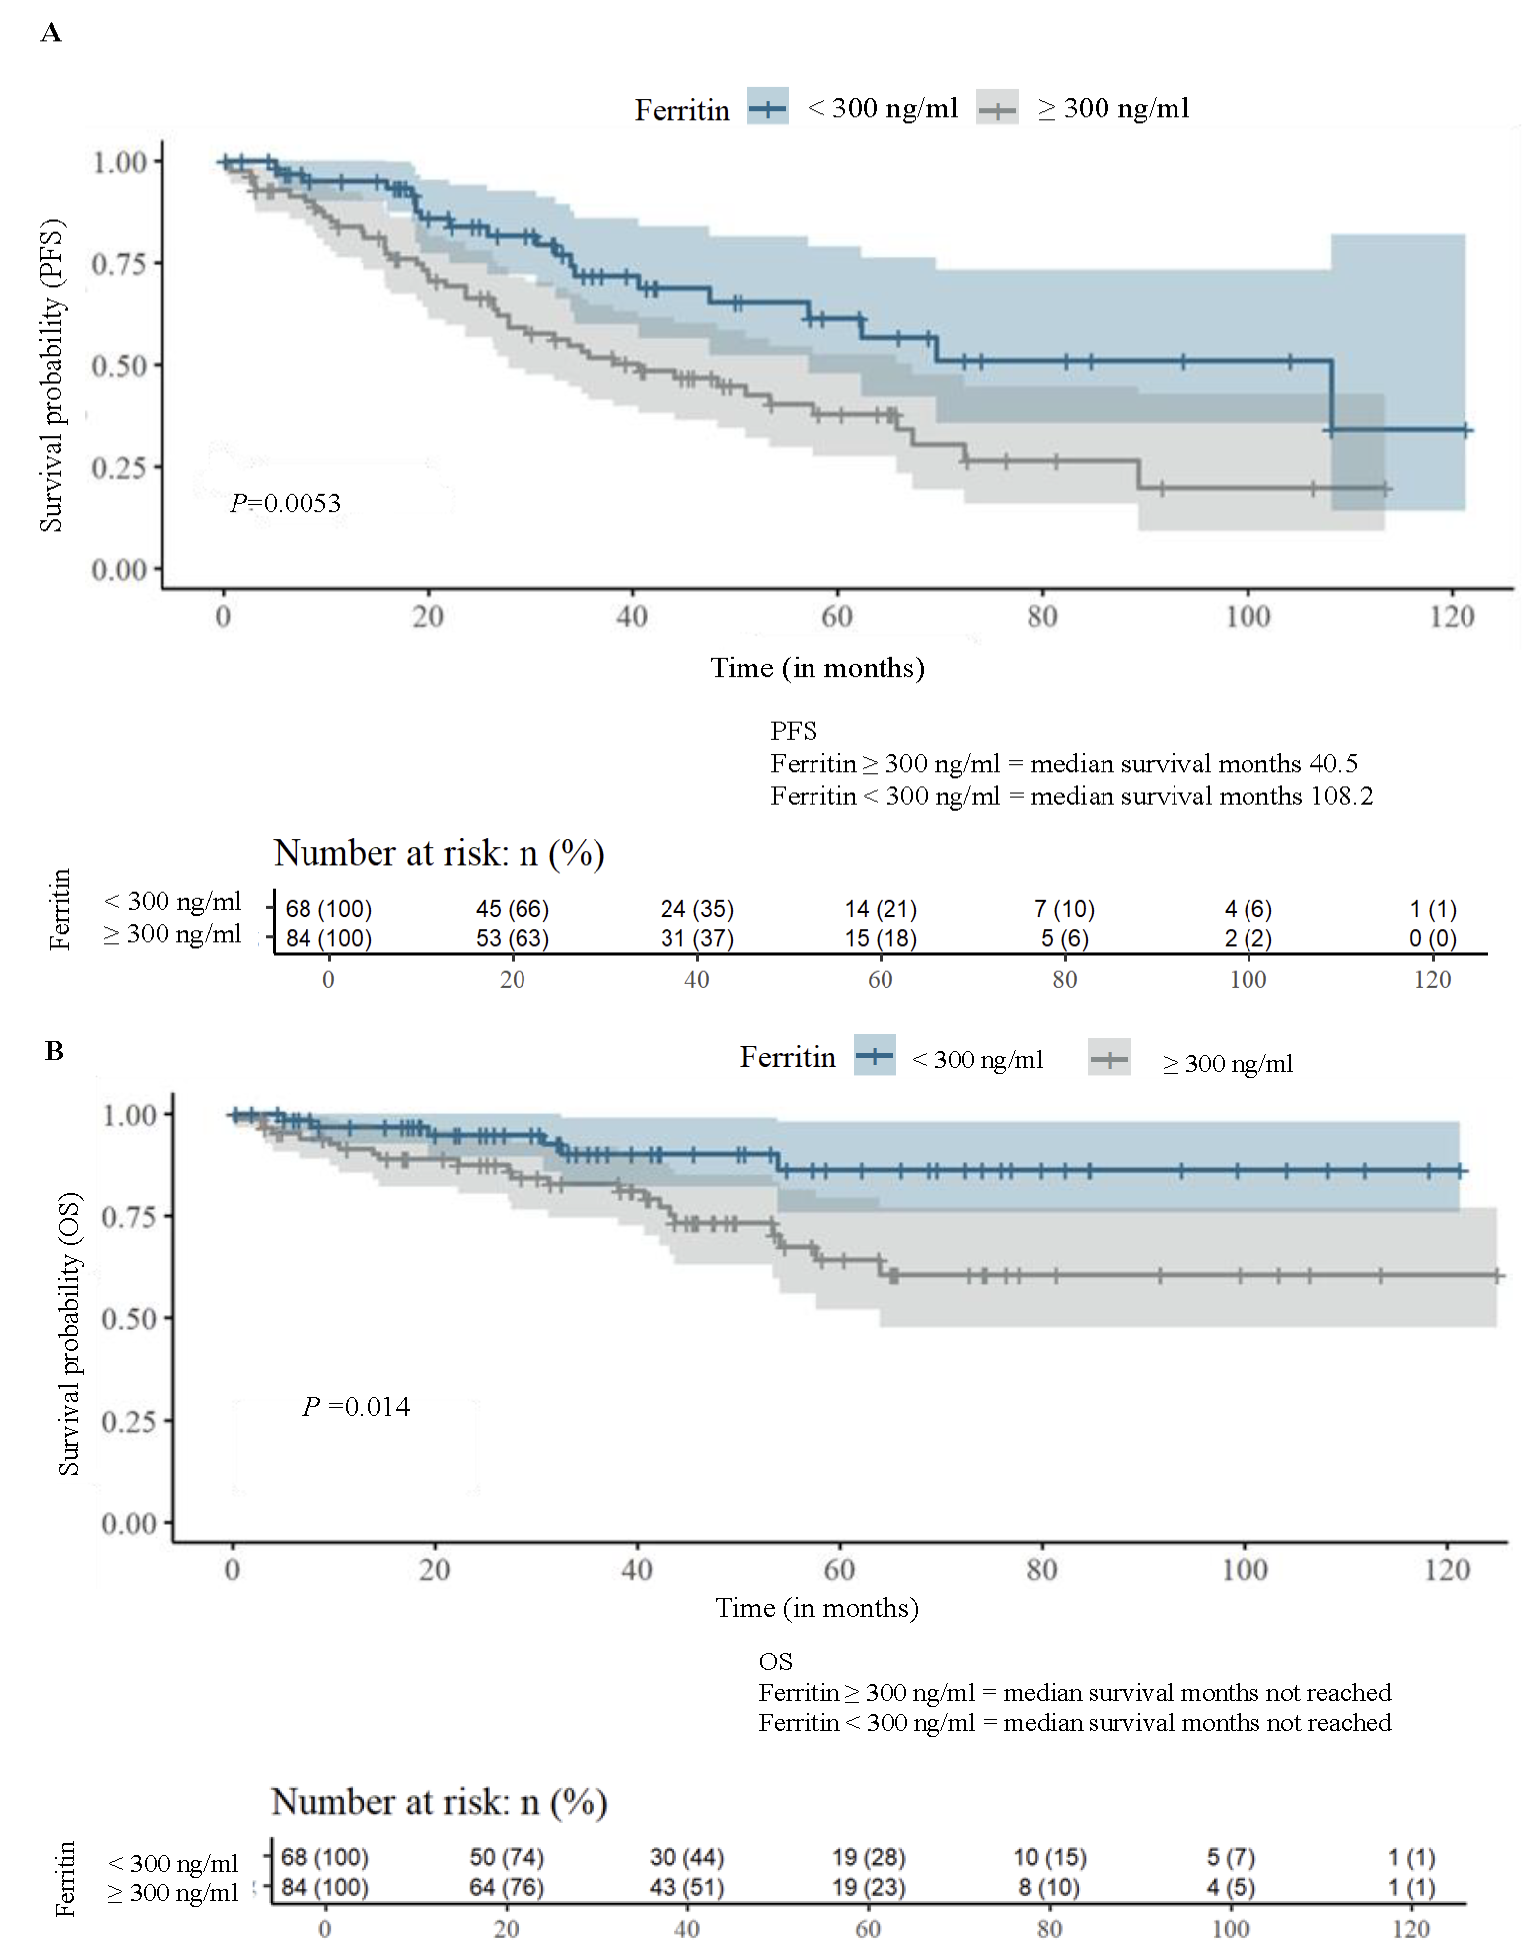
- Kaplan Meier analysis: (A) progression free survival (PFS), and (B) overall survival (OS) stratified by median ferritin value.
Cox proportional hazard analysis identified ferritin (HR=2.59, 95% CI: 1.29, 5.16, P=0.006) and plasma cell percentage (P=0.004) as independent predictors of PFS (Table II). Ferritin was also a significant predictor of OS in univariable analysis (HR=2.93, 95% CI:1.19, 7.24, P=0.02; Table III). However, multivariable analysis for OS was not done due to a small number of events (n=28). Using the Forward Backward Early Dropping (FBED) regression method, ferritin remained an independent risk factor for PFS (HR=2.08, 95% CI: 1.17, 3.7, P=0.01).
| Covariates | Comparison | Univariable | Multivariable | ||
|---|---|---|---|---|---|
| HR (95% CI) | P value | HR (95% CI) | P value | ||
| Age (yr) | ≤65 vs. >65 | 1.66 (1.00, 2.75) | 0.05 | ||
| Gender | Male vs. Female | 1.97 (1.14, 3.39) | 0.01 | 1.57 (0.81, 3.01) | 0.17 |
| Albumin (g/dl) | <3.5 vs. ≥3.5 | 1.65 (1.00, 2.72) | 0.049 | 0.75 (0.36, 1.53) | 0.43 |
| β2 Microglobulin (mg/ml) | >5.5 vs. <3.5 | 2.32 (1.19, 4.54) | 0.01 | 1.34 (0.33, 5.4) | 0.67 |
| Haemoglobin (g/dl) | ≤10 vs. >10 | 1.52 (0.87, 2.68) | 0.14 | ||
| Creatinine (mg/dl) | >2 vs. ≤2 | 1.17 (0.72, 1.91) | 0.53 | ||
| Calcium (mg/dL) | ≥11 vs. <11 | 2.00 (0.91, 4.40) | 0.08 | ||
| Bone lesion | Yes vs. No | 0.61 (0.37, 1.01) | 0.05 | ||
| LDH (U/l) | ≥248 vs. <248 | 1.37 (0.81, 2.31) | 0.24 | ||
| Ferritin (ng/ml) | ≥300 vs. <300 | 2.08 (1.23, 3.52) | 0.01 | 2.59 (1.29, 5.16) | 0.006 |
| ISS | Stage 3 vs. Stage 1 | 2.50 (1.15, 5.45) | 0.02 | 2.1 (0.41, 10.53) | 0.36 |
| FISH myeloma | High risk vs. Standard risk | 1.51 (0.57, 3.99) | 0.41 | ||
| ESR | 1.00 (0.99, 1.01) | 0.70 | |||
| CRP (mg/ml) | ≥5 vs. <5 | 1.18 (0.62, 2.26) | 0.62 | ||
| Plasma cell % | 1.01 (1.00, 1.02) | 0.02 | 1.02 (1, 1.03) | 0.004 | |
| Comorbidities | Yes vs. No | 0.81 (0.48, 1.36) | 0.42 | ||
| Covariates | Comparison | Univariable | |
|---|---|---|---|
| HR (95% CI) | P value | ||
| Age (yr) | ≤65 vs. >65 | 1.58 (0.73, 3.4) | 0.24 |
| Gender | Male vs. female | 4.20 (1.45, 12.1) | 0.01 |
| Albumin (g/dl) | <3.5 vs. ≥3.5 | 2.63 (1.14, 6.06) | 0.02 |
| β2 Microglobulin (mg/ml) | >5.5 vs. <3.5 | 7.53 (1.74, 32.56) | 0.01 |
| Haemoglobin (g/dl) | ≤10 vs. >10 | 0.93 (0.42, 2.05) | 0.85 |
| Creatinine (mg/dl) | >2 vs. ≤2 | 1.03 (0.47, 2.22) | 0.95 |
| Calcium (mg/dl) | ≥11 vs. <11 | 0.48 (0.07, 3.54) | 0.47 |
| Bone lesion | Yes vs. No | 0.91 (0.40, 2.06) | 0.82 |
| LDH (U/l) | ≥248 vs. <248 | 1.22 (0.55, 2.72) | 0.63 |
| Ferritin (ng/ml) | ≥300 vs. <300 | 2.93 (1.19, 7.24) | 0.02 |
| ISS | Stage 3 vs. Stage 1 | 9.95 (1.32, 74.85) | 0.03 |
| FISH myeloma | High risk vs. Standard risk | 1.15 (0.24, 5.43) | 0.86 |
| ESR | 1.00 (0.98, 1.01) | 0.49 | |
| CRP (mg/mL) | ≥5 vs. <5 | 1.49 (0.54, 4.1) | 0.44 |
| Plasma cell % | 1.02 (1.00, 1.04) | 0.02 | |
| Comorbidities | Yes vs. No | 0.55 (0.26,1.18) | 0.12 |
The predictive ability of ferritin was superior to CRP, with Somers’ D values showing 32.4 per cent for OS and 25.8 per cent for PFS for ferritin, compared to 15.8 per cent and 14.7 per cent for CRP. Risk analysis (Fig. 2A and B) showed a sharp increase in risk for OS with ferritin levels up to 1000 ng/ml, and for PFS up to 300 ng/ml, beyond which the increase was marginal.
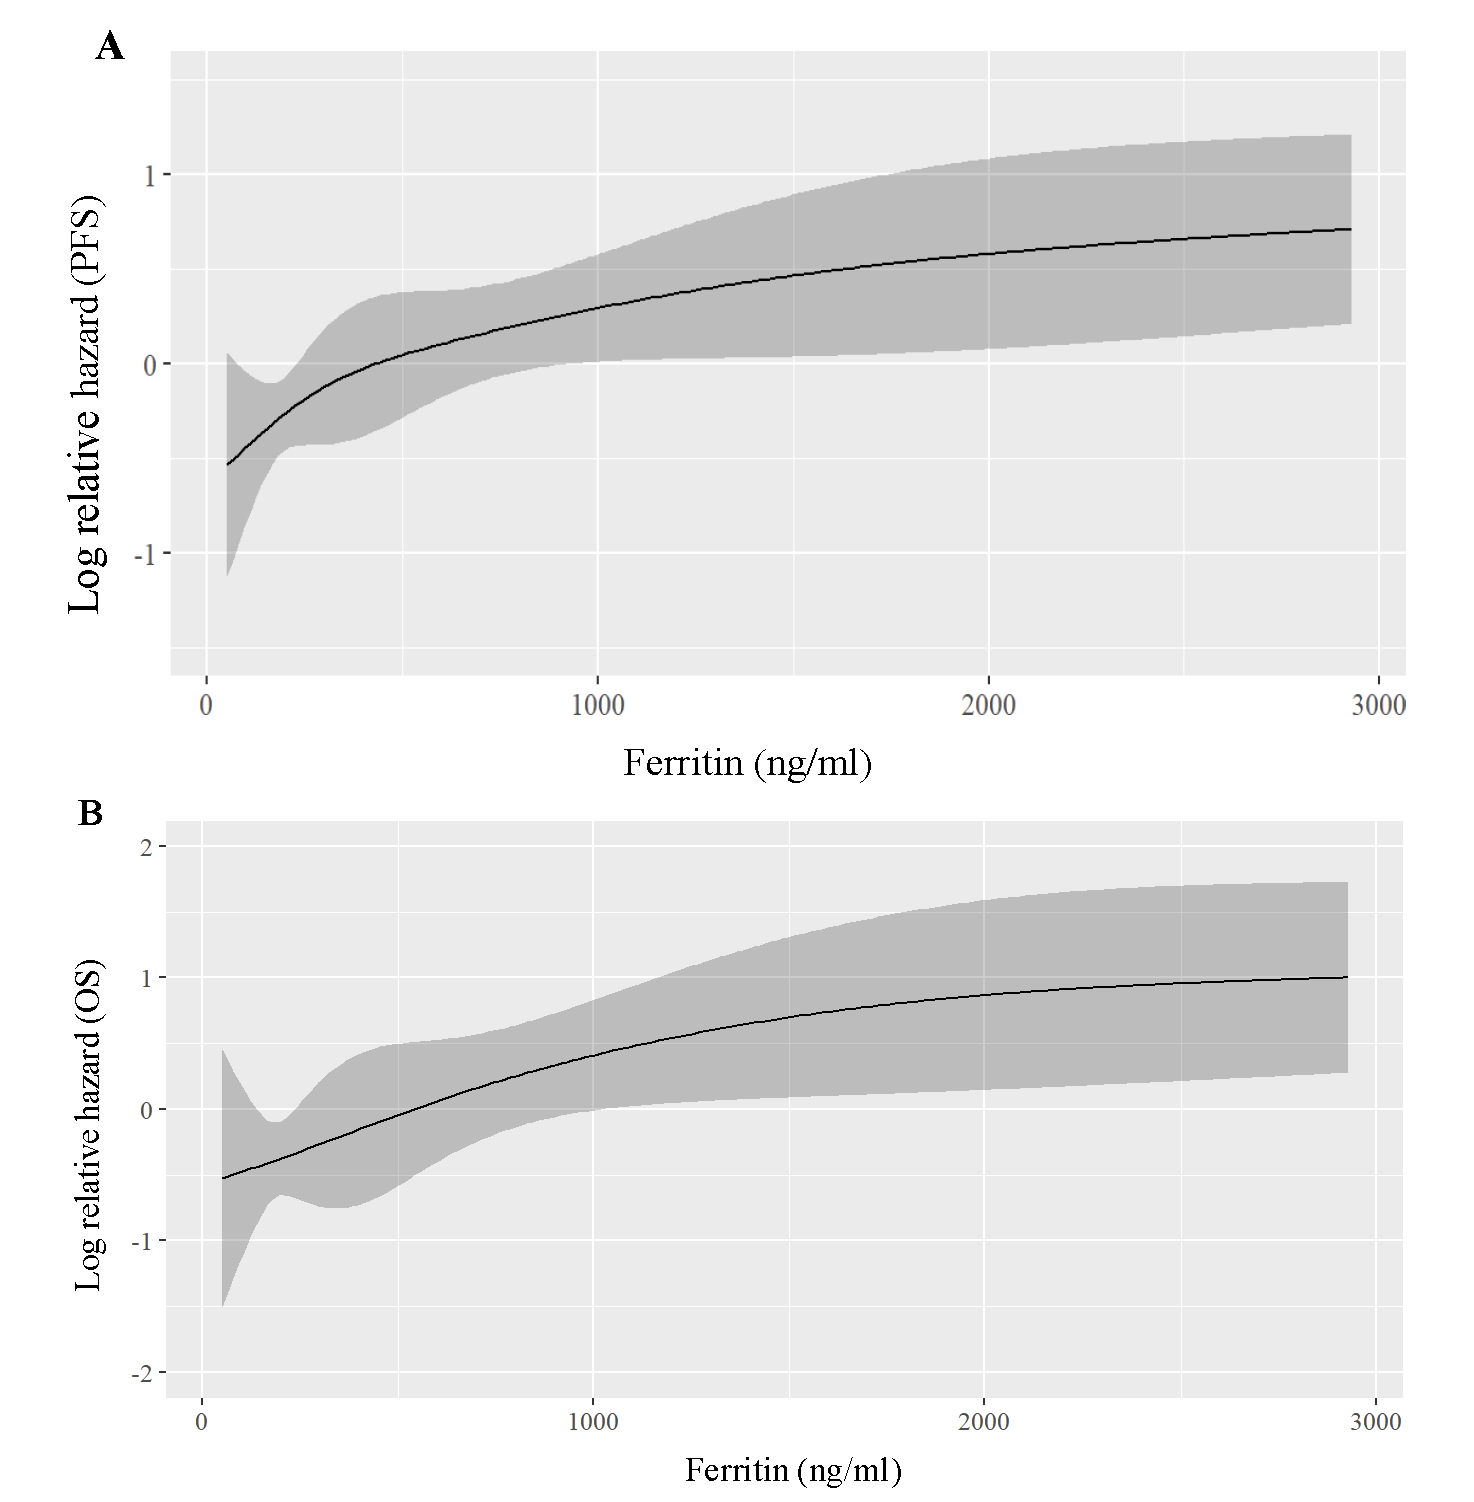
- Regression plot for hazard ratios based on ferritin levels - (A) shows relative hazard for progression-free survival (PFS), and (B) overall survival (OS).
Correlation with other markers
Ferritin levels showed weak correlations with CRP (r=0.28, 95% CI 0.09-0.48), plasma cell percentage (r=0.122, 95% CI -0.07 to 0.31), and ESR (95% r=0.145, CI -0.04 to 0.33).
Discussion
Serum ferritin level is commonly used as a biomarker for assessing iron status and diagnosing iron-related disorders such as anaemia and iron toxicity20,21. However, emerging evidence suggests that serum ferritin may serve as a prognostic marker in various pathological conditions, including inflammatory disorders, neurodegenerative diseases, and certain malignancies22. In cancer, elevated serum ferritin levels have been associated with tumour aggression, metastatic potential, and poor treatment outcomes23.
In this study, we compared the baseline characteristics of MM patients by subgrouping them as patients with ferritin <300 ng/ml (Low Ferritin - LF or group I) and patients with ≥300 ng/ml (High Ferritin - HF or group II) based on the internal data median value of ferritin (300 ng/ml) as the cutoff. However, visual inspection of the non-linear relationship between ferritin levels and survival outcomes showed that the risk for OS and PFS increased monotonously with increasing ferritin levels across a wide range of 0 to 3000 ng/ml (Fig. 2A and B). Like other studies, our investigation showed that the ferritin positively correlated with CRP, ESR, and plasma cell percentage, highlighting the role of inflammation in MM pathophysiology24,25. A similar study was reported by Plano et al17 , where HF patients had lower haemoglobin and higher creatinine, β2M, CRP, and ESR, indicating a pro-inflammatory state. Yang et al26 observed a positive correlation between ferritin, β2M, IL-6, and LDH in NDMM patients, while Shimoni et al27 linked CRP with ferritin. Based on our study and similar research, elevated serum ferritin stands out as an unfavourable marker associated with adverse myeloma characteristics and inflammation, contributing to disease progression and poor outcomes. Guo et al28 observed shorter PFS in HF patients. Additionally, in the present study, ferritin outperformed CRP in predicting survival. This is a novel finding not considered by other works from within area.
There was an interesting finding from the study done by Campanella et al11 in MM cell lines showing high ferritin levels associated with resistance to bortezomib by disrupting iron regulation and reducing ROS production. Camiolo et al29 observed that iron influences MM cell-macrophage interactions, promoting a tumour microenvironment resistant to bortezomib. The majority of patients in our study received bortezomib-based regimens (VCD), and those with high ferritin had shorter PFS and OS, suggesting a possible bortezomib resistance. However, as drug resistance was not directly analysed in our study, no definitive conclusion could be drawn.
In conclusion, the role of ferritin in MM appears multifaceted, serving as a predictive marker for risk stratification and treatment decisions. Targeting inflammation to reduce ferritin may offer a novel therapeutic strategy in MM, but larger prospective studies are needed for confirmation.
As a retrospective study, this work has inherent limitations, including potential and confounding bias. Although this was partially addressed by adjusting for potential confounders, the level of evidence from a retrospective study is inherently lower than that obtained from randomised controlled trials. Additionally, our study focused only on baseline ferritin values, which limited the dynamic monitoring of ferritin levels at different treatment time points, restricting the assessment of treatment effects on ferritin levels. Furthermore, the cut-off value for ferritin was based on internal data, as no universally accepted standard cut-off in MM exists. However, the clinical significance of this threshold over different populations is unknown. Lastly, excluding Relapsed refractory MM, Smoldering MM, and Monoclonal Gammopathy of Undetermined significance (MGUS) patients prevented comparisons of ferritin levels across these conditions, underscoring the need for prospective studies to assess ferritin’s role in treatment response and relapse detection.
Financial support & sponsorship
None.
Conflicts of Interest
None.
Use of Artificial Intelligence (AI)-Assisted Technology for manuscript preparation
The authors confirm that there was no use of AI-assisted technology for assisting in the writing of the manuscript and no images were manipulated using AI.
References
- Multiple myeloma epidemiology and survival: A unique malignancy. Semin Oncol. 2016;43:676-81.
- [Google Scholar]
- Updated diagnostic criteria and staging system for multiple myeloma. Am Soc Clin Oncol Educ Book. 2016;35:e418-23.
- [Google Scholar]
- A review of bone marrow biopsies performed at a London teaching hospital: do bone marrows aid diagnosis and at what cost? Hemasphere. 2022;6:2211-2.
- [Google Scholar]
- Regulatory effects of ferritin on angiogenesis. Proc Natl Acad Sci USA. 2009;106:570-5.
- [Google Scholar]
- Are serum ferritin levels a reliable cancer biomarker? A systematic review and meta-analysis. Nutr Cancer. 2022;74:1917-26.
- [Google Scholar]
- A novel view of ferritin in cancer. Biochem Biophys Acta Rev Cancer. 2023;1878:188917.
- [Google Scholar]
- Impact of serum ferritin and iron overload on acute myeloid leukemia outcomes: A systematic review and meta-analysis. Asian Pac J Cancer Prev. 2024;25:2951-62.
- [Google Scholar]
- Strength in numbers: Identifying a significant association between high serum ferritin levels and newly diagnosed malignancy in a large health organization cohort. Cancer Epidemiol Biomarkers Prev. 2025;34:190-6.
- [Google Scholar]
- The clinical relevance of selected cytokines in newly diagnosed multiple myeloma patients. Biomedicines. 2023;11:3012.
- [Google Scholar]
- Ferritin translation by interleukin-6: The role of sequences upstream of the start codons of the heavy and light subunit genes. J Biol Chem. 1996;271:2525-37.
- [Google Scholar]
- Iron increases the susceptibility of multiple myeloma cells to bortezomib. Haematologica. 2013;98:971-9.
- [Google Scholar]
- The iron curtain: Macrophages at the interface of systemic and microenvironmental iron metabolism and immune response in cancer. Front Immunol. 2021;12:614294.
- [Google Scholar]
- Serum ferritin increased the predictive value of the international staging system/Revised international staging system for overall survival. Blood. 2022;140:12523.
- [Google Scholar]
- Elevation of serum ferritin is associated with the outcome of patients with newly diagnosed multiple myeloma. Korean J Intern Med. 2009;24:368-73.
- [Google Scholar]
- Ferritin as a prognostic marker in multiple myeloma patients undergoing autologous transplantation. Leuk Lymphoma. 2014;55:2520-4.
- [Google Scholar]
- Dynamic monitoring of serum ferritin as an adverse prognostic biomarker in patients with multiple myeloma. Biomark Med. 2021;15:1541-5.
- [Google Scholar]
- Ferritin metabolism reflects multiple myeloma microenvironment and predicts patient outcome. Int J Mol Sci. 2023;24:8852.
- [Google Scholar]
- International Myeloma Working Group (IMWG) uniform response criteria for multiple myeloma 2020. Available from: https://www.myeloma.org/resource-library/international-myeloma-working-group-imwg-uniform-response-criteria-multiple, accessed on December 2, 2024.
- Serum ferritin is an important inflammatory disease marker, as it is mainly a leakage product from damaged cells. Metallomics. 2014;6:748-73.
- [Google Scholar]
- Altered iron metabolism and impact in cancer biology, metastasis, and immunology. Front Oncol. 2020;10:476.
- [Google Scholar]
- Key role of inflammation in myeloproliferative neoplasms: Instigator of disease initiation, progression, and symptoms. Curr Hematol Malig Rep. 2019;14:145-53.
- [Google Scholar]
- Inflammation and infection in plasma cell disorders: How pathogens shape the fate of patients. Leukemia. 2022;36:613-24.
- [Google Scholar]
- The iron chelator deferoxamine decreases myeloma cell survival. J Int Med Res. 2021;49:300060520987396.
- [Google Scholar]
- Risk stratification of patients with multiple myeloma prior to autologous stem cell transplant: What is the role of serum ferritin levels? Leuk Lymphoma. 2014;55:2419-20.
- [Google Scholar]
- Prognostic value of ferritin in ASCT MM patients: Integration with GEP models and ISS series systems. Blood Cancer J. 2024;14:30.
- [Google Scholar]
- Iron regulates myeloma cell/macrophage interaction and drives resistance to bortezomib. Redox Biol. 2020;36:101611.
- [Google Scholar]


