
Translate this page into:
Predictors of smokeless tobacco use among the adult population of north-east India during 2009-2017: A decomposition analysis
For correspondence: Dr Saritha Nair, ICMR-National Institute of Medical Statistics, Ansari Nagar, New Delhi 110 029, India e-mail: nairs@icmr.gov.in
-
Received: ,
This article was originally published by Wolters Kluwer - Medknow and was migrated to Scientific Scholar after the change of Publisher.
Abstract
Background & objectives:
Contrary to overall declining trend in smokeless tobacco (SLT) use in India, an increase is observed in north-east (NE) India. This study examined the predictors of daily SLT use by gender and assessed the demographic and socio-economic characteristics that contribute to gender differences in SLT use in NE India.
Methods:
Data collected from 15,259 and 13,574 adults in the two rounds of Global Tobacco Adult Survey 1 and 2 for NE India during 2009-2010 and 2016-2017 were analyzed. Relative change, multivariable binary logistic regression and Blinder-Oaxaca decomposition analysis were used for analysis.
Results:
The findings suggest that among women in NE India, the daily SLT use significantly increased by 58 per cent between 2009-2010 to 2016-2017. Women residing in Nagaland, Manipur, Mizoram and Tripura were 3.5 and 2.5 times, respectively more likely to be daily SLT users compared to those in Assam. While age, education and wealth were the significant predictors of SLT use in both women and men, increased odds of SLT use were observed with women’s type of occupation and the State of residence. The majority of the gender differences in daily SLT use was explained by differences in work status (44%), age (26%), education (14%) and wealth status (9%) between men and women.
Interpretation & conclusions:
Increasing prevalence of SLT use amongst women in the NE States necessitates integration of gender-specific messages on harmful effects of SLT in the ongoing tobacco control programmes and development of culturally appropriate community-based interventions for cessation of SLT use.
Keywords
Gender
GATS 1
GATS 2
north-east India States
smokeless tobacco
tribe

Smokeless tobacco (SLT) refers to an array of tobacco products that are consumed by chewing, sniffing or sticking at the corners of the oral cavity. There are an estimated 356 million SLT users in 140 countries, of which majority of the users belong to South-east Asia1. The consumption of SLT in India (21.4%) exceeds smoking (10.7%) by two fold1. Almost 200 million Indians use SLT either occasionally or daily with male and female users accounting for 29.6 and 12.8 per cent, respectively2.
SLT in India is consumed in a wide array of forms such as betel quid with tobacco, Khaini (tobacco mixture), Gutka (areca nut with tobacco lime mixture) and Gul/Mishri (tobacco powder) based on regional beliefs and cultural practices, lifestyle behaviours and unique food consumption patterns. Predictors of SLT use include lack of awareness, attempt towards smoking cessation, alleviation of anxiety, suppression of hunger, energizer for performing laborious task, accessibility and affordability of SLT products, use by peers and family and belonging to tribal population3-5.
SLT use results in oral, digestive tract, cardiovascular and reproductive tract cancer and various other morbidities3,6. The use of SLT is also known to harm the foetus7. The northeastern (NE) States have the highest incidence of certain cancers in India which has previously been linked to higher prevalence of tobacco use in the region8.
Considering the deleterious effects of tobacco, the National Tobacco Control Programme (NTCP) was initiated in 2003 by the Government of India to effectively implement and monitor tobacco control in the country9. In line with the commitment, the National Health Policy 2017 set out a target of 30 per cent relative reduction in tobacco use by 2025. While the prevalence of any form of tobacco has decreased from 34.6 to 28.6 per cent from 2009-2010 to 2016-2017, the prevalence of SLT use, however, has reportedly increased in some States2.
The Global Adult Tobacco Survey (GATS) 2 (2016-2017), India report indicates that the use of SLT in NE India has increased from 24.9 per cent (2009-2010) to 32.6 per cent (2016-2017)7; Mizoram (58.7%) had the highest users followed by Tripura (55.1%). The most consumed SLT in the NE States is the ‘betel quid’5, and the use is well integrated into customs, tribal culture and traditional practices followed in the region. Betel quid is served to guest as a sign of respect and the ‘Khasi’ tribes consider it to be a social leveller because both the rich and the poor can afford it10.
Prior studies examined SLT prevalence and its predictors at the national and sub-national levels6,7,11. A few studies that explored the predictors of use of SLT use by gender12,13 highlighted the differences in SLT use and underscored the importance of sex-disaggregated analysis for devising effective tobacco control programmes. The present study examines the predictors of daily SLT use by gender in NE India between 2009-201014 and 2016-20172 using two rounds of GATS data. In addition, the study examined the demographic and socio-economic characteristics that contribute to gender differentials in daily SLT use. Given the differences in the prevalence of SLT use between women and men, examining predictors separately may provide information to develop gender-specific tobacco control programmes in NE India.
Material & Methods
Data source: The present study used secondary data from two rounds of GATS 1 in 2009-2010 and GATS 2 in 2016-2017 for NE India consisting of Arunachal Pradesh, Assam, Manipur, Meghalaya, Mizoram, Nagaland, Sikkim and Tripura. These surveys were undertaken by the Ministry of Health and Family Welfare (MoHFW), Government of India (GoI), for monitoring adult (aged 15 yr or older) tobacco use and effectiveness of the tobacco control measures implemented during the inter-survey period. Data were collected from a total of 69,296 adults in GATS 1 (2009-2010) and 74,037 adults in GATS 2 (2016-2017) and are freely available in the public domain (https://nccd.cdc.gov/GTSSDataSurveyResources/Ancillary/DataReports.aspx?CAID=2).
Global Adult Tobacco Survey (GATS): GATS utilized a cross-sectional study design to obtain nationally representative household data. Stratified multistage clustered sampling technique was used for sample selection from urban and rural areas within each State. Further details about sampling process, inclusion and exclusion criteria have been detailed in the GATS reports2,14.
Sample size and study variable: The present study analyzed data collected from 15,259 and 13,574 adults from NE India during 2009-2010 (GATS 1) and 2016-2017 (GATS 2) respectively. The gender wise distribution of the study population by selected background characteristic for GATS 1 and GATS 2 data is provided in Supplementary Table I. The outcome variable in the present study was daily SLT use (C01: Do you currently use SLT on a daily basis, less than daily or not at all?). All respondents who consumed SLT daily were coded as 1 (daily user) and others were coded as 0 (not daily user). Predictor variables (based on the literature review) included gender (A01), age (A03) (grouped as 15-24, 25-44, 45-64 and 65+ yr); education (A04-illiterate, primary education and below, less than secondary education, secondary and senior secondary, graduate and above); occupation (A05-employed, self-employed, others that include, daily wage labour, homemakers, students, retired, unemployed, don’t know, refused); household size (HH1) (≤5; >5 members); place of residence (urban/rural); wealth quintile (poorest, second/middle, fourth, richest); NE States (Arunachal Pradesh, Assam, Manipur, Meghalaya, Mizoram, Nagaland, Sikkim and Tripura); awareness on harmful effects of tobacco (H03-yes/no).
| Background characteristics | GATS 1 (2009-2010) | GATS 2 (2016-2017) | ||
|---|---|---|---|---|
| Male, n (%) | Female, n (%) | Male, n (%) | Female, n (%) | |
| Age of the respondent (yr) | ||||
| 15-24 | 1330 (28.9) | 1886 (30.9) | 1267 (28.3) | 1365 (27.7) |
| 25-44 | 3836 (44.1) | 4281 (43.9) | 3387 (42.5) | 3572 (43.7) |
| 45-64 | 1938 (20.9) | 1382 (19.5) | 1648 (22.7) | 1547 (21.7) |
| 65+ | 326 (6.1) | 280 (5.7) | 409 (6.5) | 379 (6.9) |
| Education level | ||||
| Illiterate | 1218 (14.3) | 1882 (24.0) | 786 (14.5) | 1595 (27.7) |
| Primary education and below | 2126 (29.2) | 2212 (27.8) | 1994 (30.4) | 2055 (28.3) |
| Less than secondary education | 1397 (18.6) | 1505 (17.6) | 1409 (23.6) | 1346 (21.3) |
| Secondary and senior secondary education | 1830 (26.5) | 1694 (22.5) | 1778 (23.2) | 1359 (16.5) |
| Graduate and above | 859 (11.4) | 536 (8.2) | 744 (8.4) | 508 (6.2) |
| Occupation | ||||
| Employed (Government/NGO) | 1847 (21.0) | 621 (5.5) | 1273 (14.8) | 604 (7.6) |
| Self employed | 4015 (52.1) | 1263 (9.3) | 2273 (31.2) | 1016 (8.0) |
| Others | 1568 (27.0) | 5945 (85.2) | 3165 (54.0) | 5243 (84.4) |
| Household size | ||||
| ≤5 members | 4618 (50.3) | 4909 (53.0) | 4751 (60.7) | 4888 (61.9) |
| >5 members | 2812 (49.7) | 2920 (47.0) | 1960 (39.3) | 1975 (38.1) |
| Household asset index | ||||
| Poorest | 1326 (18.1) | 1528 (21.0) | 1833 (34.8) | 2177 (37.7) |
| Second | 964 (13.6) | 976 (12.9) | 1333 (18.9) | 1471 (19.0) |
| Middle | 1660 (22.8) | 1794 (23.7) | 1383 (19.7) | 1228 (16.5) |
| Fourth | 1597 (22.2) | 1757 (22.5) | 863 (12.3) | 873 (13.1) |
| Richest | 1883 (23.2) | 1774 (19.9) | 1299 (14.2) | 1114 (13.8) |
| Place of residence | ||||
| Urban | 1544 (19.2) | 1599 (19.1) | 1782 (21.6) | 1797 (21.5) |
| Rural | 5886 (80.8) | 6230 (80.9) | 4929 (78.4) | 5066 (78.5) |
| North-east India States | ||||
| Sikkim | 723 (1.5) | 767 (1.4) | 728 (1.5) | 688 (1.4) |
| Arunachal Pradesh | 630 (2.7) | 686 (2.9) | 658 (3.1) | 715 (3.0) |
| Nagaland | 678 (4.7) | 718 (4.5) | 792 (4.4) | 803 (4.3) |
| Manipur | 680 (5.4) | 739 (5.7) | 806 (6.3) | 813 (6.6) |
| Mizoram | 781 (2.2) | 792 (2.2) | 784 (2.4) | 782 (2.4) |
| Tripura | 677 (8.6) | 753 (8.7) | 765 (8.4) | 794 (8.4) |
| Meghalaya | 656 (5.3) | 761 (5.4) | 798 (6.0) | 784 (6.2) |
| Assam | 2605 (69.4) | 2613 (69.1) | 1380 (67.8) | 1484 (67.7) |
| SLT use | ||||
| Daily user | 2119 (29.8) | 1788 (18.5) | 1891 (36.2) | 2055 (29.3) |
| Not daily user | 5311 (70.2) | 6041 (81.5) | 4820 (63.8) | 4808 (70.7) |
| Awareness on ill effects of SLT | ||||
| Yes | 6623 (91.1) | 6663 (85.9) | 6363 (93.7) | 6463 (91.7) |
| No | 807 (8.9) | 1166 (14.1) | 348 (6.3) | 400 (8.3) |
| Total | 7430 (100.0) | 7829 (100.0) | 6711 (100.0) | 6863 (100.0) |
Per cent is weighted; n is un-weighted. NGO, non-governmental organisation; SLT, smokeless tobacco. Source: Refs 2,14
The wealth quintile variable was constructed on the basis of presence/absence of household assets (A06) such as electricity, car, scooter/motorcycle, television, refrigerator and cell/telephone (included in GATS 1 and GATS 2 India data) using principal component analysis. On the basis of the scores of component analysis, all households were categorized into five wealth quintiles (poorest/second/middle/fourth/richest).
Statistical analysis: Weighted univariate and bivariate population estimates were calculated gender wise for socio-economic and demographic characteristics and SLT-related parameters. Survey weights available in GATS 1 and 2 were used. Relative change was computed to assess the difference in the proportion of daily SLT use among men and women between the two time periods 2009-2010 (GATS 1) and 2016-2017 (GATS 2). Level of significance for relative change was tested using proportion Z test. Because both GATS rounds were similar in terms of survey framework, methodology and data collection, the data of two survey rounds were pooled to examine changes in the odds of SLT use between survey periods while adjusting for socio-economic and demographic factors. This is the advantage of pooled data by introducing new time dummy (2009-2010 and 2016-2017) as an independent variable to get the adjusted change in the odds of SLT between the two survey periods.
Multivariable binary logistic regression was used to predict the daily SLT use while adjusting for selected socio-economic, demographic and awareness related characteristics. Analysis was adjusted for time from 2009-2010 (GATS 1) and 2016-2017 (GATS 2). The adjusted odds ratio (AOR) and their 95 per cent confidence intervals (CIs) have been reported.
Blinder-Oaxaca decomposition was used to identify characteristics that contribute to the difference in daily SLT use between men and women. The observed differences in daily SLT use between women and men can be additively decomposed into characteristics (or endowments) ‘E’ component and a coefficient ‘C’ (or effects of characteristics or behavioural) component. The component ‘E’ is usually called the explained component and the ‘C’ component is usually called the unexplained component. The detailed description of Blinder-Oaxaca decomposition model is provided in Supplementary file.
The data were analyzed using STATA SE 14.0 (Stata Corp. College Station, Texas, USA).
Results
Table I illustrates gender wise relative change of daily SLT use based on background characteristics from 2009-2010 to 2016-2017 in NE India. Among women, daily SLT use relatively increased by 58 per cent from 2009-2010 (18.5%) to 2016-2017 (29.3%). Decline in daily SLT use among men in the age range of 15-24 yr from 21.2 per cent in GATS 1 survey (2009-2010) to 18.7 per cent in GATS 2 survey (2016-2017) was observed. However, among women, the prevalence of daily SLT use was observed to increase in the same age range from five per cent in 2009-2010 to nine per cent in 2016-2017. The prevalence of SLT use showed relative increase of 50 and 69 per cent among illiterate men and women from 2009-2010 to 2016-2017. Women residing in Manipur and Assam showed relative increase of 89 per cent and 94 per cent, respectively in daily SLT use from 2009-2010 to 2016-2017.
| Background characteristics | Men | Relative change++ | Women | Relative change++ | ||
|---|---|---|---|---|---|---|
| 2009-2010 GATS 1(%) | 2016-2017 GATS 2 (%) | 2009-2010 GATS 1 (%) | 2016-2017 GATS 2 (%) | |||
| Age group (yr) | ||||||
| 15-24 | 21.2 (17.6-25.3) | 18.7 (15.1-23.1) | −11.8 | 5.0 (3.7-6.8) | 9.1 (6.8-12.0) | 82.0 |
| 25-44 | 33.6 (30.5-36.8) | 44.3 (40.7-47.9) | 31.8*** | 21.9 (19.3-24.6) | 31.5 (28.6-34.5) | 43.8*** |
| 45-64 | 34.0 (30.6-37.6) | 44.4 (40.3-48.6) | 30.6*** | 28.7 (24.6-33.2) | 45.8 (40.6-51.1) | 59.6*** |
| 65 and above | 28.9 (20.4-39.4) | 31.0 (23.7-39.3) | 7.3 | 31.2 (22.9-40.9) | 44.3 (33.7-55.4) | 42.0* |
| Educational status | ||||||
| Illiterate | 29.7 (25.7-34.0) | 44.5 (37.7-51.5) | 49.8*** | 28.0 (23.9-32.5) | 47.4 (42.7-52.2) | 69.3*** |
| Primary education and below | 36.6 (33.0-40.5) | 43.1 (38.4-48.0) | 17.8** | 25.9 (22.8-29.2) | 32.7 (28.8-36.8) | 26.3* |
| Less than secondary education | 31.5 (27.0-36.4) | 37.5 (32.7-42.6) | 19.0* | 14.3 (11.8-17.3) | 17.0 (14.0-20.6) | 18.9 |
| Secondary and senior secondary education | 23.8 (20.4-27.5) | 26.1 (22.0-30.6) | 9.7 | 7.5 (5.9-9.5) | 15.4 (12.1-19.5) | 105.3* |
| Graduate and above | 23.8 (18.2-30.5) | 21.5 (16.6-27.4) | −9.7 | 5.2 (3.4-8.0) | 11.4 (8.2-15.6) | 119.2 |
| Occupation | ||||||
| Employed (Government and NGO) | 29.0 (25.6-32.8) | 36.2 (30.5-42.4) | 24.8* | 20.8 (16.5-25.8) | 28.4 (22.3-35.5) | 36.5 |
| Self-employed | 33.6 (30.7-36.7) | 40.4 (36.2-44.8) | 20.2** | 30.7 (26.7-35.1) | 35.6 (30.2-41.5) | 16.0 |
| Others+++ | 23.1 (19.5-27.2) | 33.8 (30.6-37.2) | 46.3*** | 17.1 (15.1-19.2) | 28.7 (26.2-31.4) | 67.8*** |
| Household size | ||||||
| ≤5 members | 28.3 (25.7-31.1) | 36.3 (33.9-38.9) | 28.3*** | 17.3 (15.4-19.5) | 29.7 (27.1-32.5) | 71.7*** |
| >5 members | 31.3 (28.5-34.3) | 36.1 (31.6-40.7) | 15.3* | 19.9 (17.3-22.8) | 28.6 (24.8-32.6) | 43.7*** |
| Wealth quintile | ||||||
| Poorest | 32.2 (27.8-36.9) | 43.5 (38.9-48.3) | 35.1*** | 25.5 (21.6-29.9) | 36.4 (32.5-40.4) | 42.7*** |
| Second | 33.3 (28.8-38.1) | 34.2 (29.7-39.0) | 2.7 | 22.4 (18.0-27.5) | 30.2 (25.9-34.8) | 34.8* |
| Middle | 29.1 (25.4-33.0) | 37.1 (32.3-42.3) | 27.5** | 19.0 (16.3-22.1) | 24.1 (20.3-28.3) | 26.8 |
| Fourth | 32.3 (28.5-36.3) | 29.2 (23.2-36.1) | −9.6 | 14.7 (11.6-18.5) | 25.7 (20.8-31.3) | 74.8** |
| Richest | 24.3 (20.4-28.7) | 25.7 (20.3-32.1) | 5.8 | 12.4 (10.0-15.4) | 18.3 (14.5-22.8) | 47.6 |
| Place of residence | ||||||
| Urban | 27.8 (23.0-33.3) | 26.3 (22.0-31.2) | −5.4 | 17.8 (13.7-22.8) | 27.3 (22.2-33.0) | 53.4** |
| Rural | 30.3 (27.8-32.9) | 38.9 (35.9-42.1) | 28.4*** | 18.7 (16.7-21.0) | 29.8 (27.2-32.6) | 59.4*** |
| NE India States | ||||||
| Sikkim | 18.9 (15.7-22.7) | 11.1 (8.5-14.2) | −41.3 | 10.3 (7.5-13.8) | 3.8 (2.6-5.7) | −63.1 |
| Arunachal Pradesh | 30.5 (25.4-36.1) | 40.5 (31.8-49.9) | 32.8 | 13.9 (10.1-18.7) | 20.0 (14.8-26.3) | 43.9 |
| Nagaland | 39.1 (32.9-45.7) | 23.5 (18.1-29.8) | −39.9* | 23.4 (18.7-28.7) | 25.0 (20.9-29.6) | 6.8 |
| Manipur | 23.3 (19.2-27.9) | 28.5 (24.8-32.6) | 22.3 | 19.1 (15.2-23.8) | 36.2 (32.2-40.4) | 89.5** |
| Mizoram | 27.2 (22.0-33.0) | 15.9 (13.0-19.3) | −41.5 | 44.2 (40.0-48.4) | 40.1 (35.2-45.2) | −9.3 |
| Tripura | 25.7 (21.1-31.0) | 25.7 (20.6-31.7) | 0.0 | 37.2 (32.7-41.9) | 42.9 (38.6-47.2) | 15.3 |
| Meghalaya | 13.0 (9.0-18.6) | 8.6 (5.4-13.6) | −33.8 | 25.5 (20.6-31.0) | 18.4 (13.9-24.0) | −27.8 |
| Assam | 31.8 (28.7-35.0) | 42.6 (38.9-46.4) | 34.0*** | 14.8 (12.5-17.5) | 28.7 (25.4-32.3) | 93.9*** |
| Awareness on ill effects of SLT | ||||||
| Yes | 29.6 (27.1-32.1) | 36.4 (33.8-39.1) | 23.0*** | 17.6 (15.9-19.5) | 28.3 (26.0-30.8) | 60.8*** |
| No | 32.6 (26.4-39.4) | 33.7 (25.9-42.4) | 3.4 | 24.2 (19.5-29.7) | 39.4 (30.5-49.1) | 62.8*** |
| Total | 29.8 (27.6-32.2) | 36.2 (33.6-38.9) | 21.5*** | 18.5 (16.7-20.6) | 29.3 (26.9-31.8) | 58.4*** |
P *<0.05, **<0.01, ***<0.001. Relative change level of significance (P) based on proportion test. ++The relative change (or per cent change) for survey years 2009-2010 (r2009-2010) and 2016-2017 (r2016-2017) was calculated by: (r2016-2017-r2009-2010/r2009-2010), as a per cent; +++‘Others’ = homemaker, daily wage worker, unemployed, retired, students, don’t know, refused. SLT, smokeless tobacco; NE; north-east; NGO, non-governmental organisation. Source: Refs 2, 14
The multivariable logistic regression analysis examining the factors associated with daily SLT use presents similar results for men and women, except for the respondent’s occupation and State of residence (Table II). The odds of daily SLT use among men (AOR: 1.30; 95% CI: 1.07-1.58) and women (AOR: 1.75; 95% CI: 1.44-2.13) were higher in 2016-2017 as compared to 2009-2010. The likelihood of SLT use increased with an increase in age among both men and women. In particular, the odds of SLT use was six times higher among women aged 45-64 yr (5.89; 4.45-7.79) than those aged 15-24 yr. With an increase in education level, the SLT use decreased. For example, men and women with graduation (and above) level of education were 37 and 80 per cent less likely to use SLT when compared to illiterate respondents. Among women, the odds of using SLT was higher among self-employed (1.30; 1.07-1.58) compared to others (majorly homemakers). The odds of SLT use was higher among women residing in Mizoram (3.57; 2.80-4.55), Manipur (1.64; 1.30-2.07), Nagaland (1.46; 1.30-2.07) and Tripura (2.50; 2.00-3.12) than those living in Assam. On the contrary, men living in these States were less likely to use SLT compared to those living in Assam.
| Background characteristics | Men | Women | ||
|---|---|---|---|---|
| AOR | CI | AOR | CI | |
| Age group (yr) | ||||
| 15-24 | Ref. | - | Ref. | - |
| 25-44 | 2.73*** | 2.19-3.40 | 4.34*** | 3.44-5.46 |
| 45-64 | 2.66*** | 2.10-3.37 | 5.89*** | 4.45-7.79 |
| 65 and above | 1.63** | 1.14-2.31 | 4.89*** | 3.31-7.23 |
| Educational status | ||||
| Illiterate | Ref. | - | Ref. | - |
| Primary and below | 1.30* | 1.04-1.62 | 0.82* | 0.69-0.98 |
| Less than secondary | 1.17 | 0.91-1.50 | 0.46*** | 0.36-0.59 |
| Secondary and senior secondary | 0.79* | 0.62-1.00 | 0.35*** | 0.27-0.46 |
| Graduate and above | 0.63** | 0.45-0.88 | 0.19*** | 0.13-0.27 |
| Occupation | ||||
| Others | Ref. | - | Ref. | - |
| Employed (Government and NGO) | 1.00 | 0.81-1.25 | 1.39* | 1.07-1.79 |
| Self-employed | 1.01 | 0.85-1.21 | 1.30** | 1.07-1.58 |
| Household size | ||||
| ≤5 members | Ref. | - | Ref. | - |
| >5 members | 1.13 | 0.98-1.30 | 1.12 | 0.96-1.32 |
| Wealth quintile | ||||
| Richest | Ref. | - | Ref. | - |
| Poorest | 1.32* | 1.02-1.72 | 1.63*** | 1.25-2.13 |
| Poorer | 1.16 | 0.90-1.48 | 1.31 | 0.96-1.78 |
| Middle | 1.17 | 0.92-1.50 | 1.08 | 0.84-1.39 |
| Richer | 1.16 | 0.93-1.45 | 1.20 | 0.91-1.57 |
| Residence | ||||
| Urban | Ref. | - | Ref. | - |
| Rural | 1.14 | 0.90-1.43 | 0.90 | 0.71-1.15 |
| NE India States | ||||
| Assam | Ref. | Ref. | ||
| Sikkim | 0.32*** | 0.26-0.40 | 0.26*** | 0.19-0.35 |
| Arunachal Pradesh | 1.01 | 0.76-1.34 | 0.71* | 0.52-0.98 |
| Nagaland | 0.85 | 0.65-1.11 | 1.46** | 1.12-1.90 |
| Manipur | 0.65*** | 0.53-0.79 | 1.64*** | 1.30-2.07 |
| Mizoram | 0.47*** | 0.37-0.61 | 3.57*** | 2.80-4.55 |
| Tripura | 0.54*** | 0.42-0.68 | 2.50*** | 2.00-3.12 |
| Meghalaya | 0.18*** | 0.13-0.26 | 0.93 | 0.70-1.22 |
| Awareness on ill effects of SLT | ||||
| No | Ref. | - | Ref. | - |
| Yes | 1.14 | 0.88-1.47 | 0.81 | 0.62-1.05 |
| Data-point | ||||
| 2009-2010 (GATS 1) | Ref. | - | Ref. | - |
| 2016-2017 (GATS 2) | 1.30** | 1.07-1.58 | 1.75*** | 1.44-2.13 |
| Constant | 0.16*** | 0.10-0.25 | 0.08*** | 0.05-0.13 |
| Observations | 14,141 | 14,692 | ||
++Daily SLT use: 1: Yes; 0: No (ref.); P *<0.05; ** <0.01; *** <0.001. Analysis was adjusted for time from GATS 1 and GATS 2. Ref., reference category; AOR, adjusted odds ration; CI, confidence interval; NE, north-east. Source: Refs 2,14
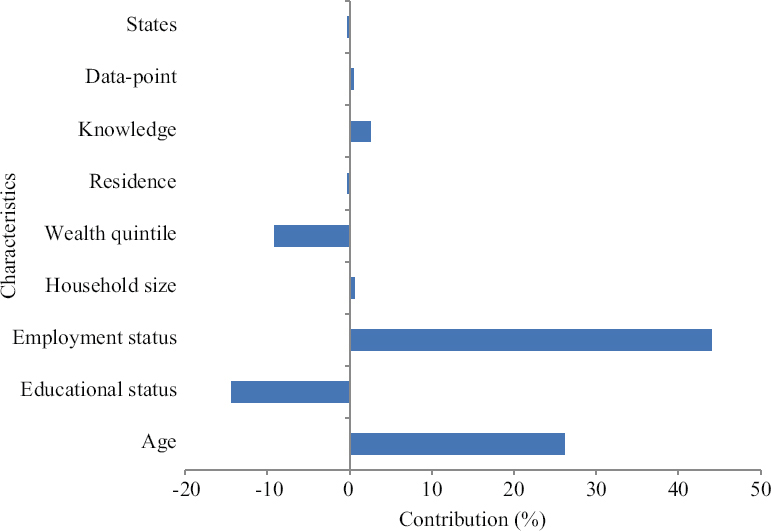
Decomposition of differences in daily SLT use between men and women: Results of decomposition analysis conducted to identify characteristics that contributed to differences in daily use of SLT between men and women in NE India (Table III) showed that the differences in distribution of demographic and socio-economic characteristics (E) predicting use of SLT amongst men and women explained half of the observed difference while the differences due to coefficients (C) or the unexplained component made up for the remaining. Among the demographic and socio-economic characteristics that contributed to the difference in daily SLT use between men and women, the majority of the difference was explained by differences in employment status (44%) followed by age (26%), education (14%) and wealth status (9%) of men and women (Fig. 1). Coming to the effect differences due to coefficients (C) or the unexplained component, the effect of education and the state, in which men and women SLT users resided, were important factors that contributed to differences in daily SLT use between men and women (Fig. 2). The detailed decomposition analysis is provided in Supplementary Table II.
| Smokeless tobacco daily use | Coefficients | P>|z| | 95% CI | Pct | |
|---|---|---|---|---|---|
| E (difference in distribution of characteristics) | 0.011 | 0.007 | 0.003 | 0.019 | 49.978 |
| C (difference in coefficients) | 0.011 | 0.085 | −0.002 | 0.024 | 50.022 |
| R (raw difference) | 0.022 | 0.000 | 0.012 | 0.032 | |
CI, confidence interval; Pct, percentage contribution. Source: Refs 2,14

| Characteristic | Due to difference in characteristics E | Due to difference in coefficients C | ||||||||
|---|---|---|---|---|---|---|---|---|---|---|
| Coefficients | P | 95% CI | Pct | Coefficients | P | 95% CI | Pct | |||
| Northeastern States | ||||||||||
| Assam | Ref. | Ref. | ||||||||
| Sikkim | −0.001 | 0.000 | −0.001 | −0.001 | −3.010 | 0.0014 | 0.1520 | −0.0005 | 0.0033 | 6.4007 |
| Arunachal Pradesh | 0.000 | 0.802 | 0.000 | 0.000 | −0.067 | 0.0024 | 0.0340 | 0.0002 | 0.0046 | 10.7530 |
| Nagaland | 0.000 | 0.589 | 0.000 | 0.000 | 0.014 | −0.0016 | 0.0780 | −0.0033 | 0.0002 | −7.1654 |
| Manipur | 0.000 | 0.001 | 0.000 | 0.000 | 0.118 | −0.0055 | 0.0130 | −0.0098 | −0.0012 | −25.0500 |
| Mizoram | 0.000 | 0.000 | −0.001 | 0.000 | −1.899 | −0.0123 | 0.0100 | −0.0217 | −0.0029 | −55.8990 |
| Tripura | 0.000 | 0.000 | 0.000 | 0.000 | 1.378 | −0.0100 | 0.0110 | −0.0177 | −0.0023 | −45.3790 |
| Meghalaya | 0.001 | 0.000 | 0.001 | 0.001 | 3.231 | −0.0107 | 0.0120 | −0.0191 | −0.0023 | −48.7530 |
| Age group | ||||||||||
| 15-24 | Ref. | Ref. | ||||||||
| 25-44 | −0.004 | 0.000 | −0.005 | −0.004 | −18.472 | −0.0121 | 0.0170 | −0.0220 | −0.0022 | −55.0750 |
| 45-64 | 0.009 | 0.000 | 0.008 | 0.010 | 40.908 | −0.0063 | 0.0160 | −0.0114 | −0.0012 | −28.6860 |
| 65 and above | 0.001 | 0.000 | 0.001 | 0.001 | 3.730 | −0.0010 | 0.0790 | −0.0022 | 0.0001 | −4.6221 |
| Education | ||||||||||
| Illiterate | Ref. | Ref. | ||||||||
| Primary and below | 0.000 | 0.000 | 0.000 | 0.000 | 0.216 | 0.0069 | 0.0210 | 0.0011 | 0.0127 | 31.1740 |
| Less than secondary | 0.000 | 0.001 | 0.000 | 0.000 | 0.993 | 0.0072 | 0.0140 | 0.0015 | 0.0130 | 32.7620 |
| Secondary and senior secondary | −0.001 | 0.445 | −0.002 | 0.001 | −2.408 | 0.0072 | 0.0150 | 0.0014 | 0.0130 | 32.7430 |
| Graduate and above | −0.003 | 0.000 | −0.004 | −0.001 | −13.104 | 0.0035 | 0.0150 | 0.0007 | 0.0063 | 15.9080 |
| Occupation | ||||||||||
| Employed (Government and NGO) | Ref. | Ref. | ||||||||
| Self employed | −0.001 | 0.827 | −0.007 | 0.005 | −3.064 | 0.0003 | 0.8000 | −0.0023 | 0.0018 | −1.2182 |
| Others | 0.010 | 0.045 | 0.000 | 0.020 | 47.078 | 0.0054 | 0.3560 | −0.0060 | 0.0168 | 24.4610 |
| Household size | ||||||||||
| ≤5 members | Ref. | Ref. | ||||||||
| >5 members | 0.000 | 0.000 | 0.000 | 0.000 | 0.586 | 0.0004 | 0.7350 | −0.0030 | 0.0021 | −1.9940 |
| Wealth quintile | ||||||||||
| Poorest | Ref. | Ref. | ||||||||
| Poorer | 0.000 | 0.120 | 0.000 | 0.000 | 0.362 | 0.0006 | 0.5210 | −0.0013 | 0.0025 | 2.8157 |
| Middle | 0.000 | 0.068 | 0.000 | 0.000 | −0.935 | 0.0017 | 0.2020 | −0.0009 | 0.0042 | 7.5626 |
| Richer | 0.000 | 0.014 | 0.000 | 0.000 | 0.757 | 0.0009 | 0.4520 | −0.0014 | 0.0032 | 4.0183 |
| Richest | −0.002 | 0.000 | −0.003 | −0.001 | −9.306 | −0.0006 | 0.6570 | −0.0032 | 0.0020 | −2.7128 |
| Place of residence | ||||||||||
| Urban | Ref. | Ref. | ||||||||
| Rural | 0.000 | 0.306 | 0.000 | 0.000 | −0.193 | 0.0021 | 0.5680 | −0.0052 | 0.0095 | 9.7001 |
| Awareness on ill effects of SLT | ||||||||||
| Yes | Ref. | Ref. | ||||||||
| No | 0.001 | 0.111 | 0.000 | 0.001 | 2.590 | −0.0012 | 0.1300 | −0.0028 | 0.0004 | −5.5914 |
| Data-point | ||||||||||
| GATS 1 (2009-2010) | Ref. | Ref. | ||||||||
| GATS 2 (2016-2017) | 0.000 | 0.093 | 0.000 | 0.000 | 0.476 | −0.0076 | 0.0330 | −0.0146 | −0.0006 | −34.4820 |
| Constant | 0.0414 | 0.0390 | 0.0021 | 0.0808 | 188.3500 | |||||
PCT, per cent contribution, Ref., reference category; NGO, non-governmental organisation; GATS, Global Adult Tobacco Survey; SLT, smokeless tobacco. Source: Refs 2,14
Discussion
Analysis of GATS 1 and 2 indicates a decrease in the use of SLT among both women and men in Sikkim, Mizoram and Meghalaya during 2016-2017 compared to that in 2009-2010. Despite the deleterious effects of SLT products on women’s health, an increase in use is observed across all age groups of women in Assam, Arunachal Pradesh, Manipur, Tripura and Nagaland. Cultural practices and norms10,15, higher prevalence of any form of tobacco in the region16 and unregulated market particularly for unpackaged tobacco17 could be the reasons for increased prevalence of use among women in these States. While an effective NTCP may have contributed to the overall reductions in the use of SLT1, findings necessitate deliberate inclusion of gender-sensitive tobacco control messages and campaigns in the NE States’ tobacco control programmes for prevention of tobacco use among women6,18,19.
The current study found that the majority of the predictors of SLT use, viz. age, wealth, education, occupation and place of residence, remained the same for both women and men during the two study periods, viz. 2009-2010 and 2016-2017. Consistent with a previous study11, SLT use in both women and men was found to increase with age, and higher odds were observed among women. Cumulative ill effects of tobacco on non-communicable diseases (NCDs) including cognitive impairment are noted among elderly who used SLT20. In the wake of growing burden of NCDs among older adults, the GoI has established the National Programme for Prevention and Control of Cancers, Diabetes, Cardiovascular Diseases and Stroke21 for screening of risk factors for NCDs (including tobacco) and their treatment. Tobacco control activities in the NE India should leverage this opportunity to address the dual burden of tobacco and NCDs.
Prevalence of SLT use was found to decrease with increased years of formal education for both women and men. Illiterate women were at higher odds of use of SLT. Education is likely to increase awareness about the harmful consequences of SLT use and thus prevent initiation or discontinue usage3,22. As noted by a previous study23, easy availability of inexpensive packaged and unpackaged SLT4,24 may have contributed to use among adults in the poorer wealth quintile. In view of the increasing SLT use among women in this region, and unregulated market, qualitative studies would help explore the role of tobacco industry in promoting use of SLT among vulnerable women (illiterate and from poorer wealth quintile) in NE India and also analyze marketing tactics used so as to suggest intervention strategies.
Unlike, for men, the use of SLT was significantly higher among women who were self-employed. The majority of women workforce in the NE India are engaged in unorganized sector25 and those in the unorganized sector may not adhere to regulations laid by the tobacco control policy. In NE States, in particular Assam, Arunachal Pradesh, Manipur and Nagaland, tobacco control programmes should take cognisance of this and expand their outreach to women in the unorganized sectors and communities with culturally appropriate messages and campaigns condoning practices that endorse tobacco use6,26,27. Types of tobacco used by women in the State, language and socio-cultural differences should be considered while developing such interventions for prevention of initiation of use as well as quitting SLT by women. For sustainability of such efforts, women should be invited to be part of the development and implementation of these tobacco control activities18.
Tobacco control programmes in the region should widely use social media and traditional communication modes to disseminate information on tobacco cessation clinics and quit helplines set up under the NTCP9. Innovative and sensitive strategies for reaching women users, particularly those in the age group of 45-64 yr, may be devised to improve coverage of women in tobacco cessation clinics28. Delivery of culturally sensitive tobacco cessation services at NCD clinics29 and workplaces can play a crucial role in sustaining cessation attempts. In addition, screening for use of any form of tobacco may be mandated in routine healthcare as advices to quit by health professionals/counsellors have been found to be effective30. Researchers have indicated that the current time could be considered an opportune moment as many tobacco users have refrained from using tobacco in the wake of COVID-19 pandemic31. This was in part due to fear of tobacco’s potential link with COVID-19 morbidity and non-availability of SLT products as a result of stricter enforcement of tobacco control (such as banning sale of SLT products and spitting in public) during nationwide lockdowns imposed as public health measures to curtail spread of COVID-19 pandemic in the country.
Existing policies such as Cigarettes and Other Tobacco Products Prohibition of Advertisement and Regulation of Trade and Commerce, Production, Supply and Distribution Act, 200332 are more restrictive against smoked tobacco. The need for stringent enforcement for SLT products1 has been recommended. Given the proximity of NE States to international borders17, this will have a greater impact in the region.
The current study has certain limitations. Data on the use of SLT are based on self-reporting and may have reporting bias. In addition, use of cross-sectional data may have limited inference of a causal relationship between daily SLT use and sociodemographic factors by gender. The study lacks the deeper qualitative insights underlying differences in SLT use between women and men. However, the strength of the study lies in the analysis of predictors of SLT use by gender during 2009-2017 using two rounds of GATS data for NE India and the application of decomposition analysis for examining factors contributing to gender differences in daily SLT use between women and men. Evidence generated endorses the demand for integration of socio-cultural and gender differences in SLT prevention intervention including tobacco control polices in India.
Financial support & sponsorship: This paper is part of the study, ‘Development and pilot testing of intervention strategies for smokeless tobacco and areca nut cessation amongst tribal women in Manipur’ funded by the Indian Council of Medical Research, New Delhi.
Conflicts of Interest: None.
References
- Smokeless tobacco control in India:Policy review and lessons for high-burden countries. BMJ Glob Health. 2020;5:e002367.
- [Google Scholar]
- Smokeless tobacco and public health in India. New Delhi: MoHFW, GoI; 2016.
- Availability, accessibility and promotion of smokeless tobacco in a low-income area of Mumbai. Tob Control. 2013;22:324-30.
- [Google Scholar]
- Geographical variation on smokeless tobacco consumption among male and female in northeast states, India. Int J Humanit Soc Sci Invent. 2016;5:36-42.
- [Google Scholar]
- White paper on smokeless tobacco &women's health in India. Indian J Med Res. 2020;151:513-21.
- [Google Scholar]
- Declining trend of smoking and smokeless tobacco in India:A decomposition analysis. PLoS One. 2021;16:e0247226.
- [Google Scholar]
- Cancer statistics, 2020:Report from National Cancer Registry Programme, India. JCO Glob Oncol. 2020;6:1063-75.
- [Google Scholar]
- Changing pattern of tobacco consumption and quitting behavior in Northeast India. J Subst Use. 2021;26:614-25.
- [Google Scholar]
- Gender-based tobacco policies in Bangladesh and India:A prerequisite to counter the smokeless tobacco epidemic. Women Health. 2019;59:85-100.
- [Google Scholar]
- Disparities in smokeless tobacco use in Bangladesh, India, and Pakistan:findings from the global adult tobacco survey, 2014-2017. PLoS One. 2021;16:e0250144.
- [Google Scholar]
- Smokeless tobacco use among women in northeastern states, India:A study of spatial clustering and its determinants using National Family Health Survey-4 data. Clin Epidemiol Glob Health. 2021;12:100840.
- [Google Scholar]
- Dual burden of smoked and smokeless tobacco use in India, 2009-2017:A repeated cross-sectional analysis based on global adult tobacco survey. Nicotine Tob Res. 2020;22:2196-202.
- [Google Scholar]
- The market for Bidis, smokeless tobacco, and cigarettes in India:Evidence from semi-urban and rural areas in five states. Int J Public Health. 2021;66:1604005.
- [Google Scholar]
- Gender, women, and the future of tobacco control. Drugs Alcohol Today. 2020;20:249-62.
- [Google Scholar]
- Declining trends in smokeless tobacco use among Indian women:Findings from global adult tobacco survey I and II. BMC Public Health. 2021;21:2047.
- [Google Scholar]
- Relationship between chewing tobacco, smoking, consuming alcohol and cognitive impairment among older adults in India:A cross-sectional study. BMC Geriatr. 2021;21:85.
- [Google Scholar]
- Pattern and predictors of tobacco use in India:Evidence from National Family Health Survey (|y2015–2016) J Health Manag. 2019;21:510-24.
- [Google Scholar]
- Prevalence and predictors of tobacco use among currently married pregnant women in India. Popul Med. 2021;3:11.
- [Google Scholar]
- Associations between tobacco marketing and use among urban youth in India. Am J Health Behav. 2008;32:283-94.
- [Google Scholar]
- Female workforce participation in north-eastern region:An overview. Int J Humanit Soc Sci Stud. 2015;1:154-60.
- [Google Scholar]
- Need for gender focused policies addressing smokeless tobacco use among women in India:A review. Asian Pac J Cancer Prev. 2021;22:7-12.
- [Google Scholar]
- Introducing tobacco free workplace policy in workplaces in India-challenges and learning. Tob Induc Dis. 2018;16((Suppl 1)):A865.
- [Google Scholar]
- Initiating tobacco cessation services in India:Challenges and opportunities. WHO South East Asia J Public Health. 2012;1:159-68.
- [Google Scholar]
- Using non-communicable disease clinics for tobacco cessation:A promising perspective. Natl Med J India. 2018;31:172-5.
- [Google Scholar]
- Assessing the readiness to integrate tobacco control in medical curriculum:Experiences from five medical colleges in Southern India. Natl Med J India. 2013;26:18-23.
- [Google Scholar]
- COVID-19 pandemic:An opportunity for tobacco use cessation. Lancet Public Health. 2020;5:e577.
- [Google Scholar]
Supplementary Files
Description of Blinder–Oaxaca decomposition analysis
The aim of the decomposition analysis was to identify characteristics that contributed to the differences in daily smokeless tobacco (SLT) use of men and women. The decomposition analysis has two contribution effects namely characteristics differences (endowments or differences due to factors associated with use of SLT) ‘E’ and the effects of characteristics leading to the difference in the coefficients ‘C’. The observed differences in daily SLT use between women and men thus can be additively decomposed into characteristics (or endowments) component and a coefficient (or effects of characteristics) component.
In the non-linear model, the dependent variable is a function of a linear combination of predictors and regression coefficients:
Y = F(Xβ) = logit (Y) = Xβ, where Y denotes the n*1 dependent variable vector, X denotes n*K matrix of independent variables and β denotes K*1 vector of coefficients.
The proportion difference in Y between male A and female B of daily SLT can be decomposed as:
YA – YB = F(XA – YB) = F(XAβA) – F(XBβB)
For the log odds of daily SLT, the proportion of the model is written as:
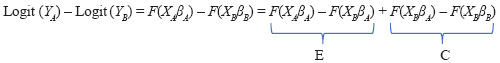
The component ‘E’ is the difference attributable to endowment change, usually called the explained component. The ‘C’ component is the difference attributable to coefficient (behavioural) change, usually called the unexplained component.
The model structure for the decomposition analysis was:
Logit (A) – Logit (B) = [β0A – β0B] + Σ βijA[XijA – XijB + Σ XijB [βijA – βijB], where
(i) β0A is the intercept in the regression equation for male
(ii) β0B is the intercept in the regression equation for female
(iii) βijA is the coefficient of the jth category of the ith predictor for male
(iv) βijB is the coefficient of the jth category of the ith predictor for female
(v) XijA is the proportion of the jth category of the ith predictor for male
(vi) XijB is the proportion of the jth category of the ith predictor for female.


