
Translate this page into:
Normative data for paediatric lymphocyte subsets: A pilot study from western India
For correspondence: Dr Manisha Madkaikar, Indian Council of Medical Research - National Institute of Immunohaematology, 13th-Floor New Multistorey Building, KEM Hospital, Parel, Mumbai 400 012, Maharashtra, India e-mail: madkaikarmanisha@gmail.com
-
Received: ,
This article was originally published by Wolters Kluwer - Medknow and was migrated to Scientific Scholar after the change of Publisher.
Abstract
Background & objectives:
Accurate diagnosis of immunodeficiencies requires a critical comparison of values with age-matched controls. In India, the existing reference values for rare lymphocyte subsets are currently not available and we rely on the data originating from other countries for the interpretation of the results. Furthermore, there is limited information on normal variation for these rare-subset parameters in Indian children. So, this study aimed to establish normative values for clinically important lymphocyte subsets in Indian children at different age groups.
Methods:
148 children aged ≥16 yr were enrolled in this study. The study population included 61 per cent males and 39 per cent females and was divided into the following groups: cord blood (n=18), 0-6 months (n=9), 6-12 months (n=13), 1-2 yr (n=19), 2-5 yr (n=27), 5-10 yr (n=25) and 10-16 yr (n=37). The absolute and relative percentage of lymphocytes, T, B, natural killer cell, along with activated, naïve and memory subsets, was determined by flow cytometry.
Results:
Median values and the 10th and 90th percentiles were obtained for 34 lymphocyte sub-populations. The T and B naïve compartments showed a decreasing trend, whereas memory cells showed an increase with age. The activated T cell subset shows an increasing pattern up to one year and then declines gradually. Double negative T cells are relatively stable. TCRgd+T cell percentage increases with age.
Interpretation & conclusions:
This single-centre pilot study provides preliminary data that justifies the need for future large-scale multi centric studies to generate a reference range for interpreting extended immunophenotyping profiles in the paediatric age group, making it possible for clinicians to assess the immunological status in inborn errors of immunity, infectious and autoimmune diseases.
Keywords
Children
flow cytometry
lymphocyte subset
pilot study
primary immunodeficiency

Flow cytometry functions as a rapid and efficacious technique for quantifying different leukocyte subsets, predominantly lymphocytes, along with the evaluation of expressed proteins. This method holds paramount significance in the diagnosis of inborn errors of immunity (IEI), as well as the assessment of immunological status in infectious and autoimmune diseases1. The age of presentation varies from infancy to late adulthood2. The patients with IEI present with recurrent infections or immune dysregulation2. There has been an exponential increase in the diagnosis of novel IEI in the last decade, leading to a better prognosis and management of these cases2. One of the initial steps in the diagnostic workup for patients with IEI includes peripheral blood immunophenotyping. Still, reliable age-wise reference values for rare lymphocyte subpopulations are limited3,4.
Clinical decision-making of immune deficiencies relies on measurable deviations of the patient’s values from normal, and this mainly depends on the availability of the reference ranges4. Flow cytometric age-related reference ranges of major lymphocyte subsets are available from various ethnicities5-7. Sub-characterization of these subsets is usually not performed as a part of routine standard phenotyping despite available knowledge regarding associations between lymphocyte subsets with certain disease states8. With the advent of a multicolour flow cytometer and a wide range of fluorescent-conjugated antibodies, sub-characterization of cells has become easier.
While data on the prevalence of IEI are lacking in India, it is speculated that India may have nearly one million patients with IEI9,10. Although reference ranges for lymphocytes are available for healthy adults11-13 and children14, there is a paucity of data for the rare subsets in the Indian population. This study presents paediatric age-matched reference values for lymphocyte subsets and some T and B cell subpopulations using the dual-platform method, which are essential for cell maturation and activations (both percentage and absolute count). This will provide a guideline for interpreting the immunophenotype as part of the diagnostic process for IEI and other immune diseases such as HIV and for immune monitoring in infectious diseases such as coronavirus disease (COVID)-19 and other autoimmune diseases.
Material & Methods
This pilot study was undertaken at the department of Paediatric Immunology and Leukocyte Biology, ICMR-National Institute of Immunohaematology (NIIH), Mumbai, India. The study was approved by the Institutional Ethics Committee of ICMR-NIIH, B J Wadia hospital for children and Nowrosjee Wadia Maternity Hospital.
Study population: A total of 148 healthy children, 0-16 years of age were recruited for the study between January 2018 to February 2021 (details in
Exclusion criteria were a history of previous sibling death, fever, rash, diarrhoea, recurrent cold, cough, blood transfusion and any medicine or steroids during the past one month or any history of chronic diseases such as tuberculosis, asthma, diabetes and atopic dermatitis.
For the CB sample, babies with normal birth weight and full term delivery were included. Family history of early sibling death, consanguinity of parents, newborn factors such as baby fever, jaundice, anaemia, low APGAR at birth and signs of sepsis were excluded from the study. Maternal factors such as illness in the mother during the last trimester, fever, history of diabetes, hypothyroidism, toxaemia, preterm, gestation prolonged rupture of membrane and recent illness in parents were excluded. The study population was 61 per cent males and 39 per cent females and was divided age wise into groups: CB (n=18), 0-6 months (n=9), 6-12 months (n=13), 1-2 yr (n=19), 2-5 yr (n=27), 5-10 yr (n=25) and10-16 yr (n=37).
Sample preparation: Whole blood (3 ml) was collected in EDTA vials by venipuncture and processed within 24-36 h of collection. The absolute lymphocyte number was determined from whole blood using Sysmex Haematology analyzer XS-800i (Sysmex Co., Cobe, Japan). The whole blood sample was used for flow cytometry analysis.
Immunophenotyping/multicolour staining & analysis: Immunohenotyping was carried out on 10-color Navios Ex (Beckman Coulter, FL,USA) flowcytometer or 13- colour Dxflex (Beckman Coulter) flowcytometer. The acquisition was run until 50,000 CD3+T cells and 10,000 CD19+B cells were detected. Kaluza analysis software V2.1 (Beckman Coulter) was used for data analysis.
Multicolor flow cytometry was utilized for the identification of B, T, and natural killer (NK) cells along with their distinct subsets (details in Supplementary Table I). Singlet gating strategy was applied to eliminate aggregates, and scatter gates were defined specifically for lymphocytes. The lymphocyte population was discerned from the sample by employing forward scatter and side scatter (SS) gating. Furthermore, this lymphocyte population, characterized by low forward and SS values, was evaluated for its purity through CD45 positivity analysis. Immunophenotype markers identified subsequent lymphocyte subpopulations. At certain fluorochrome, dual markers were combined due to their mutually exclusive presentation, i.e. one B cell and another T cell (e.g. CD8 with IgD and CD19 with TCRgd), while CD16 and CD56 were used to detect NK cells1.
| Subset | Anchor marker | CD subset measured |
|---|---|---|
| T cell | CD45 | CD3+ |
| NK cell | CD45 | CD3−CD16+CD56+ |
| B cell | CD45 | CD3−CD19+ |
| Th cell | CD45 | CD3+CD4+ |
| Tc cell | CD45 | CD3+CD8+ |
| Th Naïve cell (CD27) | CD4 | CD27+CD45RA+ |
| Th RTE | CD4 | CD31+CD45RA+ |
| CM Th cell (CD27) | CD4 | CD27+CD45RA− |
| EM Th cell (CD27) | CD4 | CD27−CD45RA− |
| TEMRA Th cell (CD27) | CD4 | CD27−CD45RA+ |
| Tc Naïve cell (CD27) | CD8 | CD27+CD45RA+ |
| CM Tc cell (CD27) | CD8 | CD27+CD45RA− |
| EM Tc cell (CD27) | CD8 | CD27−CD45RA− |
| TEMRA Tc cell (CD27) | CD8 | CD27−CD45RA+ |
| Tc RTE | CD8 | CD31+CD45RA+ |
| RTE on Th Naïve | CD4 | CD31+CD45RA+CD62L+ |
| RTE on Tc Naïve | CD8 | CD31+CD45RA+CD62L+ |
| Total memory B cell | CD19 | CD27+ |
| Class switch memory B cell | CD19 | CD27+IgM−IgD− |
| Unswitched memory B cell | CD19 | CD27+IgM+IgD+ |
| IgM only memory B cell | CD19 | CD27+IgM+IgD− |
| Naïve B cells | CD19 | CD27−IgD+ |
| Pre-GC B cells | CD19 | CD27−IgD+IgM+ |
| Double negative B cell | CD19 | CD27−IGD− |
| DNT on Lymphs | CD45 | CD3+CD4−CD8− |
| DPT on Lymphs | CD45 | CD3+CD4+CD8+ |
| DNT ab+T | CD3 | CD3+CD4−CD8−TCRgd−/TCRab+ |
| DNT gd+T | CD3 | CD3+CD4−CD8−TCRgd+ |
| gd- T/ab+T | CD3 | TCRgd− |
| gd+T | CD3 | TCRgd+ |
| NKT | CD45 | CD3+CD16+CD56+ |
| HLADR+Th cell | CD3 | CD4+HLADR+ |
| HLADR+Tc cell | CD3 | CD8+HLADR+ |
| HLADR+T cell | CD3 | HLADR+ |
| HLADR+NK cell | CD16/CD56 | HLADR+ |
| HLADR+45RA OF DNTgd-T | CD3 | CD3+CD4−CD8−TCRgd−HLADR+CD45RA+ |
| Th Naïve cell (CD62L) | CD4 | CD62L+CD45RA+ |
| CM Th cell (CD62L) | CD4 | CD62L+CD45RA− |
| EM Th cell (CD62L) | CD4 | CD62L−CD45RA− |
| TEMRA Th cell (CD62L) | CD4 | CD62L−CD45RA+ |
| Tc Naïve cell (CD62L) | CD8 | CD62L+CD45RA+ |
| CM Tc cell (CD62L) | CD8 | CD62L+CD45RA− |
| EM Tc cell (CD62L) | CD8 | CD62L−CD45RA− |
| TEMRA Tc cell (CD62L) | CD8 | CD62L−CD45RA+ |
| gd+T of Lymphs | CD45 | CD3+TCRgd+ |
TEMRA, terminally differentiated effector memory re-expressing CD45RA; CM, central memory; EM, effector memory; DNT, double negative T; NK, natural killer; gd, gamma delta; Tc, T cytotoxic; Th, T helper; HLADR, human leukocyte antigen DR
To assess the cell composition, the wash-stain-lyse-wash method was used15. Briefly, 200 μl of whole blood was washed twice with phosphate-buffered saline (PBS). The cells were incubated in dark for 20 min at room temperature with a mixture of optimally titrated monoclonal antibodies (details in Supplementary Table II), followed by lysis using Optilyse C™ (Beckman coulter) for 10 min. After washing once with PBS, the cells were acquired on DxFlex or Navios Ex Beckman Coulter) flow cytometer and analyzed using Kaluza v2.1 data analysis software (Beckman Coulter). The determination of absolute subset cell counts was achieved through a dual platform approach involving the multiplication of the subset proportion acquired via flow cytometry and the absolute lymphocyte count as assessed using a 5 part haematology analyzer (Sysmex Co.,Cobe, Japan).
| Cell type | Antibody | Fluorochrome | Clone | Maker |
|---|---|---|---|---|
| General lymphocyte population | CD45 | APCH7 | J3-119 | BC |
| CD16+CD56 | PE | 3G8+N901 | BD+BC | |
| CD19 | PC7 | 2D1 | BD | |
| CD3 | APC | UCHT1 | BC | |
| T cell subpopulation | CD4 | PERCP Cy5.5 | SK-3 | BD |
| CD8 | FITC | SK-1 | BC | |
| CD27 | ECD | IA4CD27 | BD | |
| TCRgd | PC7 | IMMU-510 | BC | |
| HLADR | PACIFIC BLUE | IMMU-357 | BC | |
| CD45RA | BV510 | H100 | BD | |
| B cell subpopulation | IgD | FITC | IA6-2 | BIOLEGEND |
| CD27 | ECD | IA4CD27 | BC | |
| IgM | PERCP Cy5.5 | MHM-88 | BIOLEGEND | |
| RTE | CD31 | FITC | 5.6E. | BC |
| CD45RA | PE | ALB11 | BC | |
| CD3 | ECD | UCHT1 | BC | |
| CD4 | PC7 | SFCI12T4D11 | BC | |
| CD62L | APC | DREG-56 | BD | |
| CD8 | APC750 | B9.11 | BC |
RTE, recent thymic emigrants; HLADR, human leukocyte antigen DR
Quality control: Machine daily quality check was ensured using quality control beads for DxFlex (Beckman coulter) using Cytoflex beads and Navios Ex (Beckman Coulter) using the Flow-Check fluorospheres. Quality control was run according to the manufacturer’s instructions and standard laboratory protocol. Levey-Jennings chart was prepared using Kaluza analysis software and half peak CV for all parameters were plotted, which was within the acceptable limits (±2 standard deviation), ensuring reliability and accuracy of the machine.
Statistical analysis: The number of participants in different age groups varied from nine to 37 (n=148). Data analysis used the GraphPad Prism software, version 9.1 (GraphPad Prism, CA, USA), RStudio- V1.4 (R Core Team, Vienna, Austria) and Microsoft Excel (Microsoft Office 2010, USA). For each cell population, the normal range was defined based on the median, as well as the 10th and 90th percentiles of the cell frequencies. Each variable was analysed in both absolute number as well as percentage. Differences between study groups (age) were assessed by the Kruskal-Wallis test followed by Dunn’s multivariate comparison. The P<0.05 was considered significant. An unpaired t test was used to compare subsets of helper and cytotoxic T (Tc) cells to test the difference between CD62L and CD27.
Results
An immunophenotyping platform was established to explore the variation in immune system composition. This platform utilizes flow cytometry to quantitatively assess over 34 discrete immunological attributes, with specific emphasis on subsets within the adaptive immune system The median along with 10th-90th percentiles of absolute and relative size for different age groups are shown in Tables I and II, respectively. Significant variation was observed among different age groups. Figures 1 and 2 show the gating strategy for lymphocyte sub-populations. Using this gating strategy, age-related reference values for relative percentage and absolute lymphocyte subset counts of 148 healthy individuals among seven different age groups were calculated. The values are represented as box plots with median, p10, p25, p75 and p90 percentile in Figures 3 and 4.
| Absolute count/age | CB (n=18) | 0-6 months (n=9) | 6-12 months (n=13) | 1-2 yr (n=19) | 2-5 yr (n=27) | 5-10 yr (n=25) | 10-16 yr (n=37) | |
|---|---|---|---|---|---|---|---|---|
| Lymphocytes*** | 3627 | 6013y,x | 6029u | 5210r,t,q | 4226o | 3108 | 3087 | |
| 2809-5917 | 3744-8637 | 3537-8294 | 3182-7410 | 3048-6752 | 2258-4781 | 2038-4113 | ||
| NK cell | 250 | 338 | 297 | 342 | 325 | 258 | 238 | |
| 69-1412 | 220-779 | 84-1237 | 144-565 | 130-636 | 90-679 | 110-437 | ||
| T cell*** | 2423 | 4321 | 3952u,t | 3642r,q | 2744o | 2300 | 2291 | |
| 1889-4764 | 2617-5380 | 2252-5788 | 2105-5460 | 2087-4899 | 1639-3388 | 1390-3008 | ||
| Th cell*** | 1637δ,% | 2802y,x | 2274u,t | 2090r,q | 1463o | 1109 | 1168 | |
| 1060-3558 | 1336-3327 | 1207-4013 | 1154-3460 | 1001-2535 | 805-1855 | 659-1547 | ||
| Tc cell*** | 707#,$,^ | 1010 | 1315t | 1185q | 1057 | 856 | 841 | |
| 451-1346 | 618-1778 | 548-1930 | 781-1692 | 562-1809 | 508-1257 | 471-1242 | ||
| Th Naive cell (CD27)*** | 1445δ,% | 2619>,y,x | 1797u,t | 1552r,q | 1057 | 825 | 644 | |
| 1001-3329 | 993-3086 | 758-2992 | 816-2509 | 711-1844 | 416-1462 | 325-1208 | ||
| Th RTE*** | 1297δ,% | 1905y,x | 1625u,t | 1375r,q | 806o | 570 | 459 | |
| 842-2911 | 766-2563 | 593-2977 | 701-2388 | 522-1456 | 342-1126 | 227-860 | ||
| CM Th cell (CD27)*** | 128#,$,^,δ,% | 285 | 293 | 351 | 300 | 283 | 337 | |
| 57-290 | 195-363 | 196-605 | 195-753 | 215-580 | 151-420 | 172-511 | ||
| EM Th cell (CD27)*** | 1@,$,^,δ,% | 35 | 25t | 37q | 38o | 49 | 76 | |
| 0-4 | 7-84 | 11-95 | 9-126 | 17-87 | 23-148 | 49-155 | ||
| TEMRA Th cell (CD27)*** | 0$,^,δ,% | 14x | 9t | 8 | 4 | 39 | 21 | |
| 0-1 | 1-56 | 1-157 | 1-218 | 1-29 | 4-131 | 3-103 | ||
| Tc Naive cell (CD27)*** | 624 | 869x | 773 | 757q | 790p,o | 537 | 414 | |
| 418-1206 | 434-1135 | 410-1223 | 437-1185 | 456-1293 | 306-844 | 244-829 | ||
| Tc RTE*** | 658 | 816 | 899t | 779q | 753o | 615.5 | 471 | |
| 435-1229 | 391-1088 | 447-1379 | 516-1289 | 422-1265 | 312-870 | 273-855 | ||
| CM Tc cell (CD27)*** | 58@,$,^,δ,% | 167 | 133 | 161 | 110 | 122 | 142 | |
| 22-115 | 73-320 | 38-417 | 46-352 | 53-349 | 40-242 | 51-245 | ||
| EM Tc cell (CD27)*** | 0@,#,$,^,δ,% | 31 | 23 | 19 | 12 | 16 | 26 | |
| 0-1 | 1-180 | 1-223 | 3-76 | 2-114 | 5-117 | 9-103 | ||
| TEMRA Tc cell (CD27)*** | 0@,#,$,^,δ,% | 72 | 112 | 133 | 65 | 131 | 108 | |
| 0-4 | 1-346 | 3-962 | 8-306 | 5-424 | 21-301 | 25-378 | ||
| RTE on Th Naive*** | 1251δ,% | 1473y,x | 1564u,t | 1277r,q | 749o | 495 | 445 | |
| 822-2720 | 776-2186 | 582-2605 | 676-1879 | 476-1314 | 281.5-1022 | 204-812 | ||
| RTE on Tc Naive*** | 646% | 744x | 686t | 703q | 698p | 468.5 | 385 | |
| 412-1136 | 345-908 | 326-1122 | 438-1126 | 379-1080 | 273-782 | 186-596 | ||
| B cell*** | 628@,#,$ | 1912y,x | 1405u,t | 1124r,q | 815p,o | 440 | 556 | |
| 255-972 | 240-2636 | 715-2531 | 718-2007 | 510-1662 | 286-924 | 273-813 | ||
| Total memory B cell*** | 15#,$,^,δ,% | 81>,z | 134 | 170q | 168 | 106 | 116 | |
| 7-38 | 13-139 | 43-406 | 66-267 | 64-253 | 46-225 | 26-175 | ||
| Class switch memory B cell*** | 0#,$,^,δ,% | 10 | 37 | 78 | 51 | 41 | 53 | |
| 0-1 | 2-70 | 12-331 | 25-160 | 25-106 | 15-90 | 11-113 | ||
| Unswitched memory B cell*** | 14^ | 39 | 33t | 38q | 35o | 23 | 13 | |
| 7-32 | 06-69 | 13-161 | 6-99 | 7-93 | 5-69 | 02-31 | ||
| IgM only memory B cell*** | 0#,$,^,δ,% | 4 | 6 | 6 | 5 | 3 | 5 | |
| 0-0 | 0-5 | 3-17 | 2-21 | 01-19 | 1-11 | 1-17 | ||
| Naive B cells*** | 595 | 1701y,x | 1254u,t | 963r,q | 659o | 314 | 391 | |
| 240-923 | 222-2512 | 638-2137 | 547-1811 | 342-1428 | 193-764 | 195-658 | ||
| Pre-GC B cells*** | 575δ,% | 786y,x | 542u,t | 542 r,q | 379o | 170 | 75 | |
| 238-903 | 132-2464 | 410-1847 | 69-906 | 98-908 | 52-554 | 23-407 | ||
| Double negative B cell | 0 | 1 | 1 | 1 | 1 | 1 | 1 | |
| 0-1 | 0-2 | 0-2 | 0-1 | 0-1 | 0-2 | 0-1 | ||
| CD4-CD8-DNT on Lymphs*** | 72#,$,^,δ,% | 129 | 215 | 187 | 232 | 148 | 165 | |
| 30-168 | 77-355 | 68-288 | 116-356 | 112-402 | 111-406 | 81-375 | ||
| CD4+CD8+DPT on Lymphs*** | 45 | 80y,x | 53 | 35 | 37 | 24 | 25 | |
| 15-113 | 28-461 | 11-146 | 17-114 | 13-116 | 15-57 | 13-80 | ||
| DNT gd-ab+T*** | 26#,$,^ | 51 | 59 | 88r,q | 85p,o | 45 | 40 | |
| 14-56 | 17-149 | 30-105 | 42-137 | 48-125 | 30-90 | 26-65 | ||
| DNT gd+T*** | 74.5#,$,^,δ,% | 121 | 253 | 209 | 234 | 182 | 165 | |
| 25-167 | 76-205 | 66-441 | 128-348 | 126-470 | 84-467 | 67-359 | ||
| TCR gd-ab+T*** | 2370 | 4143y,x | 3617u,t | 3204r,q | 2556o | 2086 | 2004 | |
| 1819-4662 | 2226-4835 | 2157-5516 | 1946-4883 | 1875-4537 | 1484-2923 | 1297-2694 | ||
| TCR gd+T*** | 68@,#,$,^,δ,% | 191 | 246 | 206 | 241 | 189 | 189 | |
| 26-174 | 119-545 | 73-558 | 135-340 | 133-406 | 97-390 | 64-353 | ||
| NKT | 259 | 338 | 444 | 359 | 380o | 361 | 224 | |
| 141-622 | 145-841 | 134-1328 | 173-924 | 89-1180 | 203-778 | 71-516 | ||
| HLADR+Th cellv | 7@,#,$,^,δ,% | 45 | 53 | 35 | 26.5 | 31 | 38.5 | |
| 2-24 | 32-120 | 22-76 | 16-117 | 17-97 | 17-64 | 13-67 | ||
| HLADR+Tc cell*** | 3@,#,$,^,δ,% | 142 | 101 | 108 | 41.5 | 50 | 50 | |
| 1-8 | 13-295 | 14-263 | 21-209 | 14-195 | 20-124 | 9-139 | ||
| HLADR+T cell*** | 14.5@,#,$,^,δ,% | 281 | 194 | 182 | 85 | 90 | 106 | |
| 6-34 | 62-585 | 57-403 | 48-391 | 38-287 | 55-201 | 38-200 | ||
| HLADR+NK cell* | 19@,$ | 66 | 39 | 53 | 39 | 36 | 30 | |
| 3-450 | 19-199 | 22-89 | 20-102 | 16-118 | 13-92 | 13-50 | ||
| HLADR+45RA of DNTgd-T*** | 1#,$,^, | 4 | 4 | 4 | 4 | 2 | 2 | |
| 0-3 | 0-6 | 02-13 | 0-7 | 0-7 | 1-5 | 1-3 | ||
| Th Naive cell (CD62L)*** | 1503δ,% | 2177z,y,x | 1811u,t | 1578r,q | 957o | 632 | 564 | *** |
| 944-3371 | 875-2896 | 793-3181 | 791-2812 | 627-1570 | 388-1268 | 285-995 | ||
| CM Th cell (CD62L)*** | 114@,#,$,^,δ,% | 337 | 233 | 303 | 192 | 199 | 268 | |
| 28-178 | 50-465 | 100-468 | 146-494 | 104-477 | 83-342 | 152-447 | ||
| EM Th cell (CD62L)*** | 40.5#,$,^,δ,% | 129 | 142 | 154 | 212 | 153 | 201 | |
| 12-102 | 0-474 | 28-312 | 85-341 | 66-337 | 74-256 | 77-314 | ||
| TEMRA Th cell (CD62L)* | 56.5 | 25 | 49 | 66 | 30 | 72.5n | 17 | |
| 14-146 | 2-418 | 11-381 | 7-460 | 1-324 | 8-236 | 7-72 | ||
| Tc Naive cell (CD62L) | 656% | 823x | 754t | 821q | 791o | 633.5 | 470 | |
| 419-1146 | 369-1169 | 374-1307 | 506-1243 | 405-1233 | 301-991 | 230-653 | ||
| CM Tc cell (CD62L) | 28$,^,% | 78 | 50 | 92 | 97 | 46 | 93 | |
| 6-79 | 29-393 | 17-236 | 28-309 | 24-238 | 10-253 | 18-218 | ||
| EM Tc cell (CD62L) | 2,#,$,^,δ,% | 24 | 60 | 63 | 34 | 101 | 69 | |
| 0-13 | 7-198 | 11-364 | 12-269 | 12-327 | 11-297 | 22-242 | ||
| TEMRA Tc cell (CD62L) | 12#,$,% | 52 | 84 | 113 | 76 | 29 | 136 | |
| 0-113 | 8-279 | 18-708 | 27-284 | 6-362 | 6-188 | 10-355 |
P*<0.05,**<0.01,***<0.001. Difference in intergroup are represented as: @CB vs. 0-6 months; #CB vs. 6-12 months; $CB vs. 1-2 yr; ^CB vs. 2-5 yr; δCB vs. 5-10 yr; %CB vs. 10-16 yr; ’’0-6 months vs. 6-12 months; >0-6 months vs. 1-2 yr; z0-6 months vs. 2-5 yr; y0-6 months vs. 5-10 yr; x0-6 months vs. 10-16 yr; w6-12 months vs. 1-2 yr; v6-12 months vs. 2-5 yr; u6-12 months vs. 5-10 yr; t6-12 months vs. 10-16 yr; s1-2 yr vs. 2-5 yr; r1-2 yr vs. 5-10 yr; q1-2 yr vs. 10-16 yr; p2-5 yr vs. 5-10 yr; o2-5 yr vs. 10-16 yr; n5-10 yr vs. 10-16 yr. RTE, recent thymic emigrant; CM, central memory; EM, effector memory; TEMRA, terminally differentiated effector memory re-expressing CD45RA+; Tc, T cytotoxic; Th, T helper; CB, cord blood
| Percentage/age | CB (n=18) | 0-6 months (n=9) | 6-12 months (n=13) | 1-2 yr (n=19) | 2-5 yr (n=27) | 5-10 yr (n=25) | 10-16 yr (n=37) |
|---|---|---|---|---|---|---|---|
| Lymphocytesa*** | 39.3@,#,$ | 62.5z,y,x | 58.8u,t | 57s,r,q | 43.4 | 38.7 | 39 |
| 24.2-48.4 | 41.6-73 | 39.1-69.4 | 49.8-64.1 | 31.3-61. | 24.5-49.0 | 27.5-48.2 | |
| NK cellb | 6.3 | 5.6 | 5.2 | 6.7 | 7.2 | 8.8 | 8.3 |
| 2.7-26.0 | 3.9-9.0 | 2.3-20.8 | 2.98-11.2 | 2.92-14.0 | 3.05-20.4 | 4.6-12.1 | |
| T cellb* | 68.4 | 62.3 | 63.7 | 65.3 | 68.6 | 72.7 | 70.9 |
| 55.9-85.7 | 52.1-86.3 | 49.5-75.9 | 57.7-74.3 | 57.1-75.5 | 60.5-78.8 | 61.4-79.6 | |
| Th cellb*** | 48.8^,δ,% | 39.3 | 42.6 | 37.4 | 34.5 | 36.5 | 35.1 |
| 31.5-61.3 | 35.3-63.5 | 21.0-51.2 | 31.5-49.4 | 28.7-42.2 | 27.0-47.1 | 27.8-44.6 | |
| Tc cellb*** | 17.8^,δ,% | 18.4z,y,x | 19.3t | 23.3q | 26.9 | 26.5 | 27.3 |
| 12.7-27.8 | 13.1-22.3 | 13.7-28.5 | 17.8-26 | 17.6-34.8 | 19.2-36.5 | 20.7-36.7 | |
| Th Naïve cell (CD27)c*** | 93.3$,^,δ,% | 86.96y,x | 83.9t | 78q | 75.7 | 71 | 61.6 |
| 84.5-96.6 | 74.3-92.8 | 57.2-90.3 | 62.3-86.8 | 63.9-81.0 | 51.7-82.2 | 39.9-76.8 | |
| Th RTEc*** | 76.7^,δ,% | 68x | 71.1t | 61.4q | 58.1o | 52.3 | 43.6 |
| 65.1-85.1 | 57.4-78.1 | 49.1-77.2 | 48.9-72 | 43.9-67.7 | 42.2-64.2 | 31.7-59.8 | |
| CM Th cell (CD27)c*** | 6.5$,^,δ,% | 11.4z,y,x | 13.6t | 19 | 20.7 | 24.3 | 28.8 |
| 3.03-15.2 | 6.8-19.8 | 8.9-26.8 | 11.7-27.3 | 17.4-29.2 | 15.2-35.8 | 17.2-49.2 | |
| EM Th cell (CD27)c*** | 0.03$,^,δ,% | 1.2x | 1.1t | 1.7q | 2.7o | 3.7 | 6.7 |
| 0.01-0.2 | 0.2-3.6 | 0.4-6.9 | 0.4-8.0 | 1.2-5.4 | 1.9-13.9 | 4.1-15.3 | |
| TEMRA Th cell (CD27)*** | 0@,#,$,^,δ,% | 0.44 | 0.37 | 0.43 | 0.27p,o | 2.7 | 2.14 |
| 0-0.1 | 0.02-2.4 | 0.02-11.5 | 0.06-10.6 | 0.05-2.3 | 0.2-11.4 | 0.2-6.9 | |
| Tc Naïve cell (CD27)d*** | 91.1#,$,^,δ,% | 70.3 | 71.5 | 66.7 | 76.4 | 66.2 | 57.5 |
| 87.1-96.9 | 60.4-92.7 | 35.2-91.7 | 48.5-88.9 | 53.7-90.9 | 43.2-77 | 36.4-80.6 | |
| Tc RTEd*** | 94.9#,$,^ | 70.96 | 71.8 | 66.7 | 74.5o | 68.0 | 63.3 |
| 90.2-98.3 | 54.4-94.7 | 40.5-89.0 | 50.7-81.3 | 56.4-88.5 | 52.7-75.2 | 43.4-77.5 | |
| CM Tc cell (CD27)d* | 9.0$,δ,% | 14.6 | 10.5 | 16.2 | 12.7 | 14.9 | 18.34 |
| 3.1-13.3 | 7.1-26.2 | 6.6-29.9 | 4.7-31.6 | 4.20-22.8 | 4.9-28.1 | 9.8-30.4 | |
| EM Tc cell (CD27)d*** | 0.01@,#,$,^,δ,% | 2.7 | 1.5 | 1.6 | 1.2 | 1.9 | 4.1 |
| 0-0.2 | 0.1-11.7 | 0.1-10.8 | 0.3-7.9 | 0.3-8.6 | 0.5-12.8 | 1-9.2 | |
| TEMRA Tc cell (CD27)d*** | 0.04#,$,^,*,% | 7.5 | 12.0 | 12.6 | 5.9 | 13.8 | 17 |
| 0-0.7 | 0.1-19.5 | 0.2-47.1 | 1.10-26.7 | 0.8-30.1 | 3.0-36.5 | 3.1-35.7 | |
| RTE on Th Naïvec*** | 71.2^,δ,% | 60.2x | 64.5u,t | 58.9r,q | 50.8 | 45.1 | 44.9 |
| 58.6-78.9 | 50.5-69.6 | 48.2-73.3 | 45.4-68.9 | 39.9-63.3 | 30.7-57.4 | 30.3-57.1 | |
| RTE on Tc Naïved*** | 92.7@,#,$,^,δ,% | 59.2 | 60.4 | 59.1 | 65.5o | 58.3 | 47.32 |
| 83.8-96.1 | 49.5-79.8 | 26.9-84.1 | 38.2-78.4 | 43.7-80.4 | 35.7-68.6 | 32.1-66.2 | |
| B cellb*** | 14.2@,$ | 25.5y | 23.3u | 23.8r,q | 21.6 | 16.6 | 17.9 |
| 8.1-28.4 | 4.6-35.9 | 12.4-37.8 | 16-36.9 | 12.3-34.1 | 10.5-26.2 | 10.7-26.3 | |
| Total memory B celle*** | 2.5$,^,δ,% | 5.3z,y,x | 10.1u,t | 14.3 | 16.6 | 25.1 | 19.4 |
| 1.7-5.4 | 1.3-16.8 | 3.8-19.6 | 7.3-21.8 | 8.7-30.0 | 10.6-35.2 | 7.2-33.7 | |
| Class switch memory B celle*** | 0.03$,^,δ,% | 0.9y,x | 3.2t | 6 | 5.9 | 8.9 | 9.8 |
| 0-0.2 | 0.1-9.05 | 0.89-16 | 2.96-9.7 | 3.8-10.7 | 4.1-15.1 | 3.8-7.5 | |
| Unswitched memory B celle* | 2.3 | 2.4 | 2.5 | 2.7 | 5 | 4.8 | 2.6 |
| 1.5-4.96 | 0.36-7.34 | 0.9-8.99 | 0.6-9 | 1.0-10.15 | 0.9-14.94 | 0.7-6.4 | |
| IgM only memory B celle*** | 0.02#,$,^,δ,% | 0.19x | 0.42 | 0.49 | 0.68 | 0.53 | 1.04 |
| 0-0.06 | 0-0.61 | 0.23-1.13 | 0.12-1.9 | 0.09-1.93 | 0.12-2.42 | 0.16-3.06 | |
| Naïve B cellse*** | 94.7$,^,δ,% | 92.7z,y,x | 86.8u,t | 82.4 | 79.7 | 70.4 | 75.9 |
| 92.6-96.4 | 79.9-96.6 | 74.1-92.7 | 73.6-90.2 | 67.1-88 | 59.8-82.9 | 59.8-89.6 | |
| Pre-GC B cellse*** | 92.6#,$,^,δ,% | 71.2x | 51.4t | 49.4 | 47.5 | 32.3 | 14.9 |
| 88.2-96.0 | 16.5-93.5 | 28.6-82.8 | 6.6-80.9 | 12.9-75.2 | 11.1-74.6 | 4.4-71.3 | |
| Double negative B celle*** | 1.44δ,% | 2.04 | 3.28 | 2.69 | 2.7 | 4.21 | 4.54 |
| 0.7-3.99 | 0.99-5.44 | 0.63-7.27 | 1.02-7.07 | 1.01-4.60 | 1.3-8.3 | 1.6-8.3 | |
| DNT on Lymphsb | 1.7#,$,^,δ,% | 2.1z,y,x | 3v,u,t | 3.8 | 5.35 | 5.31 | 5.26 |
| 0.91-3.37 | 1.02-9.47 | 1.5-4.5 | 3.3-5.6 | 3.1-8.2 | 3.3-9.9 | 3.1-10.9 | |
| DPT on Lymphsb | 1.15 | 1.67 | 1.06 | 0.81 | 0.85 | 0.72 | 0.79 |
| 0.44-3.16 | 0.54-5.34 | 0.23-2.83 | 0.31-2.01 | 0.34-2.42 | 0.498-1.766 | 0.43-2.38 | |
| DNTgd-ab+Tf*** | 0.68$,^,δ,% | 0.88>,z | 1.15v | 1.72 | 1.85o | 1.45 | 1.32 |
| 0.44-1.44 | 0.24-1.85 | 0.57-1.62 | 0.85-2.4 | 1.19-2.7 | 1.13-2.27 | 0.95-2.02 | |
| DNT gd+Tf*** | 1.68$,^,δ,% | 2.36z,y,x | 3.54 | 3.93 | 5.77 | 5.66 | 5.27 |
| 0.65-3.14 | 1.4-12.01 | 1.58-6.82 | 2.82-8.03 | 2.86-9.73 | 2.88-12.45 | 2.45-10.86 | |
| TCRgd-ab+Tf*** | 96.9$,^,δ,% | 95.2 | 94 | 93.9 | 90.8 | 91.5 | 90.1 |
| 94.9-98.7 | 85.0-97.4 | 83.5-97.2 | 88.5-95.1 | 86.2-95.3 | 84.99-96.3 | 83.8-95.8 | |
| TCRgd+Tf*** | 2.6#,$,^,δ,% | 4.8 | 5.3 | 6 | 8 | 8.5 | 9.1 |
| 0.9-4.0 | 2.6-14.6 | 3.0-15.8 | 4.3-11.6 | 4.6-13.3 | 3.7-14.9 | 3.6-13.9 | |
| NKTb | 7.1 | 6 | 7.6 | 7.6 | 10 | 11.2 | 7.4 |
| 4.2-14.1 | 2.8-10.4 | 2.2-26 | 3.3-19.1 | 2.5-21.8 | 6.6-27 | 2.2-19.3 | |
| HLADR+Th cellc*** | 0.3@,#,$,^,δ,% | 2 | 2.3 | 1.6 | 1.8 | 2.2 | 3.8 |
| 0.2-1.5 | 1.2-5 | 0.7-5.7 | 0.8-7.5 | 1.2-7.3 | 1.3-6.7 | 1.4-5.9 | |
| HLADR+Tc celld*** | 0.45@,#,$,^,δ,% | 14.3 | 7.2 | 7.1 | 3.5 | 5.2 | 6.4 |
| 0.2-1 | 1.2-19.3 | 2-16.2 | 1.9-22.1 | 1.6-17.0 | 2.8-16.8 | 2.3-18.7 | |
| HLADR+T cellf*** | 0.49@,#,$,^,δ,% | 6.35 | 4.9 | 3.95 | 2.6 | 3.5 | 4.5 |
| 0.3-1.4 | 1.4-10.9 | 1.4-10.1 | 1.3-14.3 | 1.4-8.1 | 2.1-10.0 | 2.1-10.2 | |
| HLADR+NK cellg | 6.4@,$,^,δ,% | 22.2 | 15.2 | 13.7 | 13.4 | 13.8 | 12.9 |
| 2.2-20.5 | 4.3-38.6 | 4.6-44 | 5.8-32.1 | 7.1-21.5 | 6.8-29.7 | 7.7-32.8 | |
| HLADR+45RA OF DNTgd-Th | 3 | 6.2 | 7.6 | 3.8 | 4.6 | 3.9 | 4.2 |
| 0.4-10.6 | 2.6-10.9 | 2.1-14.2 | 0.9-7.8 | 0.5-9.3 | 1.4-7.9 | 1.2-12.1 | |
| Th Naïve cell (CD62L)c*** | 88.3$,^,δ,% | 80.8y,x | 78.0u,t | 71.4q | 65o | 54.5 | 55.2 |
| 80-95.5 | 65.5-87.1 | 64.7-83.7 | 59.5-82.8 | 54.8-81.3 | 41.8-79.7 | 33.8-70.7 | |
| CM Th cell (CD62L)c*** | 5.7$,^,δ,% | 14.3x | 11.8t | 14.3q | 15.4o | 17.9 | 25 |
| 1.7-11.7 | 2.1-19.4 | 3.5-19.8 | 7.6-22.2 | 6.3-23.1 | 7.4-32.3 | 16-33.1 | |
| EM Th cell (CD62L)c*** | 2.4^,*,% | 4.6y,x | 7.6u,t | 7.9q | 12.5 | 14.9 | 17.5 |
| 0.3-5.3 | 0-20.1 | 1.20-10.8 | 2.9-15.9 | 4.9-18.7 | 5.2-22.9 | 9.2-30.6 | |
| TEMRA Th cell (CD62L)c* | 3.2 | 1.1 | 3.2 | 2.9 | 2.2 | 6.7n | 1.7 |
| 0.9-6.9 | 0.1-13.5 | 0.6-11.2 | 0.6-16.6 | 0.1-17.9 | 0.9-20.8 | 0.7-8.06 | |
| Tc Naïve cell (CD62L)d*** | 93.8@,#,$,^,*,% | 67.3 | 62 | 70.3 | 74.8o | 71.2n | 53.4 |
| 84.5-96.8 | 59.7-85.1 | 31.9-86.1 | 44.8-88.1 | 53.7-85.8 | 45.5-87 | 37-72.9 | |
| CM Tc cell (CD62L)d** | 3.4^,% | 8.2 | 4.5 | 7.7 | 8.2 | 5.1 | 7 |
| 1.1-8.1 | 3.0-28 | 1.2-15.3 | 2.9-24.8 | 2.1-19.7 | 1.1-29.6 | 3.0-29.7 | |
| EM Tc cell (CD62L)d*** | 0.3#,$,^,*,% | 2 | 5.2 | 6.5 | 3.3 | 11.9 | 11.5 |
| 0-1.6 | 0.7-29.7 | 1.3-25.8 | 0.95-22.6 | 1.2-21.3 | 1.3-29.1 | 2.3-26.5 | |
| TEMRA Tc cell (CD62L)d*** | 2#,*,% | 5.5 | 8.8 | 9.7 | 5.5o | 3.6n | 20.2 |
| 0-9.3 | 0.6-29.4 | 1.8-57.3 | 1.9-26.5 | 0.63-24.9 | 0.7-22.7 | 2.7-37.2 | |
| gd+T of Lymphsb*** | 2^,*,% | 3 | 4 | 4 | 6 | 6 | 6 |
| 0.9-3.1 | 2-10 | 1.4-8.4 | 3-5.4 | 3-9 | 2.6-10.4 | 2.8-10.2 | |
| CD4/CD8 ratio*** | 2.49^,*,% | 2.74z,y,x | 2 | 2 | 1 | 1 | 1 |
| 1.1-3.8 | 2-4 | 1-3.6 | 1-3 | 1-2 | 1-2.4 | 1-2 |
P*<0.05, **<0.01, ***<0.001. Difference in intergroup are represented as: @CB vs. 0-6 months; #CB vs. 6-12 months; $CB vs. 1-2 yr; ^CB vs. 2-5 yr; δCB vs. 5-10 yr; %CB vs. 10-16 yr; ’’0-6 months vs. 6-12 months, >0-6 months vs. 1-2 yr; z0-6 months vs. 2-5 yr; y0-6 months vs. 5-10 yr; x0-6 months vs. 10-16 yr; w6-12 months vs. 1-2 yr; v6-12 months vs. 2-5 yr; u6-12 months vs. 5-10 yr; t6-12 months vs. 10-16 yr; s1-2 yr vs. 2-5 yr; r1-2 yr vs. 5-10 yr; q1-2 yr vs. 10-16 yr; p2-5 yr vs. 5-10 yr; o2-5 yr vs. 10-16 yr; n5-10 yr vs. 10-16 yr; aPer cent of leucocyte; bPer cent of peripheral lymphocytes; cPer cent of Th cells; dPer cent of Tc cells; ePer cent of B cells; fPer cent of T cells; gPer cent of NK cells; hPer cent of CD3+CD4-CD8-gd-T cells. CM, central memory; EM, effector memory; TEMRA, terminally differentiated effector memory re-expressing CD45RA; DNT, double negative T; Tc, T cytotoxic; Th, T helper; NK, natural killer; gd, gamma delta; TCRgd, T cell receptor gd; HLADR: human leukocyte antigen DR
![Stepwise gating strategy for lymphocytes, general lymphocyte subpopulation, T, B, NK and activated cell subpopulations. (A) FSC-H vs. FSC-A plot was used to remove doublets and cell debris. (B) Singlet cells were further plotted against SSC-A vs. FSC-A. (C) SSC-A vs. CD45 was used to gate lymphocytes, based on low forward/side scatter and bright CD45. (D) Density plot demonstrating NK cells (CD3- CD16/CD56+) and NKT cells (CD3+ CD16/CD56+). (E) T cells were gated using CD45 and CD3. (F-J) T cell populations were distinguished depending on CD4, CD8, CD27, CD45RA and TCRgd expression. (K-N) B cells were gated as CD19+CD3- and the subpopulations were distinguished depending on IgD, IgM and CD27 expression. (O-S) HLA-DR was used to access the activation status on DNTs, T, Tc, Th, NK cells respectively. The names written above the plot [name] represent the parent gate. NK, natural killer](/content/175/2023/158/2/img/IJMR-158-161-g001.png)
- Stepwise gating strategy for lymphocytes, general lymphocyte subpopulation, T, B, NK and activated cell subpopulations. (A) FSC-H vs. FSC-A plot was used to remove doublets and cell debris. (B) Singlet cells were further plotted against SSC-A vs. FSC-A. (C) SSC-A vs. CD45 was used to gate lymphocytes, based on low forward/side scatter and bright CD45. (D) Density plot demonstrating NK cells (CD3- CD16/CD56+) and NKT cells (CD3+ CD16/CD56+). (E) T cells were gated using CD45 and CD3. (F-J) T cell populations were distinguished depending on CD4, CD8, CD27, CD45RA and TCRgd expression. (K-N) B cells were gated as CD19+CD3- and the subpopulations were distinguished depending on IgD, IgM and CD27 expression. (O-S) HLA-DR was used to access the activation status on DNTs, T, Tc, Th, NK cells respectively. The names written above the plot [name] represent the parent gate. NK, natural killer

- Gating strategy for T cell and its subpopulation like Naïve, CM, EM, Terminally differentiated effector memory re-expressing CD45RA+ (TEMRA) and RTE cells. (A) FSC-H vs. FSC-A plot was used to remove doublets cell debris. (B) Singlet cells were further plotted against SSC-A vs FSC-A. (C) SSC-A vs. CD45 was used to gate lymphocytes, based on low forward /side scatter and bright CD45. (D) SSC-A vs. CD3 was used to identify T cells. (E) T cells were characterized as T helper cells/cytotoxic T cells based on the expression of CD4 and CD8. (F and I) Quadrant density plot representing naïve, central, effector memory and TEMRA sub population using CD62L and CD45RA on Th and Tc cells. (G, J, H and K) Recent thymic emigrants (RTE) were identified based on co-expression of CD31 and CD45RA and or CD62L on both Th and Tc cells. The names written above the plot (name) represent the parent gate. CM, Central memory; EM, effector memory; RTE, recent thymic emigrant
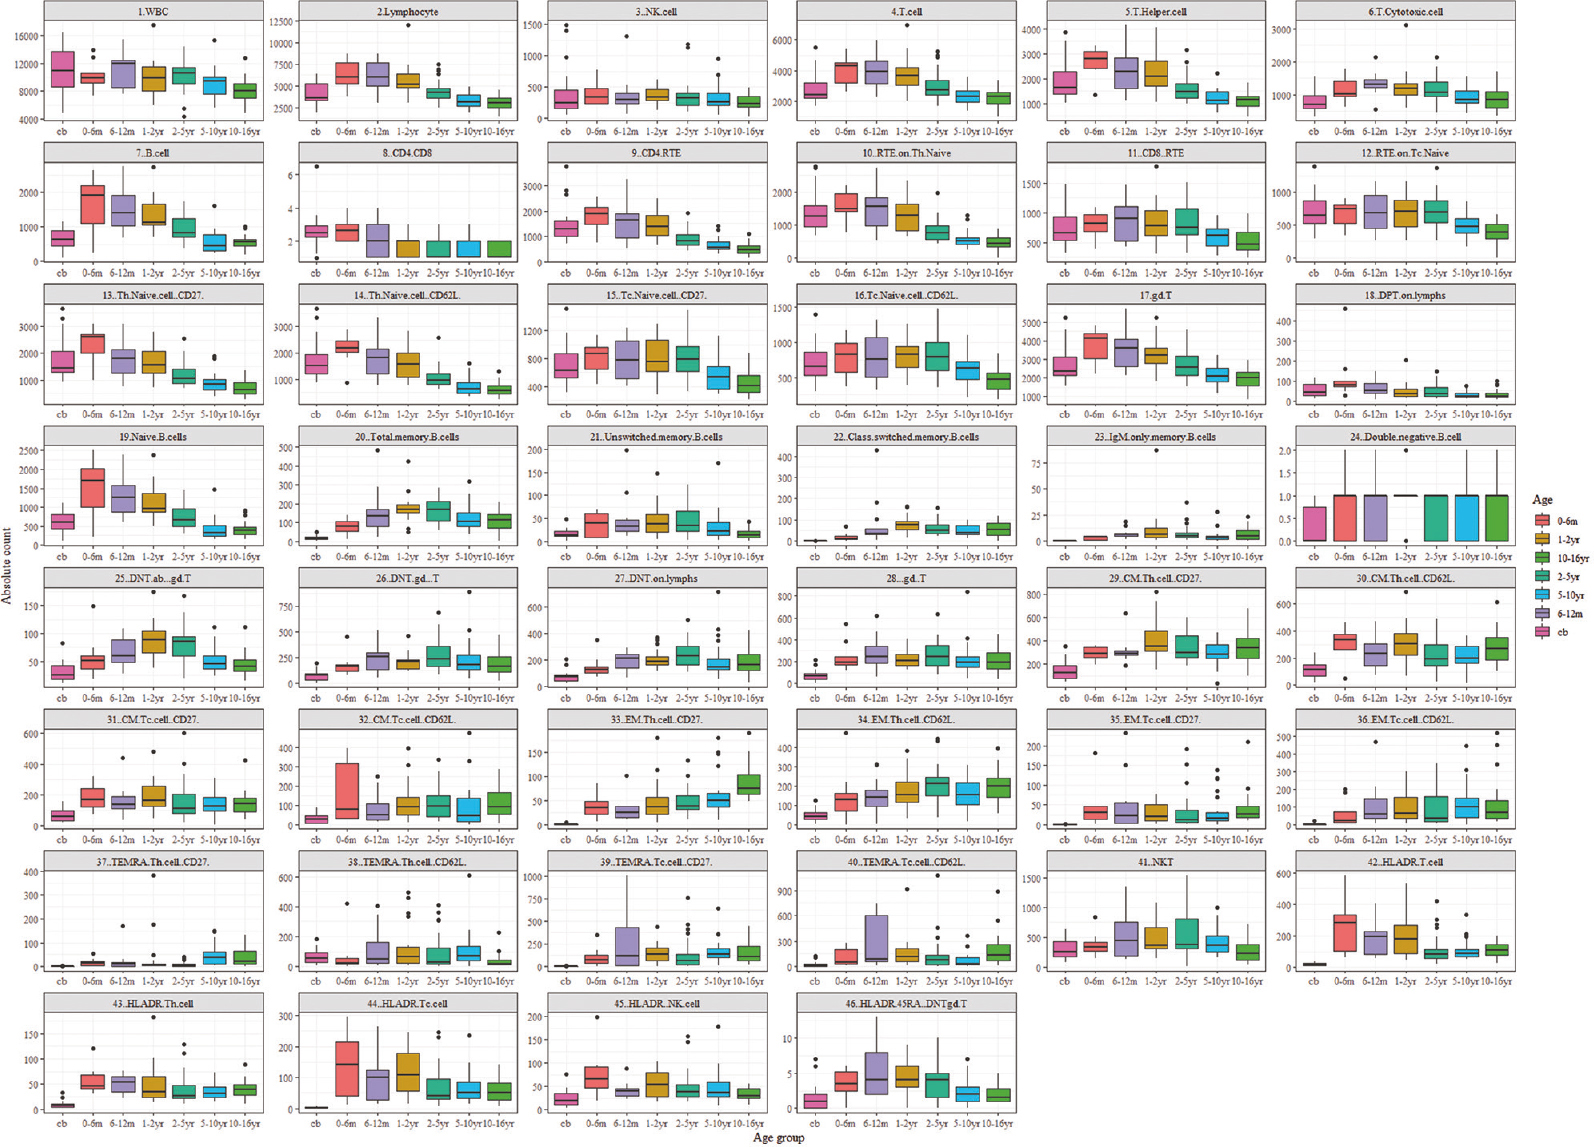
- Age-related ranges for absolute lymphocyte subset counts. Flow cytometric analysis of 148 healthy individuals amongst seven different age groups. All values of this reference dataset are represented as box plots with median, p10, p25, p75 and p90 percentile. For the data visualization package ggplot2 for the statistical language, R was used. Cb, cord blood; yr, years, m, month
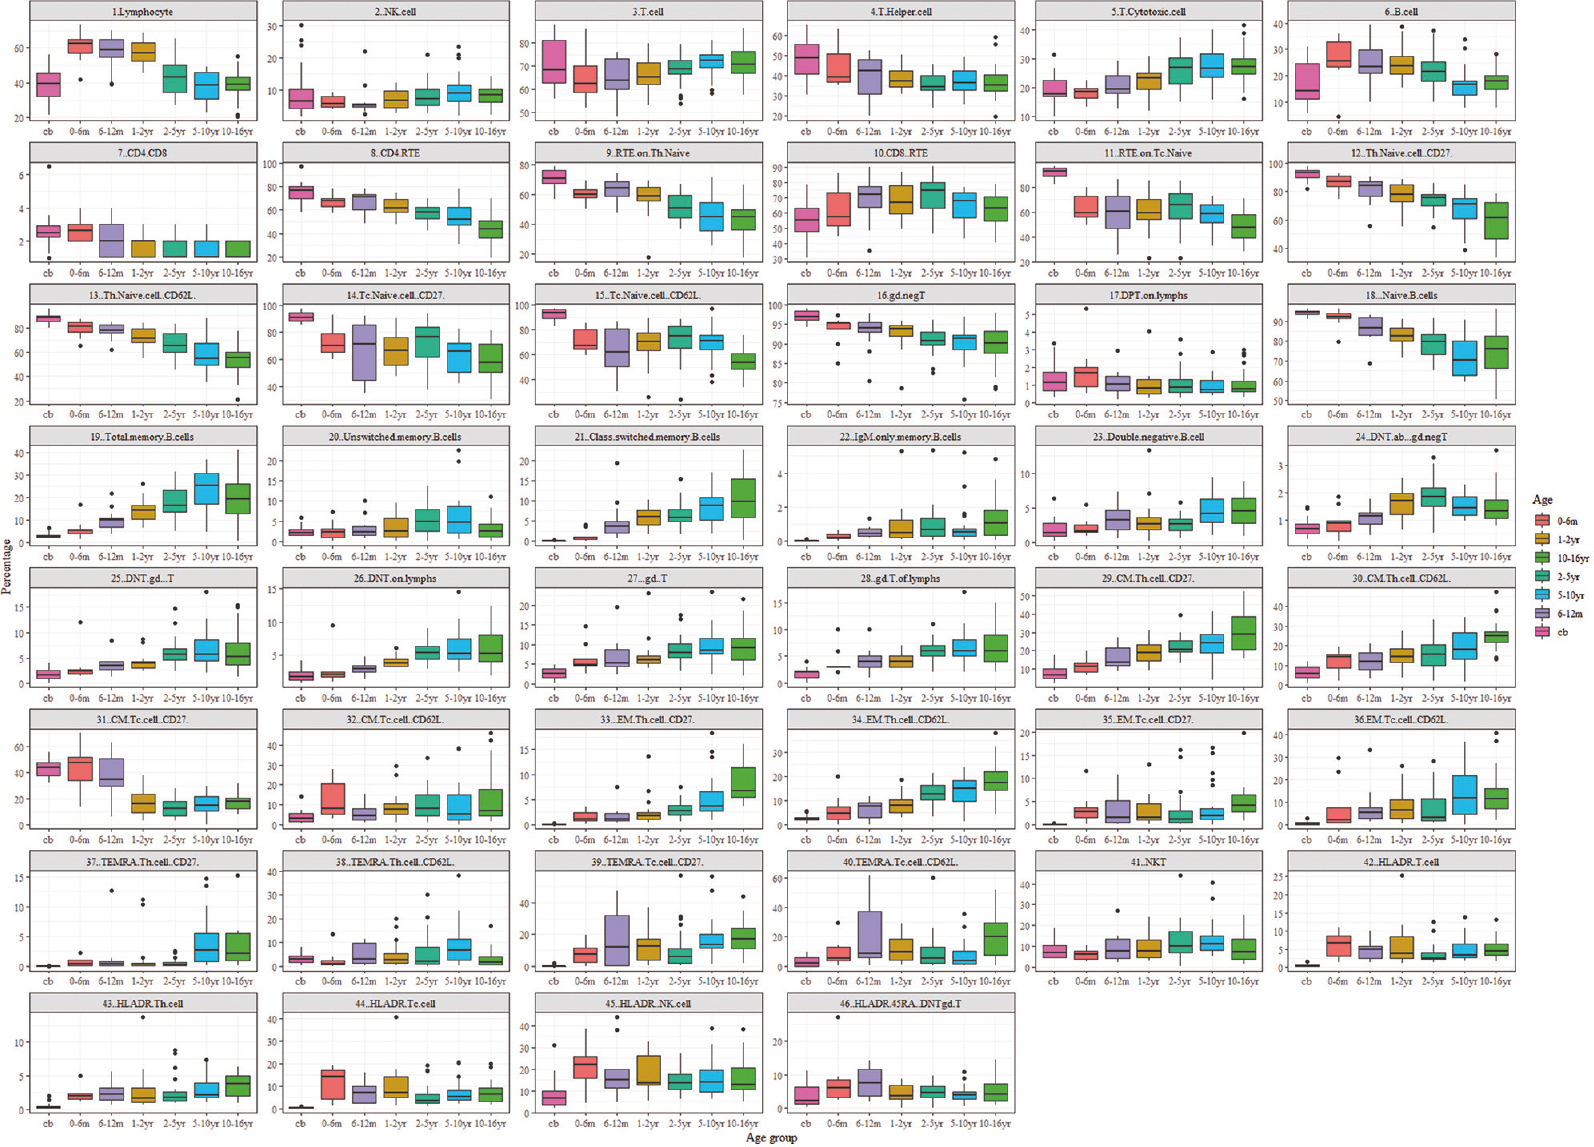
- Age-related ranges for the percentage of lymphocyte subset counts. Flow cytometric analysis of 148 healthy individuals amongst seven different age groups. All values of this reference dataset are represented as box plots with median, p10, p25, p75, and p90 percentile. For the data visualization package ggplot2 for the statistical language, R was used. Cb, cord blood; yr, years; m, month.
The presented data has unveiled noteworthy trends in the lymphocyte and T-lymphocyte profiles across age groups. During early infancy, there is a conspicuous elevation in the absolute counts of total lymphocytes and T-lymphocytes, which subsequently diminish with advancing age. Notably, the proportion of T cells while varying slightly with a median range spanning from 62 to 73 per cent showed a stable pattern over time. Furthermore, specific T cell subsets such as Th and Tc cells remained relatively constant, exhibiting medians within the range of 35 to 48 per cent for Th cells and 17.8 to 27 per cent for Tc cells.
Of particular interest was the observation regarding the CD4/CD8 ratio, which underwent a gradual decline with increasing age. Furthermore, the populations of naive T cells and recently thymic emigrants (RTE) along with Tc cells exhibit a progressive reduction with progressing age. In contrast, central memory and effector memory T cells increased in the later years of life. TEMRA (terminally differentiated effector memory RA+) on CD4 cells remained relatively low across various age groups; however, CD8 cells showed an increasing trend with age.
The relative frequency of T cell receptor gamma delta (TCRgd+) cells increased till 16 yr of age, whereas double-negative TCRgd+ T cells increased till 10 yr of age after which they declined. The TCRgd− T-cells showed an overall decreasing pattern and double-negative TCRgd− T-cells remained stable, showing a relative frequency of 0.68-1.85 per cent. T cell activation status as assessed by HLA-DR expression showed an increasing pattern up to one year following a gradual declines. CD45RA and HLA-DR co-expression accessed for double-negative T (DNT) TCRgd− cells was found to be 3-7.6 per cent. DNT cells were relatively stable.
It was observed that absolute B-cell count and the percentage decrease with age. Naive B-cells showed the same pattern, while B memory and un-switched cells showed an increasing absolute count up to two years followed by a gradual decrease. IgM-only memory B cells remain very low. There is an increase in class-switched memory B cells with age. NK cell counts are relatively stable across the age groups.
Discussion
Advances in multicolour flow cytometry allow one to look at an array of immune parameters which are typically evaluated in different disease situations such as autoimmunity, immunodeficiency, malignancy and infectious diseases. For interpretation of results, although there are several studies reporting reference values for basic lymphocyte subsets in different populations globally4-7,14,16-19, a lack of paediatric age reference values for the extended lymphocyte subset is evident. To the best of our knowledge, there are no studies from India that give reference values for rare subsets for paediatric age groups such as naïve and memory T/B cell, RTE, activated T, activated NK cells, NKT cells, DNT cells, TCRgd+ T cells or HLADR and CD45RA co-expression on DNT cells.
In certain diseases, especially IEI, the basic lymphocyte subset may be normal, but individual subpopulations may be abnormal, and evaluation of such subsets is important. In this study such reference ranges have been utilized in interpreting immunological parameters in patients with IEI, especially severe combined immunodeficiency (SCID), combined immunodeficiency (CID), predominant antibody deficiencies (PADs) and primary immune regulatory disorders20-24.
To differentiate true lymphopenia from transient lymphopenia, i.e. if T-cells are low but naive T-cells counts are normal, it is suggestive of transient lymphopenia, whereas if both are on the lower side, it suggests SCID25. RTE plays a vital role in autoimmune diseases like rheumatoid factor-negative polyarticular juvenile idiopathic arthritis and in adults with systemic lupus erythematosus, type I diabetes and psoriasis16. CD8 RTE plays a major role in chronic viral diseases, its decrease has been associated with SCID and Ommens syndrome26. HLA-DR and CD45RA co-expression on DNT cells is reported to be elevated in autoimmune lymphoproliferative syndrome, signal transducer and activator of transcription 3-gain-of-function, and CTLA4 deficient patients27.
Patients with PADs such as common variable immunodeficiency and CID-like hyper IgM can have normal B-cell count but reduced memory and class switch cells. DOCK-8 deficient patients show an increase in naïve and a decrease in memory B cells28. IEIs like PI3KCD-activated p110 δ syndrome can have B and T cell abnormalities such as low pre-GC memory B cells, class-switched memory B cells and skewing of CD4+ with CD8+ T cells towards terminally differentiated effector cells1. CD27 deficiency can be identified based on absent CD27 expression on naive T cells with no memory B cells.
We thus report pilot data for 34 immune parameters, both absolute as well as relative counts (Figs. 3 and 4). This preliminary study can be used as a pilot for future large scale multicentric study to determine the reference values that can help in making the diagnosis of several infectious and immunological diseases like IEI (
The lymphocyte subset reference ranges were compared among the American, Asian, European, African and Indian populations for available subsets1,6,7,14,16,18,29 (Supplementary Table III). The majority of T, B and NK cell subsets showed no significant difference across the different populations (Supplementary Table III.). T helper cells were higher than in the Cameroonian population, and T cytotoxic cells were higher than in the African and American populations, as reported previously7,14.
| Subset/country | CB | 0-6 m | 6-12 m | 1-2 yr | 2-5 yr | 5-10 yr | 10-16 yr |
|---|---|---|---|---|---|---|---|
| Lymphocyte | 3627 | 6013 | 6029 | 5210 | 4226 | 3108 | 3087 |
| NIIH (present study) | 2809-5917 | 3744-8637 | 3537-8294 | 3182-7410 | 3048-6752 | 2258-4781 | 2038-4113 |
| Euroflow1 | 2040-5688 | 2443-9955 | 4821-8531 | 2356-13275 | 1620-6856 | 1827-4564 | 1238-4792 |
| USA | NA | 5400 (3400-7600) 6300 (3900-9000) | 5900 (3400-9000) | 5500 (3600-8900) | 3600 (2300-5400) | 2700 (1900-3700) | 2200 (1400-3300) |
| Italy6 | NA | 5740 (4054-7048) | 5690 (3320-7006) | 4685 (3873-6141) | 3800 (2340-5028) | 2500 (1662-3448) | 2285 (1340-3173) |
| China male17 | NA | 5310 (3680-7340) | 5890 (3730-8760) | 4440 (2790-6350) | 2940 (2280-3820) | 2530 (2020-3610) | 2440 (1780-3440) |
| China female17 | NA | 5120 (4020-6450) | 5710 (3780-8110) | 4390 (2980-5950) | 3040 (2370-4290) | 2650 (2020-3500) | 2490 (1760-3000) |
| Netherland16 | 5400 (3100-9400) | 6500 (3400-12200) | 6300 (3200-12300) | 4100 (1400-12100) | 2700 (1400-5500) | 2400 (1200-4700) | 2400 (1400-4200) |
| T cell | 2423 | 4321 | 3952 | 3642 | 2744 | 2300 | 2291 |
| NIIH | 1889-4764 | 2617-5380 | 2252-5788 | 2105-5460 | 2087-4899 | 1639-3388 | 1390-3008 |
| India14,29 | 2402.38 (1725-3406) | 3421 (952-8586) | 4630 (1623-8159) | 3801 (1480-6475) | 3110 (1191-6692) | 2347 (1191-4497) | 1960 (1035-4493) |
| Euroflow1 | 1186-4113 | 1680-7754 | 3764-6289 | 1900-9345 | 852-5333 | 1352-3275 | 930-3477 |
| USA7 | NA | 3930 (2500-5600) | 3930 (1900-5900) | 3550 (2100-6200) | 2390 (1400-3700) | 1820 (1200-2600) | 1480 (1000-2200) |
| Italy6 | NA | 4040 (3180-5401) | 3833 (2284-4776) | 3133 (2542-4933) | 2580 (1578-3707) | 1793 (1239-2611) | 1629 (954-2332 |
| India19 | 2859 (3100-5200) | 3631 (1767-5495) | 2994 (1278-4710) | 2506 (1222-3790) | 2590 (1368-3812) | NA | NA |
| Cameroon18 | 2249 (430-2977) | 3085 (2352-4776) 3120 (1123-4378) | 3522 (2039-5024) | 2639 (794-3307) | 2299 (1159-3242) | NA | NA |
| China17 | NA | 3391 (1885-4954) | 3625 (1571-7165) | 2816 (1355-4921) | 2028 (1254-3216) | 1758 (1093-3013) | 1649 (999-2607) |
| Netherland16 | 3100 (1400-6800) | 4500 (2200-9200) | 4400 (2400-8300) | 2500 (700-8800) | 1900 (850-4300) | 1800 (770-4000) | 1600 (850-3200) |
| Th cell | 1637 | 2802 | 2274 | 2090 | 1463 | 1109 | 1168 |
| NIIH | 1060-3558 | 1336-3327 | 1207-4013 | 1154-3460 | 1001-2535 | 805-1855 | 659-1547 |
| India14,29 | 1808 (1260-2440) | 2156 (659-6132) | 2852 (913-5680) | 2271 (817-4893) | 1821 (794-4323) | 1266 (618-2555) | 1080 (582-2045) |
| Euroflow1 | 952-3097 | 1273-5633 | 2093-4769 | 617-5959 | 516-3448 | 776-1815 | 576-1891 |
| USA7 | NA | 2610 (1600-4000) 2850 (1800-4000) | 2670 (1400-4300) | 2160 (1300-3400) | 1380 (700-2200) | 980 (650-1500) | 840 (530-1300) |
| Italy6 | NA | 3079 (2330-3617) | 2492 (1523-3472) | 1866 (1573-2949) | 1448 (870-2144) | 1030 (646-1515) | 887 (610-1446) |
| Cameroon18 | 1552 (330-1995) | 2001 (1642-3472) 2133 (759-3205) | 2252 (1311-3273) | 1667 (596-1949) | 1289 (674-1721) | NA | NA |
| India19 | 1707 (2209-3205) | 2932 (1516-4348) | 2427 (1056-3799) | 2029 (1113-2946) | 1977 (839-3115) | NA | NA |
| China17 | NA | 2287 (1217-3422) | 2318 (850-4658) | 1472 (717-2798) | 1001 (546-1768) | 839 (496-1479) | 781 (391-1421) |
| Netherland16 | 2200 (1000-4800) | 3300 (1600-6500) | 3000 (1300-7100) | 1600 (400-7200) | 1100 (500-2700) | 1000 (400-2500) | 900 (400-2100) |
| Tc cell | 707 | 1010 | 1315 | 1185 | 1057 | 856 | 841 |
| NIIH | 451-1346 | 618-1778 | 548-1930 | 781-1692 | 562-1809 | 508-1257 | 471-1242 |
| India14,29 | 721 (558-1064) | 970 (159-3717) | 1407 (455-3393) | 1319 (549-2844) | 1084 (315-2258) | 913 (422-1878) | 767 (405-2615) |
| Euroflow1 | 213-1138 | 354-2006 | 720-1271 | 364-2498 | 188-1805 | 366-1171 | 261-1189 |
| USA7 | NA | 980 (560-1700) 1050 (590-1600) | 1040 (500-1700) | 1040 (620-2000) | 840 (490-1300) | 680 (370-1100) | 530 (330-920) |
| Italy6 | NA | 1048 (712-1361) | 976 (524-1583) | 884 (656-1432) | 804 (472-1107 | 595 (365-945) | 518 (282-749) |
| Cameroon18 | 554 (140-1188) | 790 (570-1714) 726 (298-1413) | 995 (563-1796) | 823 (194-1165) | 775 (308-1249) | NA | NA |
| India19 | 836 (312-1360) | 1544 (970-2118) | 1133 (541-2807) | 1269 (523-2015) | 1373 (749-1997) | NA | NA |
| China17 | NA | 963 (436-1846) | 1212 (472-2874) | 1047 (397-2080) | 765 (455-1430) | 709 (396-1325) | 699 (366-1091) |
| Netherland16 | 800 (200-2700) | 1000 (300-3400) | 1200 (400-4100) | 700 (200-2800) | 600 (200-1800) | 600 (200-1700) | 600 (300-1300) |
| Th Naïve cell | 1445 | 2619 | 1797 | 1552 | 1057 | 825 | 644 |
| NIIH | 1001-3329 | 993-3086 | 758-2992 | 816-2509 | 711-1844 | 416-1462 | 325-1208 |
| Euroflow1 | 920-2897 | 1092-5337 | 1748-4201 | 360-5273 | 276-2902 | 424-1393 | 264-1484 |
| USA7 | NA | 2250 (1200-3600) 2230 (1300-3600) | 2100 (1100-3600) | 1640 (950-2800) | 960 (420-1500) | 560 (310-1000) | 390 (210-750) |
| China male17 | NA | 1839 (1170-2595) | 1802 (764-2972) | 918 (472-1760) | 595 (321-972) | 407 (294-683) | 410 (230-627) |
| China female17 | NA | 1908 (1433-2546) | 1967 (1042-3160) | 929 (530-1837) | 633 (339-1037) | 489 (299-857) | 442 (276-654) |
| Netherland16 | 1800 (900-3900) | 3100 (1600-6000) | 2700 (1100-6400) | 1300 (200-7500) | 800 (300-2300) | 700 (200-2500) | 600 (200-1700) |
| Th Naïve cell (CD62L) | 1503 | 2177 | 1811 | 1578 | 957 | 632 | 564 |
| NIIH | 944-3371 | 875-2896 | 793-3181 | 791-2812 | 627-1570 | 388-1268 | 285-995 |
| Cameroon18 (CD62L) | 1201 (693-1589) | 1392 (798-2304) 1304 (453-2134) | 1541 (763-2538) | 708 (282-1559) | 665 (395-1334) | NA | NA |
| Tc Naïve cell | 624 | 869 | 773 | 757 | 790 | 537 | 414 |
| NIIH | 418-1206 | 434-1135 | 410-1223 | 437-1185 | 456-1293 | 306-844 | 244-829 |
| Euroflow1 | 200-1010 | 330-1841 | 564-1040 | 222-2178 | 126-1130 | 175-730 | 94-986 |
| USA7 | NA | 730 (380-1300) 740 (450-1200) | 700 (330-1200) | 760 (400-1400) | 540 (260-850) | 410 (200-650) | 300 (170-560) |
| China male17 | NA | 800 (503-1276) | 909 (535-1677) | 653 (356-1095) | 462 (297-730) | 380 (245-657) | 375 (231-568) |
| China female17 | NA | 741 (484-1009) | 726 (461-1235) | 589 (295-971) | 447 (293-768) | 387 (232-665) | 328 (210-560) |
| Netherland16 | 360 (23-1300) | 690 (290-1650) | 580 (140-2460) | 310 (30-3100) | 240 (53-1100) | 240 (42-1300) | 220 (78-640) |
| Tc Naïve cell (CD62L) | 656 | 823 | 754 | 821 | 791 | 633.5 | 470 |
| NIIH | 419-1146 | 369-1169 | 374-1307 | 506-1243 | 405-1233 | 301-991 | 230-653 |
| Cameroon18 (CD62L) | 457 (91-826) | 545 (272-809) 404 (219-757) | 524 (236-1042) | 330 (120-555) | 384 (156-641) | NA | NA |
| B cell | 628 | 1912 | 1405 | 1124 | 815 | 440 | 556 |
| NIIH | 255-972 | 240-2636 | 715-2531 | 718-2007 | 510-1662 | 286-924 | 273-813 |
| India14,29 | 518 (366-697) | 1654 (351-5946) | 1915 (523-3799) | 1484 (246-4139) | 1187 (362-2754) | 653 (295-1650) | 507 (115-1117) |
| Euroflow1 | 347-1053 | 470-4327 | 896-2316 | 353-2300 | 232-1637 | 157-725 | 173-1194 |
| USA7 | NA | 1550 (430-3000) | 1520 (610-2600) | 1310 (720-2600) | 750 (390-1400) | 480 (270-860) | 300 (110-570) |
| Cameroon18 | 552 (85-853) | 1525 (513-3748) 1940 (696-3370) | 1858 (662-2870) | 1526 (487-2066) | 965 (432-1691) | NA | NA |
| India19 | 1175.7 (61-2447.5) | 1537.9 (860-2215.8) | 746.3 (25-1809) | 719.3 (88-1576.8) | 776.9 (56-1697.3) | NA | NA |
| China7 | NA | 1185 (113-2317) | 1254 (522-2175) | 839 (359-2037) | 443 (231-910) | 347 (154-685) | 312 (141-534) |
| Netherlands16 | 540 (140-2000) | 1100 (520-2300) | 940 (110-7700) | 760 (160-3700) | 490 (180-1300) | 290 (100-800) | 300 (120-740) |
| Italy6 | NA | 1032 (315-1383) | 1123 (776-2238) | 1152 (733-1338) | 730 (434-1274) | 403 (276-640) | 321 (173-685) |
| Netherland16 | NA | 1623 (961-3679) | 1717 (571-3680) | 1157 (686-1732) | 593 (278-1022) | 338 (116-555) | 284 (119-578) |
| NK cell | 250 | 338 | 297 | 342 | 325 | 258 | 238 |
| NIIH | 69-1412 | 220-779 | 84-1237 | 144-565 | 130-636 | 90-679 | 110-437 |
| India14,29 | 760 (450-1059) | 489 (114-1624) | 433 (105-1088) | 368 (114-1201) | 335 (131-1163) | 362 (124-1005) | 334 (78-774) |
| Euroflow1 | 200-1305 | 167-1359 | 237-1146 | 104-2436 | 138-1759 | 106-1348 | 109-1021 |
| USA7 | NA | 420 (170-1100) | 400 (160-950) | 360 (180-920) | 300 (130-720) | 230 (100-480) | 190 (70-480) |
| Italy6 | NA | 408 (208-1700) | 381 (230-801) | 296 (186-724) | 299 (155-565) | 262 (120-483) | 230 (87-504) |
| Cameroon18 | 496 (135-969) | 546 (262-1030) 450 (140-1229) | 504 (109-831) | 397 (151-848) | 333 (133-1042) | NA | NA |
| China17 | NA | 446 (168-1156) | 505 (179-1522) | 499 (166-1669) | 418 (181-1000) | 394 (119-1077) | 424 (121-1064) |
| Netherlands16 | 120 (500-3100) | 440 (97-1990) | 500 (71-3500) | 470 (55-4000) | 180 (61-510) | 200 (70-590) | 330 (92-1200) |
| Activated Th 4/DR | 7 | 45 | 53 | 35 | 27 | 31 | 39 |
| NIIH | 2-24 | 32-120 | 22-76 | 16-117 | 17-97 | 17-64 | 13-67 |
| Cameroon18 | 21 (9-82) | 75 (56-164) 74 (29-155) | 77 (45-209) | 70 (29-127) | 65 (34-122) | NA | NA |
| USA7 | NA | 150 (60-280) | 120 (50-260) | 130 (70-280) | 90 (50-180) | 70 (40-120) | 60 (30-100) |
| Activated Tc 8/DR | 3 | 142 | 101 | 108 | 41.5 | 50 | 50 |
| NIIH | 1-8 | 13-295 | 14-263 | 21-209 | 14-195 | 20-124 | 9-139 |
| Cameroon18 | 6 (2-25) | 34 (8-287) 45 (13-324) | 102 (30-342) | 81 (21-216) | 77 (39-307) | NA | NA |
| USA7 | NA | 80 (30-170) | 90 (40-290) | 180 (60-600) | 140 (70-420) | 90 (40-270) | 70 (30-180) |
| TCRgd+T cell | 68 | 191 | 246 | 206 | 241 | 189 | 189 |
| NIIH | 26-174 | 119-545 | 73-558 | 135-340 | 133-406 | 97-390 | 64-353 |
| Euroflow1 | 18-121 | 25-435 | 128-335 | 86-537 | 44-784 | 66-416 | 56-332 |
| Netherlands16 | 87 (30-250) | 170 (56-510) | 210 (70-630) | 160 (41-640) | 160 (27-960) | 160 (27-960) | 150 (39-540) |
| China male17 | 97 (51-240) | 141 (92-279) | 238 (128-436) | 267 (114-539) | 233 (124-410) | 210 (124-388) | 198 (81-343) |
| China female17 | 139 (71-356) | 187 (94-301) | 205 (143-409) | 283 (128-520) | 243 (134-428) | 234 (121-462) | 176 (85-358) |
| DNT gd-/ab+T | 26 | 51 | 59 | 88 | 85 | 45 | 40 |
| NIIH | 14-56 | 17-149 | 30-105 | 42-137 | 48-125 | 30-90 | 26-65 |
| Euroflow1 | 0-37 | 9-66 | 15-73 | 20-141 | 3-104 | 13-80 | 8-53 |
| Netherlands16 | 28 (10-79) | 22 (5.5-140) | 33 (11-100) | 48 (13-170) | 47 (16-140) | 32 (1-100) | 27 (9-78) |
| China male17 | 20 (11-26) | 18 (11-45) | 29 (16-58) | 27 (9-57) | 23 (4-55) | 26 (13-48) | 23 (12-37) |
| China female17 | 17 (6-35) | 23 (13-38) | 37 (19-72) | 31 (16-58) | 26 (4-49) | 23 (12-41) | 22 (13-44) |
| Th RTE | 1297 | 1905 | 1625 | 1375 | 806 | 570 | 459 |
| NIIH | 842-2911 | 766-2563 | 593-2977 | 701-2388 | 522-1456 | 342-1126 | 227-860 |
| Spain3 | NA | 1440 (600-2700) | 1440 (600-2700) | 1440 (600-2700) | 800 (600-1600) | 590 (300-1000) | 520 (300-700) |
| Netherlands16 | 1700 (710-4200) | 2700 (1400-5200) | 2200 (800-6200) | 1100 (170-7400) | 710 (190-2600) | 590 (200-1700) | 480 (150-1500) |
Data of absolute numbers represented as median and (10th to 90th) or (5-95th) percentiles. Data sources: NIIH-this study, Euroflow1; Netherlands16; China17; Spain3; Italy6; Cameroon18; India Thakar et al.14; India Prabhu et al.29; India Narula et al.19; Thakur et al: from 0 to 16 yr; Prabhu et al: CB. NA, not available; NIIH, National Institute of Immuno Haematology; CB, cord blood, RTE, recent thymic emigrants; DNT, double negative T; gd, gamma delta; TCRgd, T cell receptor gd; Tc, T cytotoxic; Th, T helper; HLADR, human leukocyte antigen DR
Due to the relative lymphocytosis in healthy infants, the corresponding Th and Tc cell counts were elevated for a year and then declined with age. Naïve T-cells can be identified using a combination of various markers such as CCR7, CD62L, CD27, CD28 and CD45RA30. We used a combination of CD62L and CD27 with CD45RA. Using unpaired t test, we found no significant difference between naïve helper and naïve cytotoxic populations gated on CD27 and CD62L, but memory and effector group sub-populations did show a difference (Supplementary Table IV). Thus, naïve T cells can be identified using any of the markers along with CD45RA. Our data are consistent with known effects of development, including lower naïve Th and Tc cells and accumulating T cell subsets with a memory phenotype3,16. It reflects a gradual decline in the naïve T cells due to ageing and thymic involution and also the increased immunological memory due to exposure to environmental antigens 31. In the absence of newborn screening for SCID in India, flow cytometric assessment of naïve T cells in suspected cases provides a mechanism for prompt diagnosis while awaiting molecular confirmation.
| t test | CD4 | CD8 | ||||||
|---|---|---|---|---|---|---|---|---|
| Naive | CM | EM | TEMRA | Naive | CM | EM | TEMRA | |
| CB | 0.788 | 0.1222 | <0.0001 | <0.0001 | 0.9941 | 0.0054 | 0.0064 | 0.0084 |
| 0-6 months | 0.4916 | 0.6512 | 0.052 | 0.2518 | 0.8375 | 0.7936 | 0.625 | 0.9072 |
| 6-12 months | 0.6982 | 0.1677 | 0.0009 | 0.0387 | 0.9156 | 0.06 | 0.2484 | 0.7008 |
| 1-2 yr | 0.8901 | 0.1166 | <0.0001 | 0.0619 | 0.814 | 0.0517 | 0.0027 | 0.7298 |
| 2-5 yr | 0.3292 | 0.0009 | <0.0001 | 0.0007 | 0.8584 | 0.0978 | 0.0088 | 0.9822 |
| 5-10 yr | 0.1465 | 0.0051 | <0.0001 | 0.0236 | 0.3236 | 0.0854 | 0.0005 | 0.0037 |
| 10-16 yr | 0.2209 | 0.0783 | <0.0001 | 0.6732 | 0.9839 | 0.0848 | 0.0337 | 0.4895 |
The boxes highlighted in yellow represents non-significant differences. CM, central memory; EM, effector memory; TEMRA, terminally differentiated effector memory re-expressing CD45RA; CB, cord blood
TCRgd+ T cell relative percentages reportedly increase with age, as seen in other populations. The absolute counts have been shown to increase up to 10 years of age followed by a decline, as seen in the Chinese population. The median cell count was found to be higher compared to the European population but was similar to that of the Chinese, suggesting an increased exposure to pathogens in the Asian population compared to Europeans16,17.
Naive B cells have been shown to predominate in the peripheral B cell pool during infancy, and the fraction of class-switched and non-switched memory B cells increases gradually with age. B memory cell percentage rises until 10 yr of age followed by a marginal decrease similar to that of the European population32,33. The absolute count reportedly increases for two years after which there is a decline32.
NK cell subsets were relatively stable overall. Previous studies have shown that diseases like XLP, SAP deficiency, have low NKT cell28, whereas activated HLA-DR is increased in severe COVID -19 patients34. In our study we present the range for NKT cells and activated HLA-DR expression ranges for healthy children which can be used in such diseases.
The present study has a few limitations; the most important being the low sample size in the younger age group and lack of consideration of region-wise variability as the study was single centric. We relied mostly on pre-surgical samples of benign procedures for the younger age group because it was difficult to get samples from these groups due to hesitation from parents to consent. A recent study from India and several international publications have shown no significant difference between males and females; thus, we did not compare our data separately5,14,16,17. Furthermore, we could not assess few T cells subsets such as Tregs, T follicular helper and Th1, Th2, Th17 and B cell subsets such as plasmablasts and transitional B cells.
Overall, this study provides preliminary data that justify the need for future large-scale multi-centric studies to generate a reference range for interpreting extended immunophenotyping profiles in the paediatric age group, making it possible for clinicians to assess the immunological status in IEI, infectious and autoimmune diseases.
Financial support and sponsorship
This study received funding from the Indian Council of Medical Research, New Delhi (F NO.61/02/2012/IMM-BMS).
Conflicts of interest
None.
Supplementary Fig. 1
Supplementary Fig. 1 Consort diagram of inclusion of participants.Supplementary Fig. 2
Supplementary Fig. 2 Application of age-matched ranges in diagnosing clinically suspicious IEI. IEI, inborn errors of immunityAcknowledgment:
Authors acknowledge Shri Govind, BJ Wadia hospital for assitance in sample collection, Shrimati Sonal Narkar and Kamble, RM Bhatt High School for allowing us to conduct a school camp for sample collection and, Drs Jahnavi Aluri and Snehal Shabrish for their scientific inputs throughout the study.
References
- The EuroFlow PID orientation tube for flow cytometric diagnostic screening of primary immunodeficiencies of the lymphoid system. Front Immunol. 2019;10:246.
- [Google Scholar]
- Human inborn errors of immunity:2019 update on the classification from the International Union of Immunological Societies Expert Committee. J Clin Immunol. 2020;40:24-64.
- [Google Scholar]
- Extended immunophenotyping reference values in a healthy pediatric population. Cytometry B Clin Cytom. 2019;96:223-33.
- [Google Scholar]
- Age-related lymphocyte subset changes in the peripheral blood of healthy children –A meta-study. Transfus Med Hemother. 2007;34:176-81.
- [Google Scholar]
- Reference ranges of lymphocyte subsets balanced for age and gender from a population of healthy adults in Chongqing District of China. Cytometry B Clin Cytom. 2016;90:538-42.
- [Google Scholar]
- Lymphocyte subsets in healthy children from birth through 18 years of age: The Pediatric AIDS Clinical Trials Group P1009 study. J Allergy Clin Immunol. 2003;112:973-80.
- [Google Scholar]
- Reference values for a panel of cytokinergic and regulatory lymphocyte subpopulations. Immune Netw. 2016;16:344-57.
- [Google Scholar]
- Diagnostic approach to primary immunodeficiency disorders. Indian Pediatr. 2013;50:579-86.
- [Google Scholar]
- Primary immunodeficiency disorders in India –A situational review. Front Immunol. 2017;8:714.
- [Google Scholar]
- Age-related changes in blood lymphocyte subsets of south Indian children. Natl Med J India. 2003;16:249-52.
- [Google Scholar]
- Establishment of reference CD4+T cell values for adult Indian population. AIDS Res Ther. 2011;8:35.
- [Google Scholar]
- Reference ranges for lymphocyte subsets in adults from western India: Influence of sex, age and method of enumeration. Indian J Med Sci. 2008;62:397-406.
- [Google Scholar]
- Reference ranges of different lymphocyte subsets in Indian children: A multi-centric study. Indian Pediatr. 2021;58:424-9.
- [Google Scholar]
- Paediatric reference values for the peripheral T cell compartment. Scand J Immunol. 2012;75:436-44.
- [Google Scholar]
- Reference values for peripheral blood lymphocyte subsets of healthy children in China. J Allergy Clin Immunol. 2018;142:970-3.e8.
- [Google Scholar]
- Reference values of lymphocyte subsets in healthy, HIV-negative children in Cameroon. Clin Vaccine Immunol. 2011;18:790-5.
- [Google Scholar]
- Age-related reference intervals for immunoglobulin levels and lymphocyte subsets in Indian children. Indian J Pathol Microbiol. 2017;60:360-4.
- [Google Scholar]
- Clinical, immunological, and molecular findings in 57 patients with severe combined immunodeficiency (SCID) from India. Front Immunol. 2019;10:23.
- [Google Scholar]
- Application of flow cytometry in primary immunodeficiencies: Experience from India. Front Immunol. 2019;10:1248.
- [Google Scholar]
- Clinical, immunological and genomic characteristics of children with X-linked agammaglobulinemia from Kerala, South India. Hum Immunol. 2022;83:335-45.
- [Google Scholar]
- CD8+T cells exhibit an exhausted phenotype in hemophagocytic lymphohistiocytosis. J Clin Immunol. 2021;41:1794-803.
- [Google Scholar]
- Lymphopenia and severe combined immunodeficiency (SCID) –Think before you ink. Indian J Pediatr. 2019;86:584-9.
- [Google Scholar]
- EuroFlow standardized approach to diagnostic immunopheneotyping of severe PID in newborns and young children. Front Immunol. 2020;11:371.
- [Google Scholar]
- Hyperactive mTOR pathway promotes lymphoproliferation and abnormal differentiation in autoimmune lymphoproliferative syndrome. Blood. 2016;128:227-38.
- [Google Scholar]
- Flow cytometric-based analysis of defects in lymphocyte differentiation and function due to inborn errors of immunity. Front Immunol. 2019;10:2108.
- [Google Scholar]
- Comparison of human neonatal and adult blood leukocyte subset composition phenotypes. PLoS One. 2016;11:e0162242.
- [Google Scholar]
- Guidelines for the use of flow cytometry and cell sorting in immunological studies. Eur J Immunol. 2017;47:1584-797.
- [Google Scholar]
- Establishment of normative ranges of the healthy human immune system with comprehensive polychromatic flow cytometry profiling. PLoS One. 2019;14:e0225512.
- [Google Scholar]
- B cell subsets in healthy children: Reference values for evaluation of B cell maturation process in peripheral blood. Cytometry B Clin Cytom. 2010;78:372-81.
- [Google Scholar]
- B-cell subpopulations in children: National reference values. Immun Inflamm Dis. 2014;2:131-40.
- [Google Scholar]
- Natural killer cell immunotypes related to COVID-19 disease severity. Sci Immunol. 2020;5:eabd6832.
- [Google Scholar]


