Translate this page into:
Need for a nomogram of renal sizes in the Indian population–findings from a single centre sonographic study
Reprint requests: Dr. Prakash Muthusami, Department of Imaging Sciences & Interventional Radiology Sree Chitra Tirunal Institute for Medical Sciences & Technology, Thiruvananthapuram 695 011, India e-mail: prakashmuthusami@gmail.com
-
Received: ,
This is an open-access article distributed under the terms of the Creative Commons Attribution-Noncommercial-Share Alike 3.0 Unported, which permits unrestricted use, distribution, and reproduction in any medium, provided the original work is properly cited.
This article was originally published by Medknow Publications & Media Pvt Ltd and was migrated to Scientific Scholar after the change of Publisher.
Abstract
Background & objectives:
Renal size is an important parameter used in the diagnosis and follow up of renal diseases. However, while making decisions, clinicians must be aware of the dependence of these dimensions on the ethnicity of the individual, independent of anthropometric indices. There is no established nomogram for renal sizes in the Indian population. The aim of this study was to assess the applicability of oft-quoted ranges of normal renal sizes in our population.
Methods:
Renal dimensions including length, width and parenchymal thickness were sonographically measured in 140 individuals with no renal disease. Analysis was done for differences due to age, gender and laterality. The correlation of renal dimensions with anthropometric parameters like weight, height, body mass index (BMI) and body surface area (BSA) was analyzed.
Results:
The means of length, width and parenchymal thickness of all 280 kidneys of 140 patients were 9.65 ± 0.63, 4.5 ± 0.42 and 2.04 ± 0.2 cm, respectively. There was a significant difference in parenchymal thickness between the right and left kidneys, while there was no significant right-left difference in length or width. Gender-wise analysis showed significant differences between male and female renal breadths but not length and parenchymal thickness. Age group-wise analysis showed significant decrease in renal length and parenchymal thickness beyond the seventh decade. There was a moderate positive correlation of bilateral renal length with body weight and BSA, and a weak positive correlation with body height and BMI.
Interpretation & conclusions:
Renal sizes in our population are in contrast to commonly quoted normal values in literature. Conclusions about renal sizes need to be made with reference to nomograms and should not be based upon data from other populations. We also present formulae whereby to derive renal sizes from anthropometric indices in our population.
Keywords
Anthropometric variables
kidney length
kidney volume
parenchymal thickness
renal ultrasound

Renal dimensions, especially length and volume, are considered surrogates for renal status in routine clinical evaluations123. Measuring kidney size using ultrasound is established as a reliable method in most clinical settings456. Ultrasound has been shown to have good accuracy as well as inter and intra-observer reproducibility for renal length measurement7891011, and a good correlation with different anthropometric variables81213. Renal volumes are commonly calculated from the renal sonographic dimensions169141516, but a few studies have shown a significant underestimation of true volumes using this method, with more reliable volumetry possible by computed tomography (CT) and magnetic resonance imaging (MRI)11417. Despite this, sonographic renal size estimation remains popular due to its availability, ease of performance, absence of contrast or ionizing radiation, less cost, portability and repeatability.
Renal size depends on different factors, including gender, body size and body mass index. Ethnic differences, perhaps partly due to the above variables, are expected4591819. While data on normal ranges for renal dimensions are available from Western literature1820, little data are available from the Indian subcontinent. A renal size of 9 cm, widely accepted as the cut-off to indicate irreversible renal disease in most populations510 is a size often seen in normal and healthy Indian adults. Considering that in most hospitals, important clinical decisions including renal failure determination, treatment follow up and transplant and biopsy related decisions are made based on sonographic dimensions, it is imperative to have benchmark parameters in our population. We undertook this prospective study to collect preliminary nomographic data on sonographic renal dimensions in healthy Indian adults.
Material & Methods
A total of 300 patients >18 yr of age were included in this prospective, cross-sectional study. This study was conducted between May 2010 and September 2011 in the department of Radiodiagnosis, Jawaharlal Institute of Postgraduate Medical Education and Research (JIPMER), Puducherry, India. Institutional ethical approval was obtained for the study protocol and written informed consent was taken from all participants. Participants included consecutive patients referred for ultrasound for non-renal indications. Sixty nine (23% of the patients were referred for a neck ultrasound, 96 (32%) for liver or biliary indications, 57(19%) for musculoskeletal ultrasounds and 78(26%) for miscellaneous indications). From this initial group, data were selected from those that complied with the following inclusion criteria: serum creatinine within last six months ≤ 1.5mg/dl, effective glomerular filtration rate (eGFR) calculated using the modification of diet in renal disease (MDRD) formula > 30 ml/min/m2, normotensive at the time of ultrasound examination (systolic blood pressure < 140 mmHg and diastolic blood pressure < 90 mmHg), and no acute or chronic disease capable of causing renal damage. Patients with symptoms suspect for kidney pathology or a history of renal disease including stone disease, patients with prior abdominal surgery for renal causes, pregnant women and patients with known diabetes or hypertension were excluded. Of the 300 patients, 173 fulfilled the inclusion criteria and were included in the study. During the conduction of the sonograms, five patients with unilateral kidneys, three with renal malpositions, two with horseshoe kidney, four with renal pole cysts, thirteen with previously undetected asymptomatic renal calculi, two with polycystic kidney disease, three with asymptomatic hydronephrosis and one patient with previously undetected pregnancy were excluded, yielding 140 patients for the final analysis.
All patients underwent an ultrasound of both kidneys, carried out by the same sonologist using the same ultrasound device (Toshiba Powervision 6000, Tokyo, Japan), with a 3.5MHz convex transducer. Patients were required to empty their bladders before the examination to prevent hydration-associated increase in renal length. Measurement techniques and parameters were defined before commencing the study and were as follows: renal length (L) referred to the longest pole to pole distance, measured in three positions (supine, supine lateral and prone) and averaged. Renal width (W) was defined as the maximum dimension in the transverse cross-section at the level of the renal hilum. The central echogenic region was to be included in measurements, if required. Parenchymal thickness (PT) was defined as the combined thickness of the cortex and medulla measured at the upper and lower poles and averaged.
The patients’ height (Ht) and weight (Wt) were measured immediately following the ultrasound examination. Height was measured without footwear, using a stadiometer. Body mass index (BMI) and body surface area (BSA) were calculated using the following formulae2122.
BMI = Wt/Ht2; BSA = 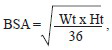 , where Wt is in kilograms and Ht is in meters.
Statistical analysis: Descriptive statistics were used for tendency and spread of the data. Differences between the left and right renal parameters were analyzed using the paired Student t-test while gender differences in mean of the different parameters were compared using the unpaired t-test. An association test was performed between renal lengths and anthropometric variables using the Pearson correlation coefficient. Variations in left and right renal dimensions between various age groups were compared using a one-way analysis of variance, followed by a post-hoc Tukey's test. Renal indices were calculated using the anthropometric values to normalize renal lengths (L/BMI and L/BSA) and their variations with age, gender and laterality were assessed. Data were analyzed with the GraphPad InStat 3.0 software program (GraphPad Software Inc., La Jolla, California, USA) and the VassarStat online tool (http://vassarstats.net).
Results
A total of 280 renal units in 140 patients were analyzed. There were 69 male and 71 female patients. The age ranged from 18 to 72 yr. The distribution of age in the study population was as follows: 37 patients (18-30 yr), 31 (31-40 yr), 32 (41-50 yr), 23 (51-60 yr), 16 (61-70 yr) and one patient (>70 yr). The creatinine values of the study group ranged from 0.3 to 1.4 mg/dl (mean 0.8 ± 0.24 mg/dl) and the eGFR values ranged from 44 to > 90 ml/min/m2 (mean 113.9 ± 55.4 ml/min/m2.
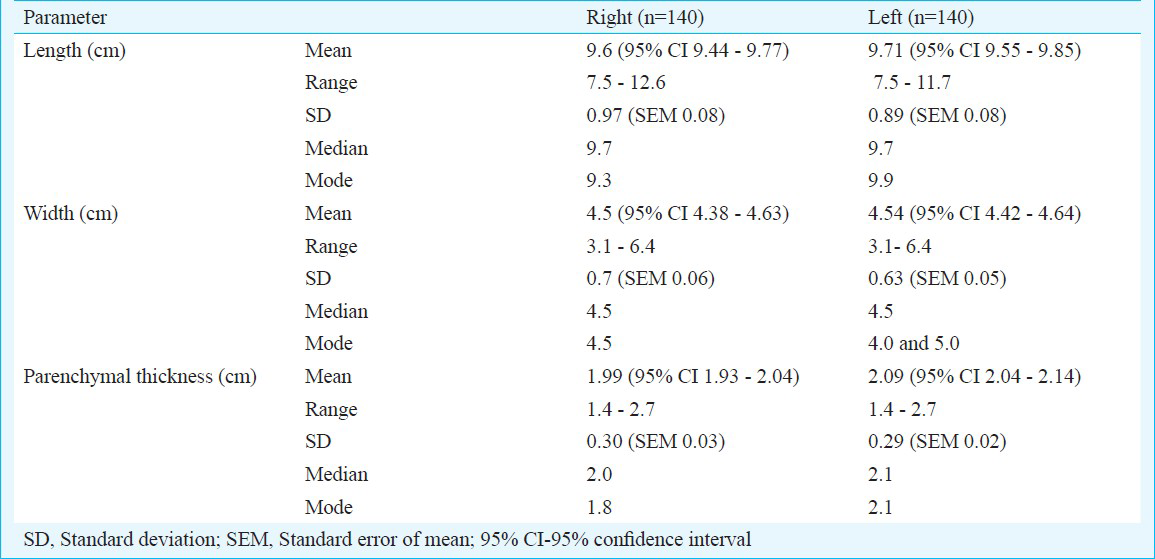
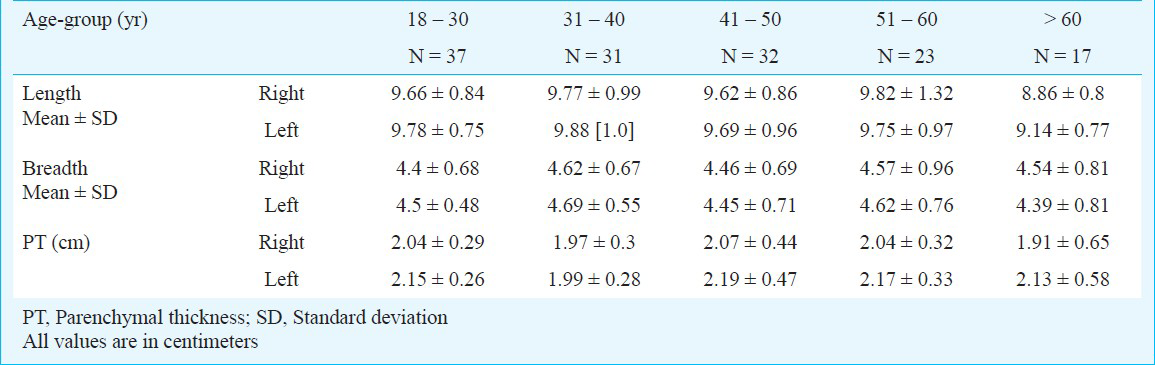
The mean length of all 280 kidneys in our study was 9.65 ± 0.63 cm, with a range of 7.5 – 12.6 cm. The mean renal width was 4.5 ± 0.42 cm (range 3.1 – 6.4 cm) and the mean parenchymal thickness was 2.04 ± 0.2 cm (range 1.4 – 2.7 cm). The renal dimensions are summarized in Table I. Significant difference (P<0.05) was noted in parenchymal thickness between the right and left kidneys, while there was no significant right-left difference in length or width.
Correlations between renal lengths and body indices namely height, weight, BSA and BMI, were individually assessed using Pearson's correlation coefficient, which showed a moderate positive correlation of renal length with body weight (r = 0.33 for right kidney and r = 0.31 for left kidney) and BSA (r = 0.35 for right kidney and r = 0.33 for left kidney), while there was a weak positive correlation with body height (r = 0.19 for both right and left kidneys) and BMI (r = 0.23 for right kidney and r = 0.21 for left kidney). These relations are depicted in Fig. 1. Multiple regression performed on these data gave the following equations for determining renal length from anthropometric parameters:
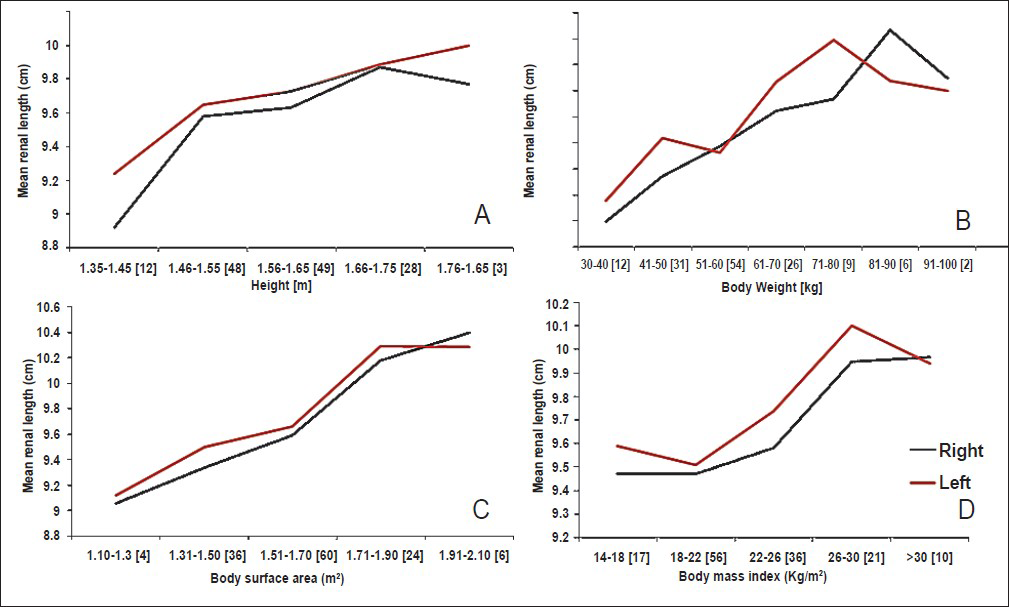
- Graphs representing the relationship of mean renal lengths without SD, plotted against various anthropometric parameters, namely, body height (A), body weight (B), body surface area (C), and body mass index (D). Numbers within parenthesis represent number of subjects in each subgroup.
Right renal length (cm) = 6.44 + 1.13 Height + 0.03 Weight
Left renal length (cm) = 6.94 +1.01 Height + 0.02 Weight
where weight is in kilograms and height is in meters.
One-way analysis of variance between means of renal parameters against age groups, showed a significant decrease in renal length and parenchymal thickness beyond the seventh decade only. An age-wise distribution of renal size is depicted in Fig. 2 and Table II. Renal lengths were then normalized to BSA and BMI yielding L/BSA and L/BMI respectively, whose distributions with age are depicted in Fig. 3. No significant difference was seen between right and left kidneys for either of these ratios.
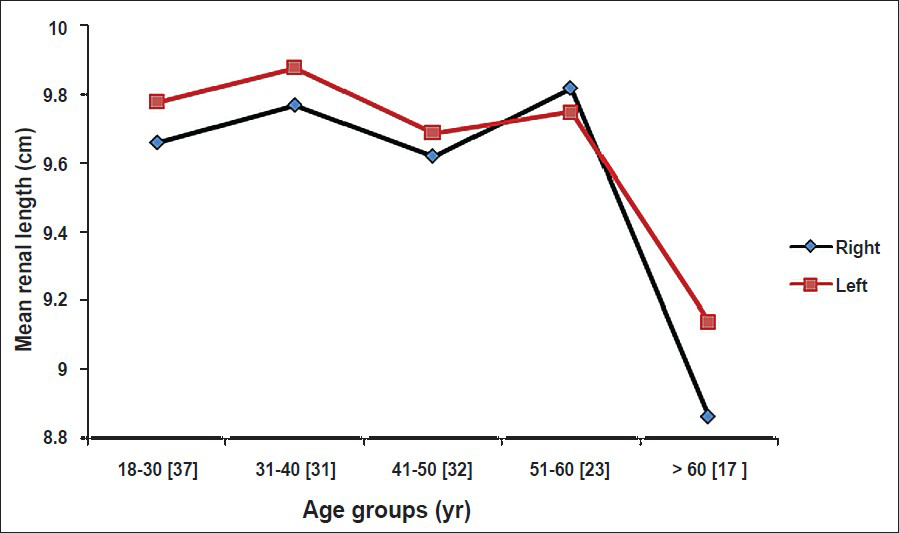
- Graph showing mean renal lengths, without SD, for various age-groups. Numbers within parenthesis represent number of subjects in each age-group.
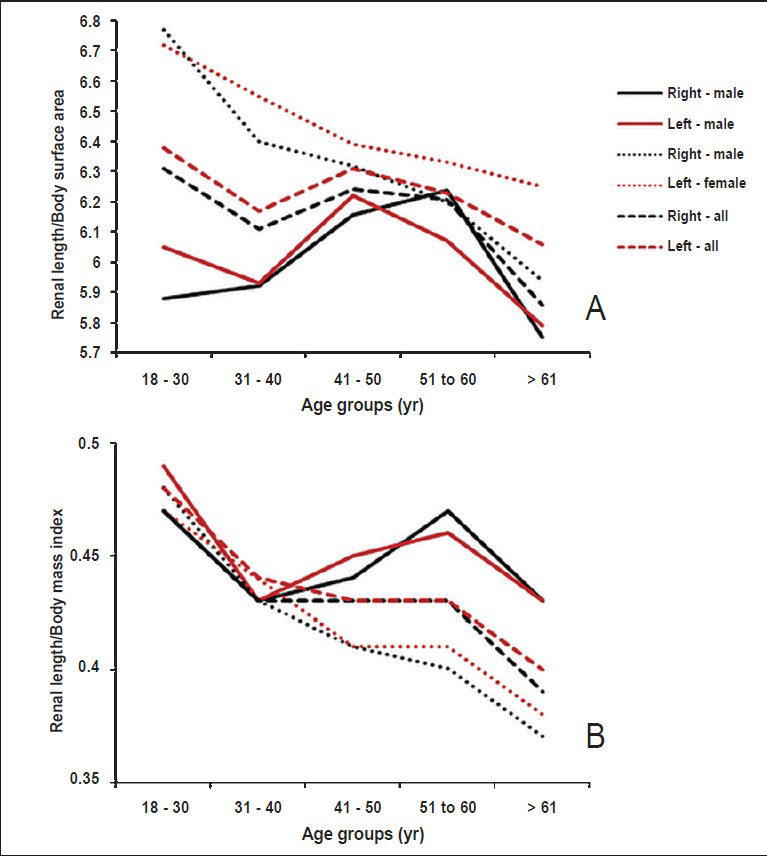
- Graphs showing the distribution of renal indices against age-groups, (A) Mean values without SD of renal length / body surface area and (B) mean values without SD of renal length / body mass index with age.
Significant gender differences were observed between renal breadths but not length and parenchymal thickness (for right renal length, P = 0.32, for left renal length, P = 0.69. For right renal breadth, P = 0.037, for left renal breadth P = 0.036. For right renal parenchymal thickness, P = 0.099, or left renal parenchymal thickness P = 0.087).
Discussion
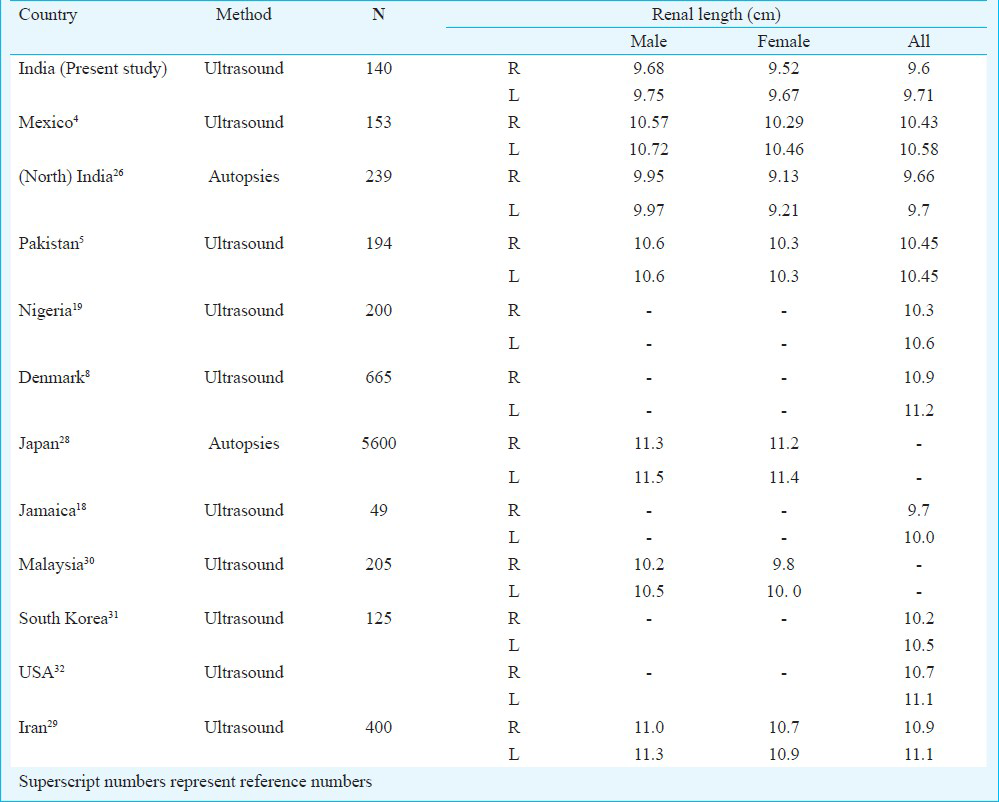
While most data available in literature on renal dimensions relate to paediatric kidneys7232425, there are limited data in adults. Our study showed that commonly quoted renal dimensions, largely derived from studies performed in Caucasian populations, were not applicable to the Indian people. Renal lengths in our study were quite similar to those obtained by a previous study26 from autopsies in north India, but in contrast to the values defined in literature from studies in other populations. Renal lengths in our population were smaller than those in the Caucasian population6814 and also those reported for Brazilian27, Korean8 and Japanese28 populations but were similar to the values reported from Pakistan5, Malaysia9, Nigeria19 and Jamaica18 (Table III).
How far the above can be ascribed to differences in height, weight, BSA, BMI and other anthropometric factors between races is debatable. It has been shown that relative renal length (renal length to body height ratio) is insensitive to sex and height differences and is thus a more reliable parameter than absolute renal length12. Similarly, renal lengths have been shown to have a positive correlation with body height, weight and BMI4 and this was seen in our study also. While the above trends might be true within each individual population or race, the same cannot be said about different populations with comparable anthropometric indices.
A moderate positive correlation was seen between anthropometric indices and renal length in out study. Unlike most other studies6812, we did not find significant difference between the mean left and right renal lengths. A key point in our study was the homogeneity of renal length that was noted across all age-groups in adults, with a significant decline in bilateral renal length after the age of sixty years. Some other studies have also shown that renal length gradually decreases with increase in age and this decrease accelerates after the seventh decade429. This finding has important implications in clinical decision making, and makes it unnecessary to correct renal sizes for age in adults till the age of sixty. Our study showed no significant gender-dependent difference in renal lengths unlike those studies which had shown such a sex difference61229. No sex difference has been shown in paediatric populations33. We, however, found a significant difference in parenchymal thickness of kidneys between the sexes. Whether these differences are race-dependent or mere statistical aberrations need to be found out in future studies.
The main strength of this study was that it was done prospectively with the intention of producing normal population data for sonographic renal dimensions. All sonograms were done by the same operator with a pre-defined technique to ensure maximal homogeneity, although this pre-empted measuring inter-observer variability. Intra-observer variability was reduced by averaging multiple readings. Care was also taken to ensure that none of the subjects were known diabetics or hypertensives, as these conditions and their treatment can affect kidney sizes. In spite of this, it remains a limitation of the study that the subjects included were patients with non-renal pathologies, and a study in a ‘healthy’ population is warranted. The low sample size could be a causal factor for not observing gender-dependent or right-left differences in renal length. Another limitation of our study was that it focused on linear renal parameters and did not involve the collection or calculation of renal volumetric data. The present findings indicate the need for, but cannot serve as a nomogram for the Indian population, for which large numbers of healthy individuals in each age group and across various Indian ethnicities will be required.
In conclusion, this pilot study provided data for normal sonographic renal dimensions in a south Indian population and derived equations to predict expected normal renal lengths from anthropometric values. These results also indicate the need for nomograms in the Indian population, irrespective of the association of renal dimensions with anthropometric values.
References
- Normal values for renal length and volume as measured by magnetic resonance imaging. Clin J Am Soc Nephrol. 2007;2:38-45.
- [Google Scholar]
- In renal transplantation, one size may not fit all. J Am Soc Nephrol. 1992;3:162-9.
- [Google Scholar]
- Can MR measurement of renal artery flow and renal volume predict the outcome of percutaneous transluminal renal angioplasty? Cardiovasc Interv Radiol. 2001;24:233-9.
- [Google Scholar]
- Ultrasonographic renal size in individuals without known renal disease. J Pak Med Assoc. 2000;50:12-6.
- [Google Scholar]
- Normal kidney size and its influencing factors - a 64-slice MDCT study of 1.040 asymptomatic patients. BMC Urol. 2009;9:19.
- [Google Scholar]
- Interobserver and intraobserver variations in sonographic renal length measurements in children. AJR Am J Roentgenol. 1991;156:1029-32.
- [Google Scholar]
- Kidney dimensions at sonography: correlation with age, sex, and habitus in 665 adult volunteers. AJR Am J Roentgenol. 1993;160:83-6.
- [Google Scholar]
- Comparison of renal size among different ethnicities. Int J Biol Biomed Eng. 2011;5:221-9.
- [Google Scholar]
- How reliable are ultrasound measurements of renal length in adults? Br J Radiol. 1995;68:1087-9.
- [Google Scholar]
- A comparative study of methods of estimating renal size in normal adults. Nephrol Dial Transplant. 1990;5:851-4.
- [Google Scholar]
- Sonographic measurement of absolute and relative renal length in adults. J Clin Ultrasound. 1998;26:185-9.
- [Google Scholar]
- Ultrasonographic determination of renal mass and renal volume. J Ultrasound Med. 1983;2:151-4.
- [Google Scholar]
- Renal volume measurements: accuracy and repeatability of US compared with that of MR imaging. Radiology. 1999;211:623-8.
- [Google Scholar]
- Noninvasive and direct measures of kidney size in kidney donors. Am J Kidney Dis. 2011;58:266-71.
- [Google Scholar]
- A sonographic study of kidney dimensions in a sample of healthy Jamaicans. West Indian Med J. 2000;49:154-7.
- [Google Scholar]
- Normal sonographic renal length in adult southeast Nigerians. Afr J Med Med Sci. 2005;34:129-31.
- [Google Scholar]
- Heritability, determinants and reference values of renal length: a family-based population study. Eur Radiol. 2013;23:2899-905.
- [Google Scholar]
- Adolphe Quetelet (1796-1874) - the average man and indices of obesity. Nephrol Dial Transplant. 2008;23:47-51.
- [Google Scholar]
- Observer variability in the sonographic measurement of renal length in childhood. Clin Radiol. 1992;46:344-7.
- [Google Scholar]
- Sonographic assessment of normal kidney dimensions in the first year of life--a study of 992 healthy infants. Pediatr Nephrol. 2007;22:1143-50.
- [Google Scholar]
- Sonographic measurement of renal size in normal Indian children. Indian Pediatr. 2012;49:533-6.
- [Google Scholar]
- Weight and measurements of kidneys in northwest Indian adults. Am J Hum Biol. 2001;13:726-32.
- [Google Scholar]
- Japanese reference man 1988-IV. Studies on the weight and size of internal organs of normal Japanese. Nihon Igaku Hoshasen Gakkai Zasshi. 1989;49:344-64.
- [Google Scholar]
- Sonographic measurement of absolute and relative renal length in healthy Isfahani adults. J Res Med Sci. 2004;9:54-7.
- [Google Scholar]
- Renal size in healthy Malaysian adults by ultrasonography. (Abstract) 1989. Med J Malaysia. 44:45-51. Available from: http://europepmc.org/abstract/MED/2696868
- [Google Scholar]
- A comparative study of methods of estimating kidney length in kidney transplantation donors. Nephrol Dial Transplant. 2007;22:2322-7.
- [Google Scholar]
- Ultrasound assessement of normal renal dimensions. Available from: http://www.jultrasoundmed.org/content/1/2/49.long
- [Google Scholar]
- The effect of malnutrition on kidney size in children. Pediatr Nephrol. 2007;22:857-63.
- [Google Scholar]


