
Translate this page into:
Lipid profile abnormalities & 10 yr risk of CVD assessment among adult in North East India: A cross-sectional study
For correspondence: Dr Rituparna Das, Department of Community Medicine, Agartala Government Medical College, Agartala 799 006, Tripura, India e-mail: drrituparnad@gmail.com
-
Received: ,
This article was originally published by Wolters Kluwer - Medknow and was migrated to Scientific Scholar after the change of Publisher.
Abstract
Background & objectives:
In India, lifestyle changes have contributed to increase in the number of people suffering from lipid profile abnormalities, which is a major risk factor for coronary artery diseases. The present study was aimed to estimate the prevalence of lipid profile abnormalities and 10 yr risk of cardiovascular disease (CVD) among the adult population in west Tripura district and to study the association of lipid profile abnormalities and increased CVD risk with sociodemography, body mass index (BMI), hypertension, random blood sugar (RBS) and haemoglobin level.
Methods:
This cross-sectional study was conducted amongst 445 adults of 20 to 60 yr of age from a randomly selected block in west Tripura district. The 10 yr risk of CVD was estimated using the Framingham Risk Assessment Tool.
Results:
The study revealed that overall 83.4 per cent adult population had lipid profile abnormalities, with 22.2, 42 and 70.3 per cent of participants having hypercholesterolaemia, hypertriglyceridaemia and low high-density lipoprotein level, respectively. Gender (P=0.02) and BMI (P<0.001) were the significant determinants of dyslipidaemia. Only 3.8 per cent of participants had intermediate or high risk of CVD, with all of them being males. Gender, age, occupation and RBS were significantly associated with increased CVD risk.
Interpretation & conclusions:
The study revealed a high burden of lipid profile abnormalities in the study population, with males having more risk of CVD. Hence, periodic screening of lipid profile abnormalities and risk of CVD should be incorporated at the primary care level to combat the CVD epidemic in India.
Keywords
CVD risk
Framingham Risk Assessment
hypercholesterolaemia
hypertriglyceridaemia
lipid profile
HDL
risk

Cardiovascular diseases (CVD) contribute up to 17.3 million deaths per year globally, which is estimated to reach 23.6 million deaths by the year 20301. Lipid profile abnormalities have been considered a major atherosclerotic modifiable risk factor for coronary artery diseases. In India, changes in lifestyle have contributed to an increase in the number of people suffering from lipid profile abnormalities2. Again, there is emerging evidence that in Asian Indians, premature CAD is occurring at least 10 yr earlier than in other ethnic groups3. Hence, estimation of CVD risk amongst adult population is vital for implementation of preventive strategies at an early age. In this regard, the Framingham Risk Score (FRS) serves as a simplified tool for predicting one’s chance of developing cardiovascular disease in the long term4.
In the northeastern State of Tripura, lipid profile abnormalities and coronary artery diseases are commonly encountered amongst adults, and also in the elderly, in clinical settings. However, there is limited information regarding its burden and risk of CVD; amongst the adult population of the state. Hence, the present study was conducted with the objective to estimate the prevalence of lipid profile abnormalities and 10 yr risk of CVD amongst the adult population in the west Tripura district. The study was aimed to assess the association of lipid profile abnormalities and increased CVD risk with sociodemography, body mass index (BMI), hypertension, random blood sugar (RBS) and haemoglobin (Hb) level.
Material & Methods
This was a community based cross-sectional study conducted by the department of Paediatrics, Agartala Government Medical College, Tripura, India, between August 2018 and July 2019, in a randomly selected Dukli RD block of west Tripura district. The study was approved by the Institutional Ethics Committee and informed consent was obtained from all the study participants.
The present study was conducted as a part of the multicentre investigation titled ‘Consumption pattern of food and food products/items high in fat, salt and sugar among selected cities/towns and rural population of India [HFSS (High fat salt sugar) study]’.
Inclusion and exclusion criteria: The study included adults between 20 and 60 yr of age, who consented to participate. Pregnant women, and those who were unfit to give valid information were excluded from the study.
Sample size: The sample size was estimated considering the prevalence of dyslipidaemia amongst adults to be 68.8 per cent5, at five per cent level of significance. Again, considering a design effect of 2 and a non-response rate of 20 per cent, the sample size was estimated at 420. However, the study included data collected from 445 adults residing in the area using pre-tested interview schedule. As the study area was dispersed over a large geographical setting with a considerable number of population; considering the feasibility of blood sample collection in clusters, cluster sampling was adopted in the study and 30 clusters were selected from the block using the PPS technique.
Risk scoring: The FRS was used for the assessment of the risk level of CAD over 10 yr4. The FRS considers six coronary risk factors: age, gender, total cholesterol, high density lipoprotein (HDL), smoking habits and systolic blood pressure separately for male and female participants for assigning risk score point and corresponding risk percentage6. Anthropometry was recorded for BMI and blood pressure (BP) measurements were interpreted as per the Joint National Committee 8 criteria7,8. For lipid profile estimation, 5 ml of venous blood was taken and serum cholesterol, triglyceride and HDL were estimated in AutoAnalyzer and interpreted using National Cholesterol Education Program, Adult Treatment Panel III criteria9. RBS was estimated using glucometer with strips and Hb was estimated using Sahli’s haemoglobinometer. Risks of developing CVD in the next 10 yr were interpreted using FRS and corresponding percentage as high risk: >20 per cent, intermediate risk: 10-19 per cent and low risk: <10 per cent9,10. Pre-existing coronary artery disease was ruled out in the study population based on medical history of the last one year for symptoms (chest pain, breathlessness, swelling of legs, etc.), and/or available documents of investigations, hospital admissions and medications suggesting coronary artery disease.
Statistical analysis: Data were entered in Epi Info v7.0 (Centers for Disease Control and Prevention, Atlanta, USA), and statistical analysis was performed using the Chi-square test, Fisher’s exact test and unpaired t test; P<0.05 was considered significant. .
Results
While about a third of the study participants belonged to 31 to 40 yr of age group (31.46%) and majority (82.47%) of them were females as female family members were more available for random selection at the family level during data collection. Sixty eight per cent study participants belonged to above poverty line category. The study revealed that overall, 83.4 per cent of the study participants had one or other types of lipid profile abnormalities. The prevalence of hypercholesterolaemia, hypertriglyceridaemia and low HDL level amongst adults was 22.2, 42 and 70.3 per cent, respectively (Table I).
| Lipid parameters | Frequency (n=445), n (%) |
|---|---|
| Cholesterol (mg/dl), mean±SD | 172.52±43.59 |
| Normal cholesterol level | 346 (77.8) |
| Hypercholesterolaemia | 99 (22.2) |
| orderline high | 74 (16.6) |
| High | 25 (5.6) |
| HDL (mg/dl), mean±SD | 43.59±12.59 |
| Normal HDL | 132 (29.7) |
| Low HDL | 313 (70.3) |
| Triglyceride (mg/dl), mean±SD | 154.72±68.93 |
| Normal triglyceride level | 258 (58) |
| Hypertriglyceridaemia | 187 (42) |
| Borderline high | 103 (23.1) |
| High | 84 (18.9) |
| Any lipid profile abnormality | 371 (83.4) |
Cholesterol level: Borderline high - 200-239 mg/dl, High - >200 mg/dl; Triglyceride level: Borderline high - 150-199 mg/dl, High - 200-499 mg/dl. SD, standard deviation; HDL, high density lipoprotein
Table II shows the factors associated with lipid profile abnormalities amongst study participants. The study revealed that females (85.8%) had a significantly higher burden of lipid profile abnormalities compared to males (71.8%; P=0.002). The lipid profile abnormalities had no significant association with age and the abnormalities were detected across all age groups, including those belonging to <30 yr of age. The mean BMI, RBS and Hb were significantly higher among those who had lipid profile abnormalities (P<0.001, respectively).
| Sociodemographic factors | Lipid profile abnormalities | P | |
|---|---|---|---|
| Present (n=371), n (%) | Absent (n=74), n (%) | ||
| Gender | |||
| Male | 56 (71.8) | 22 (28.2) | χ2=9.14, P=0.002 |
| Female | 315 (85.8) | 52 (14.2) | |
| Age group (yr) | |||
| <30 | 78 (83.9) | 15 (16.1) | χ2=2.86, P=0.418 |
| 31-40 | 111 (79.3) | 29 (20.7) | |
| 41-50 | 106 (86.9) | 16 (13.1) | |
| 51-60 | 76 (84.4) | 14 (15.6) | |
| Education | |||
| Illiterate | 79 (84.9) | 14 (15.1) | χ2=1.24, P=0.743 |
| Primary education | 75 (82.4) | 16 (17.6) | |
| Secondary and H/S | 204 (82.6) | 43 (17.4) | |
| Graduate and above | 13 (92.9) | 1 (7.1) | |
| Occupation | |||
| Homemaker | 255 (85.3) | 44 (14.7) | χ2=2.92, P=0.571 |
| Farmers/daily labour | 82 (78.8) | 22 (21.2) | |
| Businessmen or private job | 10 (83.3) | 2 (16.7) | |
| Government service | 11 (84.6) | 2 (15.4) | |
| Unemployed/student | 13 (76.5) | 4 (23.5) | |
| Socioeconomic status | |||
| APL | 253 (82.95) | 52 (17.04) | χ2=0.12, P=0.72 |
| BPL | 118 (84.28) | 22 (15.71) | |
| BMI affecting lipid profile abnormalities | |||
| BMI (mean±SD) | 28.98±5.45 | 23.75±3.34 | t=7.9, P=0.001 |
| Blood parameters by lipid profile abnormalities | |||
| RBS (mg/dl), mean±SD | 119.54±3.05 | 109.25±5.09 | t=23.29, P=0.001 |
| Hb (g/dl), mean±SD | 11.51±0.08 | 10.96±0.25 | t=34.53, P=0.001 |
P calculated using Chi-square or t test as appropriate. P<0.05 was considered as significant. APL, above poverty line; BPL, below poverty line; RBS, random blood sugar; BMI, body mass index; SD, standard deviation; Hb, haemoglobin
Figure shows the 10 yr cardiovascular risk among study participants and revealed that 2.9 per cent of participants had intermediate risk and 0.9 per cent had a high risk of CVD. Table III shows the descriptive comparison between the genders for the FRS related variables and revealed that the two groups differed significantly in terms of low HDL levels (P=0.02) and habit of tobacco smoking (P<0.001).
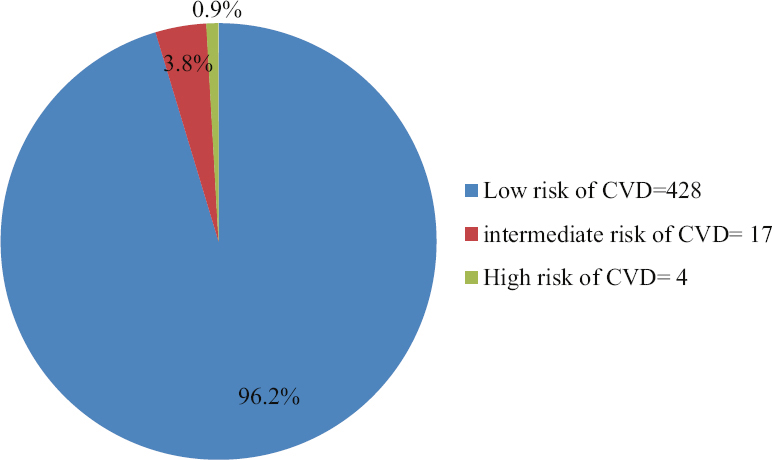
- Pie chart showing the 10 yr CVD risk among the study participants using Framingham Risk Assessment Tool. CVD, Cardiovascular disease.
| Parameters | Male (n=78), n (%) | Female (n=367), n (%) | P |
|---|---|---|---|
| Age group (yr) | |||
| 20-34 | 21 (26.9) | 113 (30.8) | χ2=8.88, P=0.17 |
| 35-39 | 12 (15.4) | 70 (19.1) | |
| 40-44 | 8 (10.3) | 37 (10.1) | |
| 45-49 | 16 (20.5) | 49 (13.4) | |
| 50-54 | 15 (19.2) | 43 (11.7) | |
| 55-59 | 3 (3.8) | 38 (10.4) | |
| 60 | 3 (3.8) | 17 (4.6) | |
| Cholesterol (mg/dl) | |||
| <160 | 37 (47.4) | 148 (40.3) | Fisher’s value=2.87, P=0.56 |
| 160-199 | 25 (32.1) | 136 (37.1) | |
| 200-239 | 14 (17.9) | 60 (16.3) | |
| 240-279 | 2 (2.6) | 14 (3.8) | |
| >280 | 0 | 9 (2.5) | |
| HDL (mg/dl) | |||
| >60 | 7 (9.1) | 37 (10.1) | χ2=9.82, P=0.02 |
| 50-59 | 7 (9.1) | 62 (16.9) | |
| 40-49 | 19 (24.7) | 127 (34.6) | |
| <40 | 44 (57.1) | 141 (38.4) | |
| Tobacco smoking | |||
| Non-smoker | 44 (56.4) | 365 (99.5) | χ2=160.3, P<0.001 |
| Smoker | 34 (43.6) | 2 (0.5) | |
| Systolic BP (mmHg) | |||
| <120 | 8 (10.3) | 84 (22.9) | χ2=7.74, P=0.17 |
| 120-129 | 29 (37.2) | 133 (36.2) | |
| 130-139 | 25 (32.1) | 91 (24.8) | |
| 140-159 | 14 (17.9) | 48 (13.1) | |
| >160 | 2 (2.6) | 11 (3) |
P value calculated using Chi-square or Fisher’s exact test as appropriate. P<0.05 was considered as significant.
Table IV shows the factors associated with 10 yr of risk of CVD using the Framingham Risk Assessment Tool. The study revealed that 21.8 per cent of males had intermediate or high risk of CVD, whereas all females were at low risk (P<0.001). There was an increased risk of CVD after 40 yr of age and the age of the participants was significantly associated with increased cardiovascular risk (P<0.001). Occupation was significantly affecting the risk of CVD (P<0.001), with homemakers at low risk of CVD. The mean RBS was found to be significantly high among those who are at intermediate/high risk of CVD (P<0.001).
| Parameters | Low risk (n=428), n (%) | Intermediate or high risk (n=17), n (%) | P |
|---|---|---|---|
| Gender | |||
| Male | 61 (78.2) | 17 (21.8) | Fisher’s value=83.16, P<0.001 |
| Female | 367 (100) | 0 (0) | |
| Age group (yr) | |||
| ≤30 | 93 (100) | 0 (0) | Fisher’s value=21.09, P<0.001 |
| 31-40 | 140 (100) | 0 (0) | |
| 41-50 | 114 (93.4) | 8 (6.6) | |
| 51-60 | 81 (90.0) | 9 (10) | |
| Education | |||
| Illiterate | 89 (95.7) | 4 (4.3) | Fisher’s value=4.08, P=0.21 |
| Primary education | 88 (96.7) | 3 (3.3) | |
| Secondary and H/S | 239 (96.8) | 8 (3.2) | |
| Graduate and above | 12 (85.7) | 2 (14.3) | |
| Occupation | |||
| Homemaker | 299 (100) | 0 (0) | Fisher’s value=40.5, P<0.001 |
| Farmers/daily labour | 92 (88.5) | 12 (11.5) | |
| Businessmen or private job | 10 (83.3) | 2 (16.7) | |
| Government service | 11 (84.6) | 2 (15.4) | |
| Unemployed/student | 16 (94.1) | 1 (5.9) | |
| BMI (kg/m2), mean±SD | 28.26±4.17 | 24.35±2.17 | t=0.16, P=0.86 |
| BP | |||
| Normotensive | 78 (100) | 0 | Fisher’s value=1.65, P=0.053 |
| Pre-hypertension and hypertension | 350 (95.4) | 17 (4.6) | |
| RBS, mean±SD | 116.17±2.5 | 159.70±26.02 | t=31.88, P=0.001 |
| Hb level (g/dl), mean±SD | 11.35±1.72 | 13.04±1.90 | t=3.9, P=0.001 |
P calculated using Fisher’s exact or t test as appropriate. P<0.05 was considered as significant.
Discussion
The present study showed that overall 83.4 per cent of the study participants had lipid profile abnormalities, with 22.2, 42 and 70.3 per cent adults having hypercholesterolaemia, hypertriglyceridaemia and low HDL level, respectively. However, according to the ICMR-INDIAB study, the overall prevalence of dyslipidaemia was 79 per cent with 13.9, 29.5, and 72.3 per cent population having hypercholesterolaemia, hypertriglyceridaemia and low HDL level, respectively11. Again, a study conducted by Raj et al5 in rural South India showed that the prevalence of dyslipidaemia was 68.8 per cent, whereas the burden of hypercholesterolaemia, hyper-triglyceridaemia and low HDL level was 25.1, 40 and 63.1 per cent, respectively. Thus, the present study recorded a higher burden of lipid profile abnormalities comparable to other parts of India.
In this study, no significant association of age was observed with lipid profile abnormalities, unlike studies conducted by Raj et al5 in south India and Sharma et al12 in Delhi where age was a significant determinant. A similar finding was also obtained from studies conducted in Jordan by Khader et al13 and in China by Zhang et al14. However, the present study showed that the lipid profile abnormalities were evenly distributed across all age groups, including those belonging to <30 yr of age, highlighting the prevalence of the condition in younger adults. The present study also highlighted a higher burden of lipid profile abnormalities among females, which might have happened as the majority of the females were homemakers and having sedentary lifestyles. Again, the present study could re-establish that high BMI was associated with lipid profile abnormalities.
Regarding the long term risk of CVD, the present study revealed that 3.8 per cent of participants had intermediate/high risk of CVD. A study conducted by Kadiyala et al15 in Mysuru, amongst adults >40 yr showed that one fifth of the population had moderate estimated risk and 7.4 per cent had very high risk of developing CVD event in the next 10 yr, according to the World Health Organization (WHO) risk prediction chart. The lower prevalence in the present study might be because the present study was conducted on adults up to 60 yr age. Noticeably, those belonging to >60 yr age group hold more risk score in Framingham risk assessment tool giving rise to higher prevalence. The present study also showed that only males had intermediate or high risk of CVD, although the prevalence of dyslipidaemia was high amongst females. This could be due to the fact that 43.6 per cent of our male participants were smokers and smoking was an important contributory variable in FRSs. This study further identified significant association of high RBS and Hb levels with the risk of CVD. Association of CVD risk with Hb level might have occurred by play of chance in the present cross sectional study, as biologic plausibility of such association is currently lacking.
Despite high prevalence of dyslipidaemia in our study area, only 3.8 per cent participants featured in the category of long-term risk of CVD. This could be explained by the fact that this study excluded the elderly, and higher age carries more weightage in the Framingham risk scoring system compared to high cholesterol and HDL levels. This is a limitation of the FRS System. Other scoring systems such as atherosclerotic cardiovascular disease and WHO risk charts could have been used for better exploration of the risk of CVD in the adult population, but several studies revealed that these scores could not perform as good as FRS system16. Another limitation of the present study was that the random blood samples were used rather than the blood specimen collected at fasting state to estimate lipid profile and Hb level at community settings.
In conclusion, the present study revealed a high burden of lipid profile abnormalities in the study area with higher prevalence in females and across all age groups, including younger adults. The risk of CVD among adults was low and it was associated with age, gender, and high RBS. Awareness programmes on the risk of CVD and regular screening of the adult population for lipid profile abnormalities and CVD risk factors should be conducted on a periodic basis and incorporated at the primary health care level.
Financial support and sponsorship
The study was funded by the Indian Council of Medical Research, New Delhi (Grant no: 5/9/7/HFSS/2018-Nut).
Conflicts of interest
None.
Acknowledgment:
Authors acknowledge the local health bodies and ASHA workers for helping us during the study.
References
- Recent trends in epidemiology of dyslipidemias in India. Indian Heart J. 2017;69:382-92.
- [Google Scholar]
- Younger age of escalation of cardiovascular risk factors in Asian Indian subjects. BMC Cardiovasc Disord. 2009;9:28.
- [Google Scholar]
- Metabolic syndrome versus Framingham risk score for prediction of coronary heart disease, stroke, and type 2 diabetes mellitus. Arch Intern Med. 2005;165:2644-50.
- [Google Scholar]
- Prevalence of dyslipidemia in South Indian adults:An urban-rural comparison. Int J Community Med Public Health. 2016;3:2201-10.
- [Google Scholar]
- The Framingham risk score, diet, and inflammatory markers in Korean men with metabolic syndrome. Nutr Res Pract. 2012;6:246-53.
- [Google Scholar]
- 2014 evidence-based guideline for the management of high blood pressure in adults:report from the panel members appointed to the Eighth Joint National Committee (JNC 8) JAMA. 2014;311:507-20.
- [Google Scholar]
- Available from: https://www.nhlbi.nih.gov/files/docs/guidelines/atglance.pdf
- Prevalence of dyslipidemia in urban and rural India:The ICMR-INDIAB study. PLoS One. 2014;9:e96808.
- [Google Scholar]
- Dyslipidemia and associated risk factors in a resettlement colony of Delhi. J Clin Lipidol. 2013;7:653-60.
- [Google Scholar]
- Prevalence of dyslipidemia and its associated factors among Jordanian adults. J Clin Lipidol. 2010;4:53-8.
- [Google Scholar]
- The prevalence, awareness, treatment, and control of dyslipidemia in Northeast China:A population-based cross-sectional survey. Lipids Health Dis. 2017;16:61.
- [Google Scholar]
- Prevalence of risk factors and 10 year risk estimation of cardiovascular diseases among rural population of Mysuru, Karnataka. Int J Community Med Public Health. 2019;6:1178-85.
- [Google Scholar]
- Comparison of different cardiovascular risk score calculators for cardiovascular risk prediction and guideline recommended statin uses. Indian Heart J. 2017;69:458-63.
- [Google Scholar]


