
Translate this page into:
Inequity & burden of out-of-pocket health spending: District level evidences from India
For correspondence: Dr Samik Chowdhury, Institute of Economic Growth, New Delhi 110 007, India e-mail: samik141@gmail.com
-
Received: ,
This is an open access journal, and articles are distributed under the terms of the Creative Commons Attribution-NonCommercial-ShareAlike 4.0 License, which allows others to remix, tweak, and build upon the work non-commercially, as long as appropriate credit is given and the new creations are licensed under the identical terms.
This article was originally published by Medknow Publications & Media Pvt Ltd and was migrated to Scientific Scholar after the change of Publisher.
Abstract
Background & objectives:
Numerous studies have highlighted the regressive and immiserating impact of out-of-pocket (OOP) health spending in India. However, most of these studies have explored this issue at the national or up to the State level, with an associated risk of overlooking intra-State diversities in the health system and health-seeking behaviour and their implication on the financial burden of healthcare. This study was aimed to address this issue by analyzing district level diversities in inequity, financial burden and impoverishing impact of OOP health spending.
Methods:
A household survey of 62,335 individuals from 12,134 households, covering eight districts across three States, namely Gujarat, Haryana and Rajasthan was conducted during 2014-2015. Other than general household characteristics, the survey collected information on household OOP [sum total of expenditure on doctor consultation, drugs, diagnostic tests etc. on inpatient depatment (IPD), outpatient depatment (OPD) or chronic ailments] and household monthly consumption expenditure [sum total of monthly expenditure on food, clothing, education, healthcare (OOP) and others]. Gini index of consumption expenditure, concentration index and Kakwani index (KI) of progressivity of OOP, catastrophic burden (at 20% threshold) and poverty impact (using district-level poverty thresholds) were computed, for these eight districts using the survey data. The concentration curve (of OOP expenditure) and Lorenz curve (of consumption expenditure) for the eight districts were also drawn.
Results:
The distribution of OOP was found to be regressive in all the districts, with significant inter-district variations in equity parameters within a State (KI ranges from −0.062 to −0.353). Chhota Udepur, the only tribal district within the sample was found to have the most regressive distribution (KI of −0.353) of OOP. Furthermore, the economic burden of OOP was more pronounced among the rural sample (CB of 19.2% and IM of 8.9%) compared to the urban sample (CB of 9.4% and IM of 3.7%).
Interpretation & conclusions:
The results indicate that greater decentralized planning taking into account district-level health financing patterns could be an effective way to tackle inequity and financial vulnerability emerging out of OOP expenses on healthcare.
Keywords
District
health expenditure
healthcare
impoverishment
India
inequity
out-of-pocket

According to the National Health Accounts Estimates for India (2013-14), healthcare is predominantly financed through out-of-pocket (OOP) expenditure at the point of delivery of services1. High OOP expenses on healthcare leave households with lesser resources for other priorities, which could be vital for the quality of life. In addition, the treatment cost itself as a potential producer of poverty has resulted in studies on the ‘medical poverty trap’ in different country settings and under dissimilar health systems such as Ethiopia2, Indonesia3 Vietnam4, China5, Thailand6 and 14 other Asian countries7.
In India, several studies based on the National Sample Survey Organisation (NSSO) data891011 estimated that roughly 3.25-4 per cent of the population became poor because of healthcare payments. Smaller sample-based studies in the Indian context also endorse the findings from the NSSO data1213. Studies have also shown that treatment cost imposed a catastrophic burden on households, even if they might not have fallen below the poverty line141516. Health in India is a State subject with more than two-thirds of the total public (government) spending on health being incurred by State governments and the remaining by the Central Government117. While this could partly account for large differences in health outcomes and OOP expenditures across the States, the intrastate differences are often overlooked by researchers and policymakers.
Most of the studies on the burden of OOP health expenditure in India do not go beyond the State level. Very few studies18192021 have looked at intrastate patterns in OOP and its burden. This is particularly important because districts within a State display substantial variations in socio-demographic and economic profile of the residents as well as their health system characteristics, with possible impact on OOP health expenditure as well. This study was conducted to address this gap by exploring the association between household economic status and OOP health expenditure through a district-level analysis of data collected from a household survey during 2014-2015. The key research question addressed here was the extent to which the burden of OOP spending varied across districts within a State. The parameters studied included: (i) equity (progressivity), (ii) catastrophic burden, and (iii) impoverishment from OOP in eight districts from two economically developed States, namely Haryana and Gujarat, and a less developed State, Uttar Pradesh.
Material & Methods
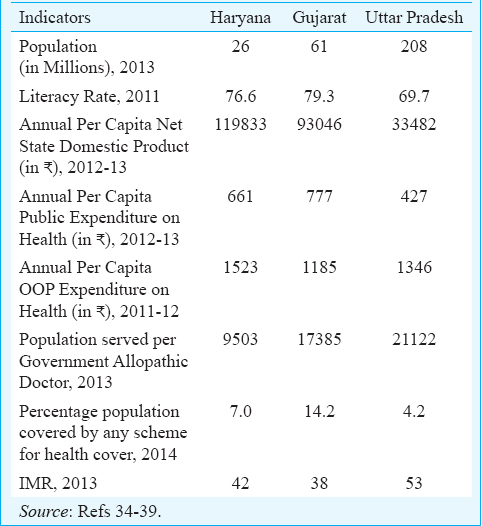
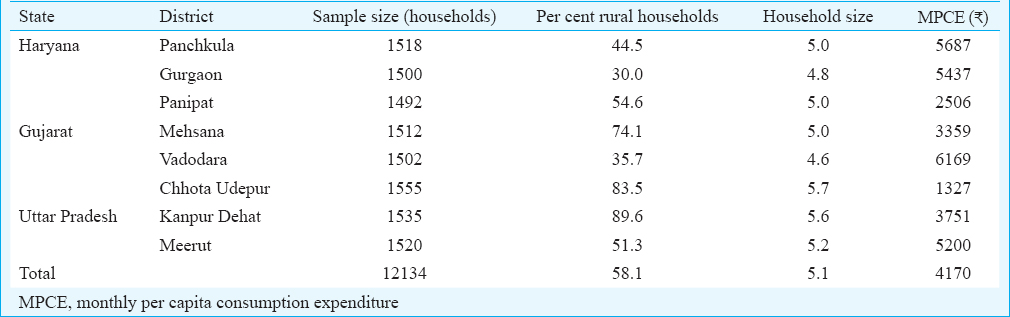
The household survey conducted during January 2014-September 2015 had a large sample size of 62,335 individuals from 12,134 households, covering eight districts across three States. Two of the three States, namely Haryana and Gujarat were selected on the basis of the location of study partners in this project. Haryana and Gujarat are economically developed States while the third State Uttar Pradesh is a less developed State based on their annual per capita Net State Domestic Product (Table I). Data collection through a structured questionnaire was done in collaboration with the School of Public Health, Postgraduate Institute of Medical Education and Research (PGIMER), Chandigarh, Indian Institute of Public Health, Gandhinagar and the Community Empowerment Research Association in the States of Haryana, Gujarat and Uttar Pradesh, respectively. Eight districts were selected from the three States, based on the rural-urban composition of population. The objective was to have a representation of districts that were, predominantly rural, predominantly urban and evenly mixed. In addition, in one of the States, viz. Gujarat, a tribal district was included in the sample. The name of the districts, corresponding States and some basic descriptive characteristics are shown in Table II.
An initial sample size of 1500 households was decided for each district, which was deemed sufficient, on the basis of the prevailing morbidity and hospitalization rates in the selected States, obtained from the 71st Round of National Sample Survey22. Practically, this was substantially higher than the NSS (71st Round) sample size for the largest (in terms of population) district (even State) selected in our study [The NSS (71st Round) sample size for the States are Haryana - 1424 households, Gujarat - 2888 households and Uttar Pradesh - 7921 households]. In the predominantly rural districts, a total of 10 per cent of the rural sub-centres were randomly sampled as Primary Sampling Units (PSU). Similarly, in predominantly urban districts, 10 per cent of the urban areas as enumerated for the Intensified Pulse Polio Immunization rounds were sampled as PSUs. In each PSU area, the sample was distributed in all the villages/urban settlements by probability proportional to size method. This was done by the investigators at the local level. Each village was next divided into four broad zones, and a zone out of these was randomly selected for data collection. Consecutive houses were approached for data collection in the selected zone after identifying a ‘ first house’. If all households in a particular zone of the village got surveyed, and still there was the desired sample to be completed from the village, the investigator moved on to the next zone in the village. This process continued till the required sample size in each category for a village was obtained.
Household responses were solicited against a structured questionnaire developed by the authors and validated before use. The tool contained both closed- and open-ended questions. The head of the household or the most knowledgeable adult member was the respondent, on behalf of the entire household. The questionnaire had separate sections on household level information, individual level demographic information, consumption expenditure, asset ownership, ailment episodes - nature of ailment, choice of treatment provider and component-wise disaggregated expenditure on inpatient, outpatient and chronic ailments.
OOP health expenditure was the sum total of expenditure on doctor consultation, drugs both from the hospital as well as purchased from the market, diagnostic tests, bed charges, personal medical appliances, transport, food and boarding expenses of escorts etc. on IPD, OPD or chronic ailments. The recall period for OPD episodes was two weeks, for chronic episodes was one month while for IPD episodes was 365 days. The aggregate expenditure of each household on these episodes was converted into a common reference period of one month to generate monthly OOP health expenditure of the household.
Total income of households was computed through a proxy i.e. consumption expenditure, which is a more reliable measure than income, which is often misreported. Total consumption expenditure is the sum total of expenditure on food, clothing, education, healthcare (OOP), rents and taxes, utilities, for example, water, fuel, electricity, transportation and miscellaneous. Each of these items had different recall periods in the survey questionnaire, but were converted into monthly estimates and then aggregated to generate household total consumption expenditure.
Progressivity of OOP health expenditure was evaluated for each of the eight districts. Progressivity is a vertical equity concept that measures the extent to which payment for healthcare is proportional to the ability to pay (ATP). A simple aggregative way to assess progressivity is to look for patterns in the share of OOP in total consumption expenditure of households, across consumption expenditure quintiles23.
We also estimated the Kakwani Index (KI)24, which is measured as twice the difference between the concentration index of OOP payments (COOP) and the Gini coefficient for income (consumption expenditure) (GCE). The KI has been used as a measure of progressivity of a health financing system25. A health financing system is considered progressive if health care payments (OOP in this case) account for an increasing proportion of ATP (total consumption expenditure in this case) as the latter rises. In regressive system, on the other hand, health care payments comprise a decreasing share of ATP as ATP rises. Technically, if OOP expenses are progressive, the concentration curve will lie below the Lorenz curve, and the KI will have a positive value. KI values range from −2 (most regressive) to +1 (most progressive).
Next, catastrophic spending and impoverishment were measured. OOP spending on health is believed to be catastrophic when it exceeds some threshold share of total household consumption expenditure and is considered as a key indicator of financial burden of health care262728. While the choice of threshold is somewhat arbitrary, 10-20 per cent of total consumption expenditure has been a common choice28293031 with the rationale that this represents an approximate share at which the household is forced to sacrifice other basic needs, sell productive assets, incur debt or be impoverished.
A household is considered to be impoverished on account of OOP health expenditure if its pre-payment (OOP) consumption expenditure lies below the poverty line while its post-payment consumption expenditure lies above the poverty line. In other words, if a household whose monthly per capita consumption expenditure (MPCE) is initially above the poverty line, falls below the line after deduction of per capita OOP expenditure (H) (from MPCE), then this household is said to be impoverished on account of OOP health expenses. Comparing the pre-payment poverty headcount (HCgross) with the post-payment poverty headcount (HCnet) gives the fraction of the population that falls into poverty as a result of OOP health expenditures28. Over the years in India, there has been a number of attempts to come up with an inclusive and representative poverty line, but each of these has been subjected to widespread public scrutiny3233. In this study, therefore, we have defined poverty line as the average MPCE of the bottom 20 per cent (first quintile) of the households in respective districts. These are, therefore, relative poverty lines which would be different for districts even within the same state.
Results
Table I presents some of the key macro indicators for the selected States from secondary data sources. Gujarat and Haryana were comparable in most of the indicators while Uttar Pradesh lagged behind. Gujarat had the highest proportion of population covered by any health expenditure support scheme twice that of Haryana and more than three times that of Uttar Pradesh.
Table II presents some basic statistics on the sample surveyed. The district with the highest household size was the tribal district of Chota Udepur from Gujarat. Wide variations existed in per capita consumption expenditure across districts with Vadodara at the top and Chhota Udepur with a fifth of Vadodara’ consumption, at the bottom.
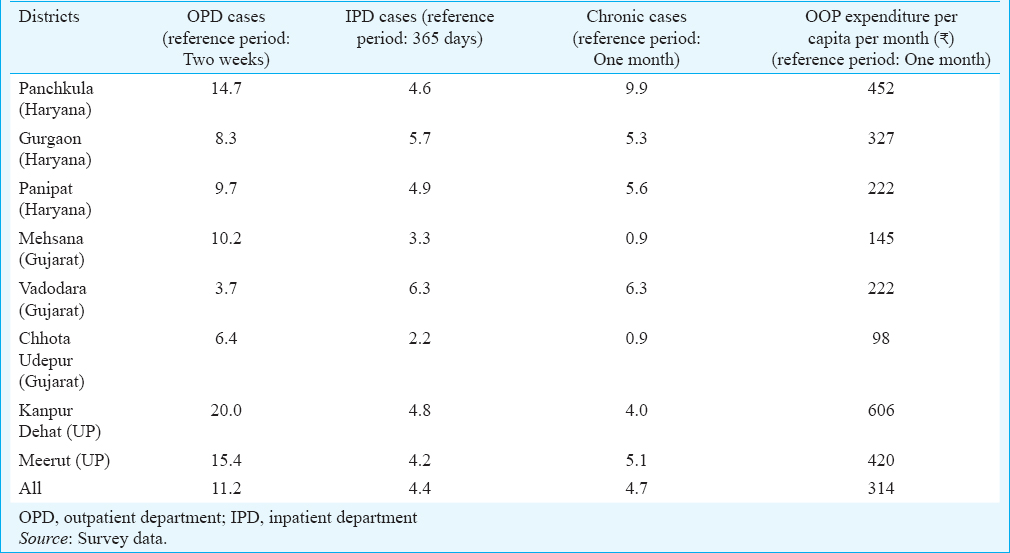
In general, outpatient department cases were higher than inpatient department cases in all districts
(Table III). The two districts of Uttar Pradesh, namely Meerut and Kanpur Dehat had a substantially high percentage of outpatient cases compared to the districts from other two States. The per capita OOP expenditure was also relatively higher in Uttar Pradesh. The distribution of chronic cases differed quite a bit, ranging from <1 per cent in Mehsana, Gujarat to almost 10 per cent in Panchkula, Haryana. Predominantly, urban districts had a higher percentage of chronic cases than others. As for OOP expenses, there was significant variation across districts.
Next, we looked at the percentage share of OOP in total consumption expenditure and its variations across economic classes to explore progressivity of the health financing systems. Fig. 1 displays this share for each expenditure quintile of the selected districts. The shares of OOP in consumption expenditure were the highest for the two districts from UP and the lowest for Vadodara and Mehsana in Gujarat. The figure shows a general decline in the OOP shares as we move from lower to higher expenditure quintiles. This was true for all the eight districts. This implies regressivity and a potential burden of OOP health expenditure for the poorer households vis-a-vis the richer ones.
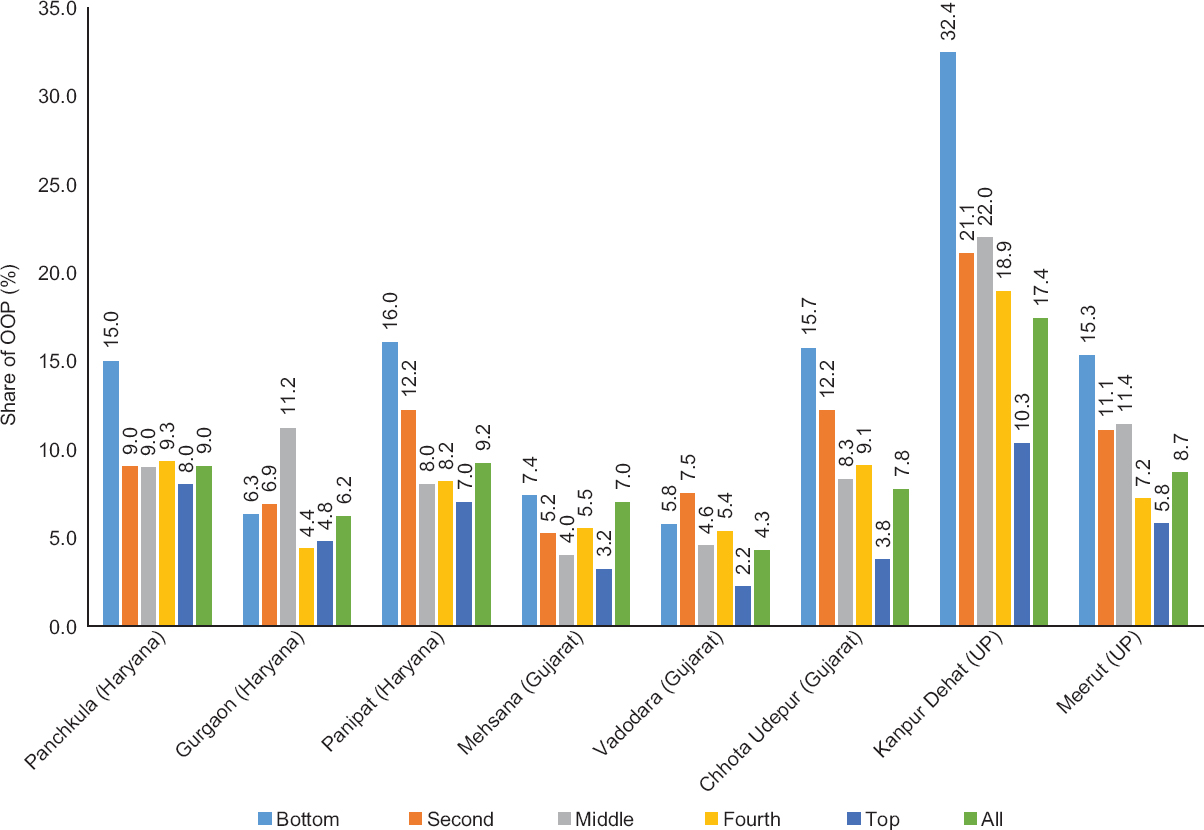
- Share of out- of- pocket in total consumption expenditure across quintiles. Note: Bottom, second, middle, fourth and top represents five (each 20%) consumption expenditure quintiles. Thus "bottom" implies bottom 20 per cent of the population in terms of their consumption expenditure, in each district. Similarly, "top" implies top 20 per cent of the population in terms of their consumption expenditure, in each district. “All” stands for the entire sample.
Fig. 2 plots the concentration curve of OOP health expenditure (red curve) along with the Lorenz Curve of consumption expenditure (blue line) for each district. The concentration curves of all but one district (Chhota Udepur) lied entirely below the 45° line indicating that the economically better off contributed a larger share of the total OOP expenditure in these districts. For Chhota Udepur, the concentration curve lied very close to the 45° line implying a near proportional contribution to total OOP expenditure in the district i.e. bottom 10 per cent of the population (in terms of their share in total consumption expenditure of the district) contributed around 10 per cent of the aggregate OOP spending by the district, and similarly for the other deciles. While proportionality might be construed as an indicator of fairness under other settings, in case of OOP it is not, especially when viewed in conjunction with the socio-economic differences in care-seeking behaviour.
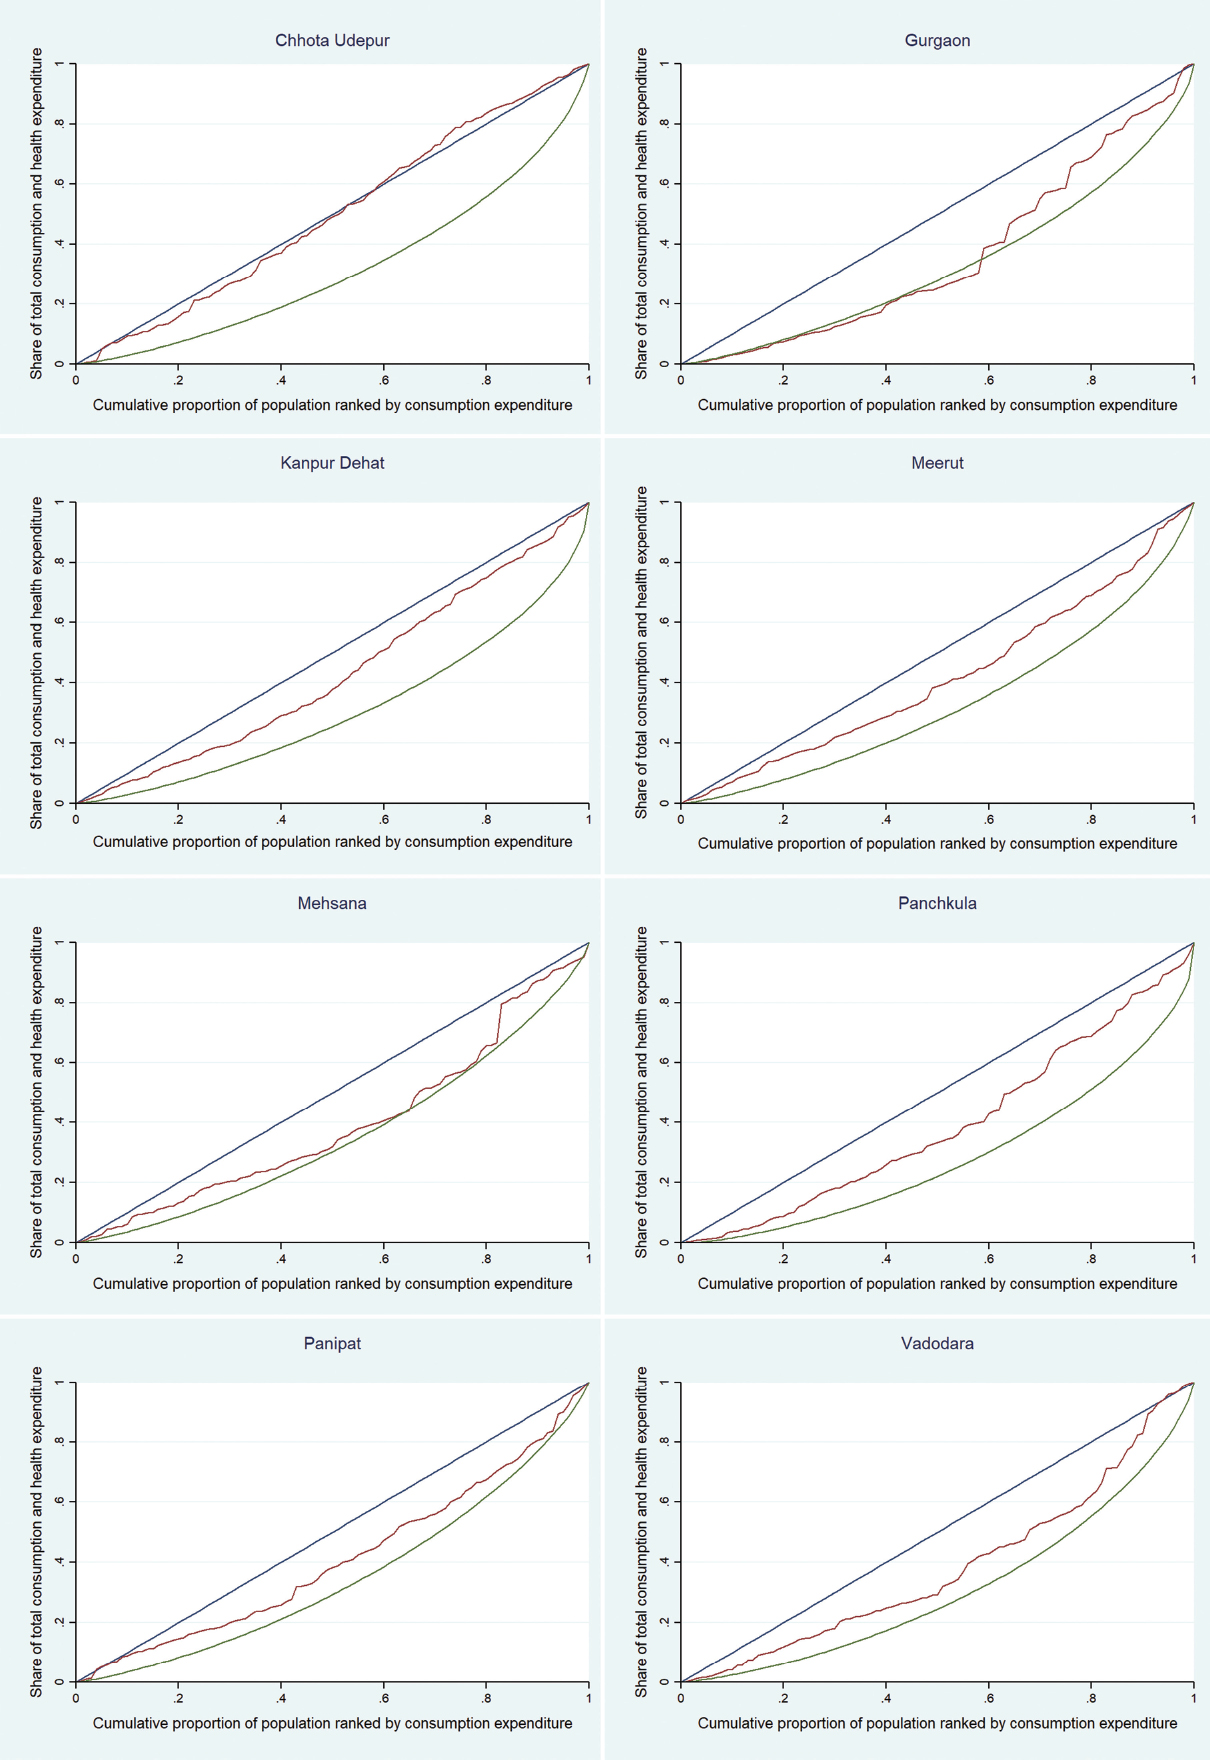
- Inequity in out- of- pocket health expenditure in districts studied from three States.
A few observations can be made. First, consumption expenditure was unequally distributed in all the districts as the Lorenz curve lied below the diagonal. Second, the concentration curve of OOP lied above the Lorenz curve, for all districts, indicating that for any cumulative consumption expenditure cut-off, the share of OOP (of the total OOP for that district) paid, was higher than the share of consumption expenditure received by those families. The implication, therefore, was that OOP was regressive in all the districts. Third, the plots suggested that there could be variations in the degree of regressivity across districts. This was because, while the shape of the Lorenz curve was roughly similar (although not equidistant from the diagonal) across districts, the concentration curve of OOP differed substantially both in terms of its texture as well as its distance from the Lorenz curves. This indicated the need for a summary measure, to objectively analyze inter-district variations in regressivity of OOP health expenditure within our sample.
In Table IV, the Gini index of consumption expenditure, concentration index of OOP and the Kakwani measure of progressivity are presented for the sample districts. In terms of consumption inequality, measured by the Gini coefficient, the most unequal district in the sample was from the State of Haryana, namely Panchkula. The most even distribution of consumption expenditure was observed in Mehsana district of Gujarat. No specific association was observed between the level of economic development of a State (Table I) and consumption inequality of its districts. The concentration indices of OOP health expenditure were positive for all districts implying that the rich made a larger contribution to the aggregate OOP expenditure of each district.
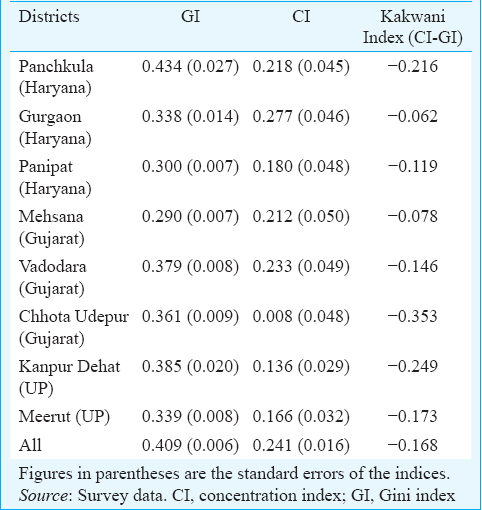
However, instead of the distribution of nominal OOP, the more vital indicator is the real burden of OOP spending which is measured by the KI. The KI compares the distribution of consumption expenditure (ATP) with the distribution of OOP. Negative values of KI for all districts substantiated the earlier finding (Fig. 1) that OOP expenditure was a regressive way to finance health in all the study districts. Chhota Udepur, the newly formed tribal district of Gujarat, was the most regressive in their OOP expenditure on health, followed by Kanpur Dehat in UP, another predominantly rural district. OOP expenditure in Gurgaon appeared to be the most progressively distributed followed by Mehsana. The progressivity in Gurgaon largely emanated from the fact that the share of the rich in total OOP was substantially higher than their share in total consumption, compared to the poor as can be seen in Fig. 1. A look at the district level concentration and Gini curves also showed that the difference between the two curves (Lorenz and concentration curve) was maximum for Chhota Udepur and minimum for Gurgaon.
Table V presents the results on catastrophic expenditure for a 20 per cent threshold of total household expenditure i.e. individuals who were spending 20 per cent or more of their total consumption expenditure on health care. The levels of impoverishment on account of OOP was also presented.
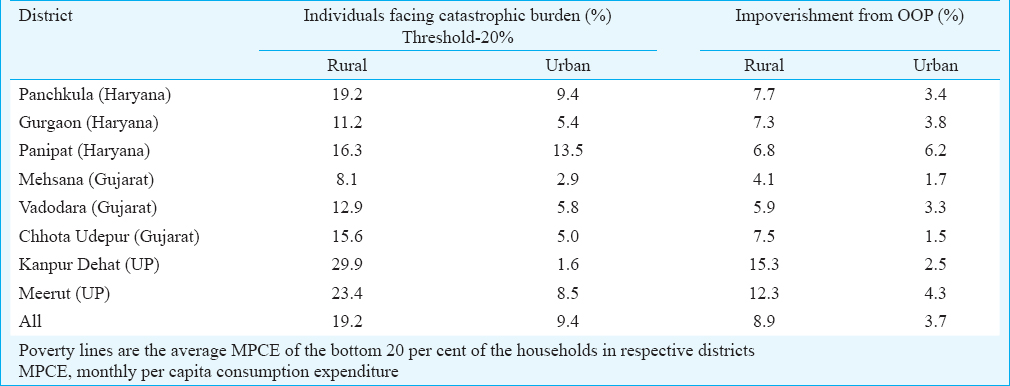
The results indicated that catastrophic burden was more pronounced among the rural sample compared to the urban one for all the districts. Within the rural sample, the two districts of Uttar Pradesh, namely Kanpur Dehat and Meerut had the highest proportion of individuals facing the burden. The highest burden within the urban sample was experienced by Panipat. Close to nine per cent (3457 individuals out of 38,852) of the rural sample and four per cent (869 individuals out of 23,483) of the urban sample were impoverished on account of OOP health expenditure. Kanpur Dehat in UP and Panipat in Haryana were the districts with the highest proportions of impoverishment on account of OOP health expenses, within rural and urban samples, respectively. The lowest rates of OOP induced impoverishment (in rural as well as urban areas) were visible in Mehsana.
Discussion
OOP usually is a regressive way of financing healthcare leading to impoverishment, and it was no different for the districts studied here. In all of the districts studied, people were paying more for health, relative to their economic status. Predominantly rural districts were more vulnerable to this problem. This is invariant of whether they belong to an economically developed State such as Gujarat or Haryana or a less developed State like Uttar Pradesh. The other significant result was that the only tribal district from within the sample - Chhota Udepur from Gujarat - displayed the highest inequity in OOP health spending. This was in spite of the dominance of low-cost service providers mostly dealing in traditional medicines in this district, as communicated by the respondents. However, among the non-tribal districts within the sample, Mehsana and Vadodara from the same State, had the lowest levels of OOP, both in per capita terms as well as a share of consumption expenditure. About 4326 individuals from the sample of 62,335 were pushed below the poverty line on account of healthcare expenses paid OOP, the majority of whom were from the rural areas. There were many more potential entrants into poverty as indicated by the high percentage of individuals who spent more than a fifth of their consumption expenditure on healthcare.
The comprehensive analysis of OOP health expenditure in our study indicated that districts within a State were quite dissimilar in terms of OOP spending on healthcare. This, among other things, could be an outcome of heterogeneity in the morbidity profile and treatment-seeking behaviour in addition to supply-side differences, for example, public-private mix of providers. Such diversity across districts even within a State needs to be taken into account while designing policies.
The study has important policy implications. First, with scarce public resources dwindling further with over time, State governments might feel the need to prioritize their spending. The district level analysis can assist the government in such prioritization. Second, cash transfer in lieu of services being the future of public service delivery in the country, studies like this could be informative in deciding the quantum and distribution (across districts) of total resource that a State might have to spend on healthcare. The larger implication of such district level studies, therefore, is the immense potential to contribute towards a bottom-up approach to policy. This can, however, be done only if States equip themselves with better evidence and information on disease patterns, health equity mapping, and demand/supply side parameters from the districts.
A limitation of this study was that it had not dealt with supply side issues in these districts, for example, public-private mix of service providers, their location, quality and costs which could be important determinants of the quantum of OOP health expenditure and its variation.
In conclusion, this study brings out distinct dissimilarities in the equity aspect and incidence of the burden from OOP expenses on healthcare across districts within a State. This is important since national surveys, like the NSSO, are rarely representative of the district, statistically. More such work could help build up a body of evidence, thereby leading to a more robust policy environment in India's health sector.
Acknowledgment:
Authors acknowledge Dr Shobhana Swami, Community Empowerment Research Association (CERA) for data collection in Uttar Pradesh. Authors also thank Servshri Devmani Upadhyay and Diwas Singh Saun for entry of survey data.
Financial support & sponsorship: This study was funded by the Indian Council of Social Science Research (ICSSR), New Delhi.
Conflicts of Interest: None.
References
- National Health Accounts Estimates for India (2013-14) In: National Health Systems Resource Centre. New Delhi: Ministry of Health and Family Welfare, Government of India; 2016.
- [Google Scholar]
- In sickness and in health: Risk-sharing within households in rural Ethiopia. J Polit Econ. 2000;108:688-727.
- [Google Scholar]
- The economic consequences of health shocks. World bank policy research working paper WPS3644. Washington, DC: World Bank; 2005.
- [Google Scholar]
- Health shocks in China: Are the poor and uninsured less protected? World Bank policy research working paper No.3740. Washington, DC: The World Bank; 2005.
- [Google Scholar]
- Catastrophic and poverty impacts of health payments: Results from national household surveys in Thailand. Bull World Health Organ. 2007;85:600-6.
- [Google Scholar]
- Deepening health insecurity in India: Evidence from national sample surveys since 1980s. Econ Polit Wkly. 2009;44:55-60.
- [Google Scholar]
- Catastrophic payments and impoverishment due to out-of pocket health spending. Econ Polit Wkly. 2012;46:63-70.
- [Google Scholar]
- Insured yet vulnerable: Out-of-pocket payments and India's poor. Health Policy Plan. 2012;27:213-21.
- [Google Scholar]
- The impoverishing effect of healthcare payments in India: New methodology and findings. Econ Polit Wkly. 2010;45:65-71.
- [Google Scholar]
- Escaping poverty and becoming poor: Who gains, who loses, and why? World Dev. 2004;32:121-36.
- [Google Scholar]
- Financial burden of transient morbidity: A case study of slums in Delhi. Econ Polit Wkly. 2011;46:59-66.
- [Google Scholar]
- Socio-economic inequalities in the financing of cardiovascular & diabetes inpatient treatment in India. Indian J Med Res. 2011;133:57-63.
- [Google Scholar]
- Health care inequities in North India: Role of public sector in universalizing health care. Indian J Med Res. 2012;136:421-31.
- [Google Scholar]
- Catastrophic health expenditure & coping strategies associated with acute coronary syndrome in Kerala, India. Indian J Med Res. 2012;136:585-92.
- [Google Scholar]
- National health profile-2017. In: Central Bureau of Health Intelligence. Directorate General of Health Services. New Delhi: Ministry of Health & Family Welfare, Government of India; 2017.
- [Google Scholar]
- Out-of-pocket expenditure for hospitalization in Haryana State of India: Extent, determinants & financial risk protection. Indian J Med Res. 2017;146:759-67.
- [Google Scholar]
- Geographic variation in household and catastrophic health spending in India: Assessing the relative importance of villages, districts, and States, 2011-2012. The Milibank Quarterly. 2018;96:167-206.
- [Google Scholar]
- State health insurance and out-of-pocket health expenditures in Andhra Pradesh, India. Int J Health Care Finance Econ. 2012;12:189-215.
- [Google Scholar]
- Socio-demographic determinants of out-of-pocket health expenditure in a rural area of Wardha district of Maharashtra, India. Indian J Med Res. 2017;146:654-61.
- [Google Scholar]
- Key Indicators of Social Consumption in India: Health. In: National Sample Survey Office. New Delhi: Ministry of Statistics and Programme Implementation. Government of India; 2015.
- [Google Scholar]
- Analyzing health equity using household survey data: A guide to techniques and their implementation. Washington DC: The World Bank; 2008.
- [Google Scholar]
- Equity in the finance of health care: Some international comparisons. J Health Econ. 1992;11:361-87.
- [Google Scholar]
- A look at catastrophic medical expenses and the poor. Health Aff (Millwood). 1986;5:138-45.
- [Google Scholar]
- Preventing impoverishment through protection against catastrophic health expenditure. Bull World Health Organ. 2002;80:612.
- [Google Scholar]
- Catastrophe and impoverishment in paying for health care: With applications to Vietnam 1993-1998. Health Econ. 2003;12:921-34.
- [Google Scholar]
- Social risk management options for medical care in Indonesia. Health Econ. 2002;11:431-46.
- [Google Scholar]
- Reduction of catastrophic health care expenditures by a community-based health insurance scheme in Gujarat, India: Current experiences and challenges. Bull World Health Organ. 2002;80:613-21.
- [Google Scholar]
- The economic burden of illness for households in developing countries: A review of studies focusing on malaria, tuberculosis, and human immunodeficiency virus/acquired immunodeficiency syndrome. Am J Trop Med Hyg. 2004;71:147-55.
- [Google Scholar]
- Office of the Registrar General & Census Commissioner. Population projections for India and States 2001-2026. New Delhi: Government of India; 2006.
- [Google Scholar]
- Office of the Registrar General & Census Commissioner. In: Census 2011. New Delhi: Government of India; 2011.
- [Google Scholar]
- Ministry of Statistics and Programme Implementation, Government of India. Data. Available from: http://www.mospi.gov.in/data
- National Health Profile 2015. Ministry of Health and Family Welfare, Government of India. Central Bureau of Health Intelligence. Available from: http://www.cbhidghs.nic.in/WriteReadData/l892s/NHP-2015.pdf
- [Google Scholar]
- National Health Profile 2013. Ministry of Health and Family Welfare, Government of India. Central Bureau of Health Intelligence. Available from: http://www.cbhidghs.nic.in/index1.php?lang=1&level=1&sublinkid=84&lid=75
- [Google Scholar]
- Sample Registration System Bulletins. Ministry of Home Affairs, Government of India. Office of the Registrar General & Census Commissioner. Available from: http://censusindia.gov.in/vital_statistics/SRS_Bulletins/Bulletins.html
- [Google Scholar]


