Translate this page into:
Hypobaric hypoxia-mediated protein expression in plasma of susceptible & tolerant rats
Reprint requests: Dr Kamal Krishan Aggarwal, University School of Biotechnology, Guru Gobind Singh Indraprastha University, Sector-16C, Dwarka, New Delhi 110 078, India e-mail: kkagg36@yahoo.com
-
Received: ,
This is an open-access article distributed under the terms of the Creative Commons Attribution-Noncommercial-Share Alike 3.0 Unported, which permits unrestricted use, distribution, and reproduction in any medium, provided the original work is properly cited.
This article was originally published by Medknow Publications & Media Pvt Ltd and was migrated to Scientific Scholar after the change of Publisher.
Abstract
Background & objectives:
Low availability of oxygen at high altitudes has a great impact on the human life processes. There is a widespread interest and need to find out protein(s) that are possibly involved in mediating tolerance to hypobaric hypoxia. We undertook this study to identify and characterize protein expression in plasma of hypoxia susceptible and tolerant rats.
Methods:
Male albino Sprague Dawley rats were segregated into susceptible and tolerant groups on the basis of their gasping time when exposed to simulated hypobaric hypoxia of 32,000 ft (9,754 m) at 32°C. Comparative proteome profiling of blood plasma of hypoxia susceptible and tolerant individuals was performed using 2-dimentional (2-D) gel electrophoresis.
Results:
Three proteins with higher expression levels were selected separately from tolerant and susceptible samples. Characterization of these proteins from tolerant sample using MALDI-TOF/TOF and MASCOT search indicated their homology with two different super-families viz. NADB-Rossmann superfamily (Rab GDP dissociation inhibitor β) and Transferrin superfamily (two Serotransferrins), having potential role in imparting tolerance against hypoxia. Three high level upregulated proteins were characterized from blood plasma of hypoxia susceptible animals showing similarity with threonine tRNA ligase (mitochondrial), carbohydrate sulphotransferase 7 and aspartate tRNA ligase (cytoplasmic) that play a role in ATP binding, carbohydrate metabolism and protein biosynthesis, respectively.
Interpretation & conclusions:
Our results indicated that rats segregated into hypoxia sensitive and tolerant based on their gasping time showed differential expression of proteins in blood plasma. Characterization of these differentially expressed proteins will lead to better understanding of molecular responses occurring during hypoxia and subsequently development of biomarkers for categorization of hypoxia susceptible and tolerant individuals.
Keywords
Blood plasma
2-D gel electrophoresis
hypobaric hypoxia
MALDI-TOF/TOF
Sprague Dawley rat
upregulated protein

Hypobaric hypoxia, a condition of low oxygen concentration at high altitudes, has a great impact on the life processes of individuals residing at that altitude and those who travel to high altitude locations1. Cellular level of molecular oxygen regulates the expression and activity of various cellular proteins2. Significant impact of low oxygen at altitude higher than 10,000 ft (3,048 m) on physiology and metabolism of individuals has been reported earlier3. The partial pressure of oxygen becomes low at high altitude leading to less availability of oxygen in the atmosphere4 that may lead to various patho-physiological symptoms like ischaemia, altitude sickness including acute mountain sickness, high altitude pulmonary oedema and high altitude cerebral oedema5, mental dysfunction and memory deficit6, insomnia, dizziness, nausea7, irritation, motor impairment8, inflammation, lung disorders9, etc. Deterioration in cerebral functions may be seen during the initial phases of exposure to high altitude7. Hypoxia also induces biochemical alteration of the blood-brain barrier1. Possible mediators, some triggered by endothelial activation, include vascular endothelial growth factor, inducible nitric oxide synthase, and bradykinin10.
Studies on the severity of high altitude hypoxia have suggested an increase in cellular oxidative stress, which in turn leads to the damage in lipids, proteins and DNA11. Although changes at genome level during hypobaric hypoxia have been extensively investigated, study of corresponding changes in the proteome needs more investigations for better understanding of hypoxia mediated changes at proteome level. The present study was carried out to identify and characterize proteins from blood plasma of susceptible and tolerant rats showing differential (high) level of expression during hypobaric hypoxia.
Material & Methods
Experimental animal: Sprague Dawley adult male albino rats were used as experimental animal. All animal handling related experiments were performed at Defence Institiute of Physiology & Allied Sciences (DIPAS), Defence Research & Devlopment Organisation (DRDO) Delhi. Inbred rats were maintained under hygienic conditions at 24 ± 2°C with a 12 h light and 12 h dark conditions. Animals weighing between 185 ± 10 g were selected and fed with a standard pelletized diet and sterile tap water. All animal procedures were approved by the Institute's Animal Ethical Committee (DIPAS, DRDO, Delhi).
Selection of hypoxia susceptible, tolerant and normal rats: Hypobaric hypoxia susceptible, tolerant and normal Sprague Dawley rats were screened by exposing the randomly selected adult male rat population to simulated altitude of 32,000 ft (9,754 m) (barometric pressure = 205.8 mm of Hg) at 32°C in an animal decompression chamber (Decibel Instruments, Delhi, India) linked to a mercury barometer. The hypoxic tolerance of rats was determined by measuring gasping time1213. The 32,000 ft (9,754 m) altitude equivalent was achieved at a rate of 3,000 ft/min (914 m/min). The airflow in the chamber was 2 l/min and relative humidity was maintained at 40-50 per cent. The time taken for the appearance of first sign of gasping was recorded using an electronic stopwatch. Based on their gasping time animals were segregated into hypobaric hypoxia susceptible (0-8 min), tolerant (>27 min) and normal (15-22 min). All three groups of hypobaric hypoxia treated animals (n=6 in each group) were kept under normal conditions at 24 ± 2°C for a week for acclimatization.
Collection of blood samples: After one week, animals were exposed to a simulated altitude of 30,000 ft (9,144 m) at 24°C for 1 h14. The rats were then anaesthetized using ketamine (80 mg/kg body weight, ip) and xylazine (20 mg/kg body weight, ip) and sacrificed. Blood was collected from the hepatic portal vein lying next to the lower stomach and large intestine, centrifuged at 2,500 x g for 20 min at 4°C. Plasma samples were separated and stored at -80°C until further use.
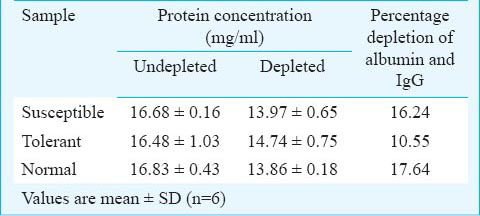
Processing of the samples for protein profiling: To analyze the proteome of hypoxia susceptible, tolerant and normal rats, two major interfering abundant proteins, viz., albumin and immunoglobulin gamma (IgG) were separated out by passing the plasma through blue sepharose using “Albumin-IgG depletion kit” (KT-119, Bangalore Genei, India) according to manufacturer's instruction. The kit ensures maximum recovery of bound proteins by using different extraction and equilibration buffers.
Fractionation of plasma proteins by 2-D gel electrophoresis: Protein concentration in albumin and IgG depleted plasma samples was determined using Bradford assay15 with bovine serum albumin (BSA) as standard. Equal amount of protein samples (80 μg) each from susceptible, tolerant and normal sample were subjected to 2-dimensional (2-D) gel electrophoresis. Protein samples were reswelled on immobilized pH gradient (IPG) strip (7 cm IPG strip broadest range of pH 3-10) (Catalogue no. 17-6001-11, GE Healthcare, Geneva) and 7 cm IPG strip pH range 4-7 (Catalogue no. 17-6001-10, GE Healthcare, Geneva) for 14 h with each samples. The sample volume was adjusted to 125 μl with rehydration buffer {8 M urea, 2% 3-[(3-cholamidopropyl) dimethylammonio]-1-propane sulfonate (CHAPS), 0.5% immobilized pH gradient (IPG) buffer, 2.8 mg/ml dithiothreitol (DTT) and 0.002% bromophenol blue}. First dimension separation of the reswelled samples on IPG strips was done on isoelectric focusing (IEF) platform-Ettan IPGphor3 (GE Healthcare, Geneva) upto 6 kVh for each sample. After IEF, the strips were equilibrated using sodium dodecyl sulphate (SDS)-equilibration buffer [50 mM tris, pH 8.8, 6 M urea, 30% glycerol (v/v), 2% SDS and 0.002% bromophenol blue] with 100 mg DTT/10 ml for 15 min followed by 250 mg iodoacetamide (IAA)/10 ml for another 15 min, and then subjected to second dimension separation on SDS-polyacrylamide gel. The equilibrated strips were placed on 12.5 per cent gel and 0.6 per cent agarose containing 0.002 per cent bromophenol blue was overlaid onto the top of the strips to avoid transfusion of protein(s) into 1x running buffer (Tris-glycine-SDS buffer). A constant current of 30 mA was maintained for 2 h to complete the second dimension separation. The gels were silver stained16 and gel pictures were captured using gel documentation unit (DNR, Bio-Imaging Systems, Israel).
Analysis of differentially expressed proteins: Silver stained 2-D gels were analyzed using ImageMaster™ 2D Platinum 7.0 software (GE Healthcare, Geneva) according to the manufacturer's recommendations. Briefly, the ImageMaster™ biological analysis module was used to detect protein spots in three different gels, representing susceptible, tolerant and normal groups. Simultaneously, the matching of gels was done to detect differentially expressed protein spots among susceptible, tolerant and normal samples. Matches were also confirmed manually.
Characterization of protein spots by matrix assisted laser desorption/ionization–time of flight (MALDI–TOF/TOF): The protein spots exhibiting more than 4-fold increase in expression among different samples were excised from gels and dipped in freshly prepared 15 mM potassium ferricyanide and 50 mM sodium thiosulphate solution. Samples were incubated at room temperature for destaining of silver spots for a maximum of 30 min. The gel pieces were rinsed several times with fresh distilled water. The destained gel spots were dipped in freshly prepared enzyme solution (25 mM ammonium bicarbonate and 1 mg/ml of trypsin solution in 4:1 ratio). The gel pieces were placed in the micro-centrifuge tube and chopped. The chopped gel pieces were incubated with above enzyme solution at 37°C for overnight to digest the proteins.
The peptides were extracted by sonication and spotted on the α-cyano-4-hydroxycinnamic acid (HCCA) matrix for MALDI-TOF/TOF analysis. The sequencing of the proteins was done at ‘Sandor Proteomics’, Hyderabad (Andhra Pradesh, INDIA) using MALDI-TOF/TOF. Target proteins were identified by searching for the appropriate candidates in the annotated NCBI and Swiss Prot databases using Mascot software (http://www.matrixscience.com/search_form_select.html). Mascot Score Histogram suggests the protein score greater than 51 as significant (P<0.05).
Results
Hypobaric hypoxia mediated upregulation of proteins: Rats categorized as susceptible gasped immediately while the tolerant rats occupied a corner of the chamber and breathe normally. The rats grouped as normal showed normal behaviour at simulated altitude of 32,000 ft.
Plasma protein was fractionated by 2-D gel electrophoresis after depleting albumin and IgG (Table I). Gels were analyzed using ImageMaster™ 2D Platinum 7.0 software. In all, 41, 49 and 16 protein spots were detected in the gels of susceptible, tolerant and normal plasma samples, respectively (Fig. 1). Gels were matched using ImageMaster™ 2D Platinum 7.0 software to find differentially expressed proteins in all three groups of plasma samples. All the spot matches were confirmed manually also. Protein spots with more than 4-fold expression were selected for MALDI-TOF/TOF characterization. Samples fractionated on 2-D gel electrophoresis with IPG strip pH range 3-10 revealed expression of a protein spot with ID7 showed significant high expression level in tolerant as compared to susceptible but was absent in normal (Fig. 2). There was high expression of another two protein spots (ID84 and ID85) in tolerant that were missing from susceptible and normal sample (Fig. 3). A cluster of protein spots was also observed in the region of pH 5 to 6 in all three gels. To resolve these protein spots, samples were fractionated on 2-D gels with IPG strip pH range 4-7. ImageMaster™ 2D Platinum 7.0 software based analysis of these gels revealed high expression of three proteins in susceptible when compared with tolerant and normal (Fig. 4). These three protein spots with ID30, 31 and 32 were also selected for MALDI-TOF/TOF characterization.
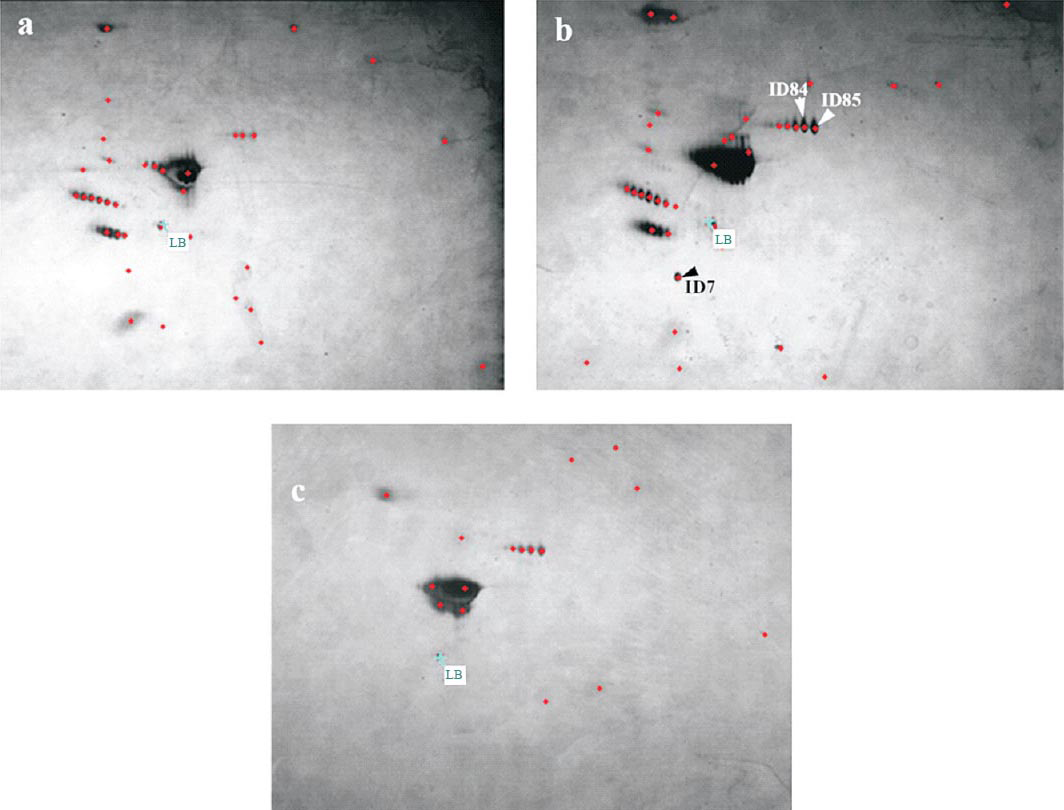
- Silver stained 2-D gel of albumin and IgG depleted blood plasma samples of hypobaric hypoxia exposed Sprague Dawley rats showing the total detected protein spots (marked with red colour) and differentially expressed proteins (marked with arrow and protein spot ID); (a) susceptible; (b) tolerant and (c) normal.
![Gel portion showing differential expression of spot ID7 of hypobaric hypoxia exposed Sprague Dawley rats; (a) tolerant: showing increased expression of protein spot ID7; (d) 3D peak representation of (a); (b) susceptible: showing low expression of spot ID7; (e) 3D peak representation of (b); (c) normal: showing absence of protein spot ID7; (f) 3D peak representation of (c); (g) histogram showing comparison of expression of protein spot ID7 in tolerant, susceptible and normal samples. X-axis represents samples (bar ‘bca’ represents tolerant; bar ‘efd’ represents susceptible; bar ‘hig’ represents normal) and Y-axis, corresponds to the relative spot intensity in arbitrary unit. 3D peak and histograms were generated using ImageMaster™ 2D Platinum 7.0 software. As per the user manual of ImageMaster™ 2D Platinum 7.0 software, in the histograms the vertical orange bars correspond to the spot values, the blue horizontal line represents the chosen central tendency and the red lines delimit the range defined by [Central value – Dispersion, Central value + Dispersion], and the match ID is displayed at the bottom of each histogram.](/content/175/2014/140/6/img/IJMR-140-756-g003.png)
- Gel portion showing differential expression of spot ID7 of hypobaric hypoxia exposed Sprague Dawley rats; (a) tolerant: showing increased expression of protein spot ID7; (d) 3D peak representation of (a); (b) susceptible: showing low expression of spot ID7; (e) 3D peak representation of (b); (c) normal: showing absence of protein spot ID7; (f) 3D peak representation of (c); (g) histogram showing comparison of expression of protein spot ID7 in tolerant, susceptible and normal samples. X-axis represents samples (bar ‘bca’ represents tolerant; bar ‘efd’ represents susceptible; bar ‘hig’ represents normal) and Y-axis, corresponds to the relative spot intensity in arbitrary unit. 3D peak and histograms were generated using ImageMaster™ 2D Platinum 7.0 software. As per the user manual of ImageMaster™ 2D Platinum 7.0 software, in the histograms the vertical orange bars correspond to the spot values, the blue horizontal line represents the chosen central tendency and the red lines delimit the range defined by [Central value – Dispersion, Central value + Dispersion], and the match ID is displayed at the bottom of each histogram.
![Gel portion showing differential expression of spot ID84 and ID85 of hypobaric hypoxia exposed Sprague Dawley rats; (a) tolerant: showing expression of protein spot ID84 and ID85; (d) 3D peak representation of (a); (b) susceptible: showing absence of protein spot ID84 and ID85; (e) 3D peak representation of (b); (c) normal: showing absence of spot ID84 and ID85; (f) 3D peak representation of (c); (g and h) histogram showing comparison of expression of protein spots with ID84 and ID85, respectively in tolerant, susceptible and normal samples. X-axis represents samples (bar ‘bca’ represents tolerant; bar ‘hig’ represents susceptible; bar ‘efd’ represents normal) and Y-axis, corresponds to the relative spot intensity in arbitrary unit. 3D peak and histograms were generated using ImageMaster™ 2D Platinum 7.0 software. As per the user manual of ImageMaster™ 2D Platinum 7.0 software, in the histograms the vertical orange bars correspond to the spot values, the blue horizontal line represents the chosen central tendency and the red lines delimit the range defined by [Central value – Dispersion, Central value + Dispersion], and the match ID is displayed at the bottom of each histogram.](/content/175/2014/140/6/img/IJMR-140-756-g004.png)
- Gel portion showing differential expression of spot ID84 and ID85 of hypobaric hypoxia exposed Sprague Dawley rats; (a) tolerant: showing expression of protein spot ID84 and ID85; (d) 3D peak representation of (a); (b) susceptible: showing absence of protein spot ID84 and ID85; (e) 3D peak representation of (b); (c) normal: showing absence of spot ID84 and ID85; (f) 3D peak representation of (c); (g and h) histogram showing comparison of expression of protein spots with ID84 and ID85, respectively in tolerant, susceptible and normal samples. X-axis represents samples (bar ‘bca’ represents tolerant; bar ‘hig’ represents susceptible; bar ‘efd’ represents normal) and Y-axis, corresponds to the relative spot intensity in arbitrary unit. 3D peak and histograms were generated using ImageMaster™ 2D Platinum 7.0 software. As per the user manual of ImageMaster™ 2D Platinum 7.0 software, in the histograms the vertical orange bars correspond to the spot values, the blue horizontal line represents the chosen central tendency and the red lines delimit the range defined by [Central value – Dispersion, Central value + Dispersion], and the match ID is displayed at the bottom of each histogram.
![Gel portion of samples fractionated on IPG strip pH 4-7, showing differential expression of protein spot ID30, ID31 and ID32 of hypobaric hypoxia exposed Sprague Dawley rats; (a) susceptible: showing expression of protein spot ID30, ID31 and ID32; (d) 3D peak representation of (a); (b) tolerant: indicating absence of protein spot ID30, ID31 and ID32; (e) 3D peak representation of (b); (c) normal: showing absence of protein spot ID30, ID31 and ID32; (f) 3D representation of (c); (g, h and i) histogram showing expression of protein spot ID30, ID31 and ID32, respectively in susceptible, tolerant and normal samples. X-axis represents samples (bar ‘ghi’ represents susceptible; bar ‘def’ represents tolerant; bar ‘abc’ represents normal). Y-axis, corresponds to the relative spot intensity in arbitrary unit. 3D peak and histograms were generated using ImageMaster™ 2D Platinum 7.0 software. As per the user manual of ImageMaster™ 2D Platinum 7.0 software, in the histograms the vertical orange bars correspond to the spot values, the blue horizontal line represents the chosen central tendency and the red lines delimit the range defined by [Central value – Dispersion, Central value + Dispersion], and the match ID is displayed at the bottom of each histogram.](/content/175/2014/140/6/img/IJMR-140-756-g005.png)
- Gel portion of samples fractionated on IPG strip pH 4-7, showing differential expression of protein spot ID30, ID31 and ID32 of hypobaric hypoxia exposed Sprague Dawley rats; (a) susceptible: showing expression of protein spot ID30, ID31 and ID32; (d) 3D peak representation of (a); (b) tolerant: indicating absence of protein spot ID30, ID31 and ID32; (e) 3D peak representation of (b); (c) normal: showing absence of protein spot ID30, ID31 and ID32; (f) 3D representation of (c); (g, h and i) histogram showing expression of protein spot ID30, ID31 and ID32, respectively in susceptible, tolerant and normal samples. X-axis represents samples (bar ‘ghi’ represents susceptible; bar ‘def’ represents tolerant; bar ‘abc’ represents normal). Y-axis, corresponds to the relative spot intensity in arbitrary unit. 3D peak and histograms were generated using ImageMaster™ 2D Platinum 7.0 software. As per the user manual of ImageMaster™ 2D Platinum 7.0 software, in the histograms the vertical orange bars correspond to the spot values, the blue horizontal line represents the chosen central tendency and the red lines delimit the range defined by [Central value – Dispersion, Central value + Dispersion], and the match ID is displayed at the bottom of each histogram.
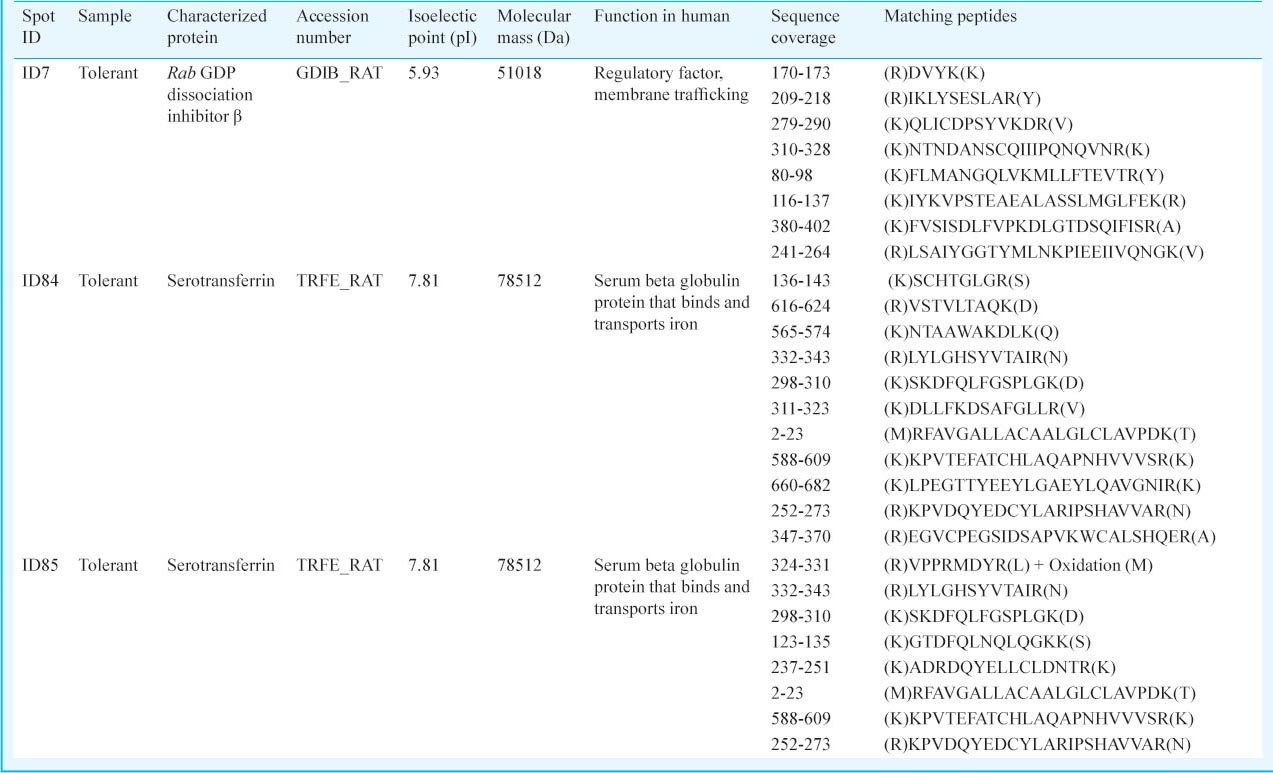
Characterization of protein spots by MALDI-TOF and peptide mass fingerprinting (PMF): Determination of internal peptide sequence of spot ID7, 84 and 85: MALDI-TOF/TOF based characterization and homology search using Swiss-Prot protein database analysis of spot ID7 indicated its putative identification with NADB-Rossmen superfamily “Rab GDP dissociation inhibitor β” (Accession number: GDIB_RAT) (Table II) from Rattus norvegicus (giǀ124021680 Score: 55 Expect: 0.024). The peptide fragments of the spot ID84 showed maximum homology with a protein of Transferrin superfamily “Serotransferrin” on searching Swiss-Prot protein database. “Serotransferrin” was reported in R. norvegicus (giǀ122066515 Score: 55 Expect: 0.022). Similarly, the peptide fragments of spot ID85 showed maximum homology with the same protein “Serotransferrin” from R. norvegicus (giǀ122066515 Score: 46 Expect: 0.2) (Table II). These internal peptide sequences are to be deposited in the universal protein resource database.
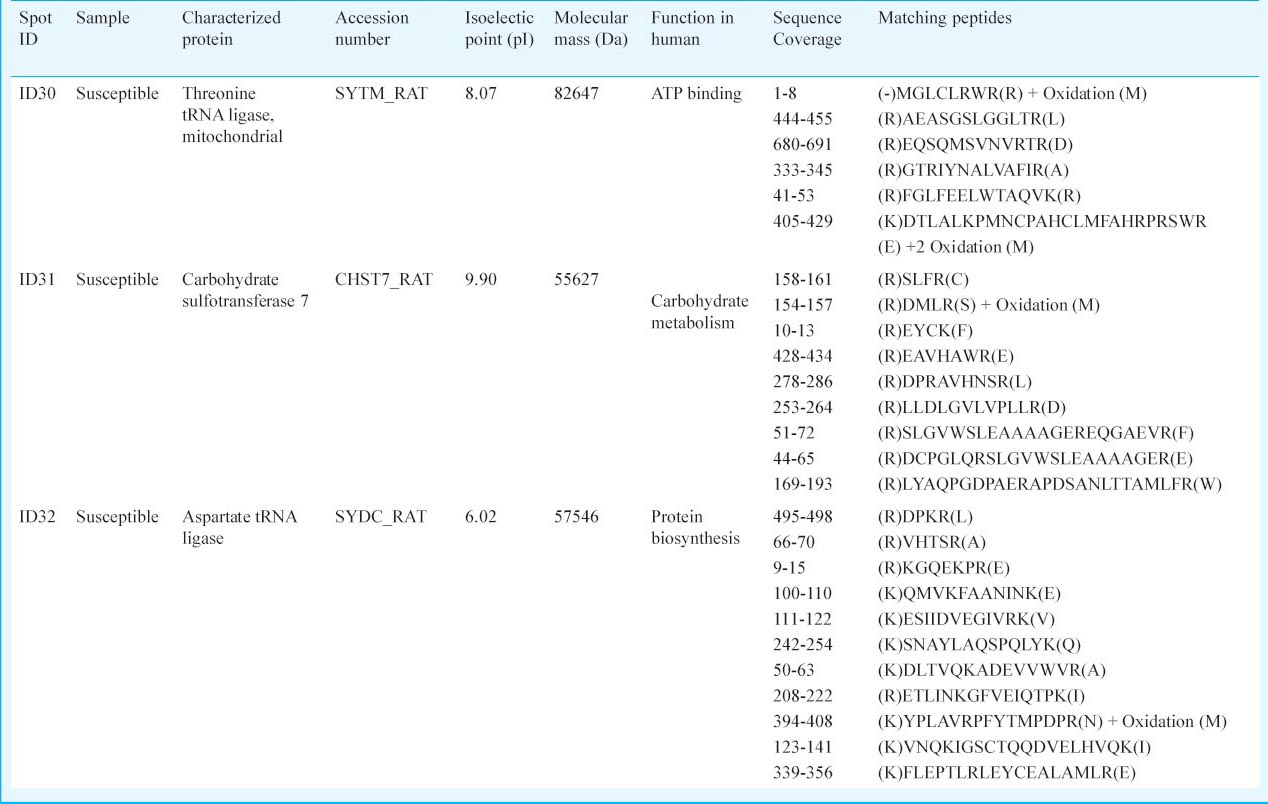
Determination of internal peptide sequence of spot ID30, 31 and 32: Characterization of protein spots (ID30, ID31 and ID32) was also performed using MALDI-TOF and MASCOT search (Table III). Swiss-Prot protein database analysis of spot ID30 revealed maximum homology with “Threonine - tRNA ligase, mitochondrial” (Accession number: SYTM_RAT) from R. norvegicus (giǀ81884372 Score: 53 Expect: 0.039). This protein has a molecular function in ATP binding and posseses threonine-tRNA ligase activity17. The fragmented peptides of protein spot ID31 showed significant homology with “Carbohydrate sulphotransferase 7” (Accession number: CHST7_RAT) from R. norvegicus (giǀ61211354 Score: 55 Expect: 0.025) which has a vital role in carbohydrate metabolism for the production of energy. Peptide fragments of protein spot ID32 revealed its significant homology with “Aspartate - tRNA ligase, cytoplasmic” (Accession number: SYDC_RAT) from R. norvegicus (giǀ135099 Score: 52 Expect: 0.052) (Table III).
Discussion
Different individuals respond differently to hypoxia and can be categorized into different groups based on their tolerance towards low oxygen conditions. Distinct differences in tolerance to hypobaric hypoxia in terms of gasping time may be related to altered hormonal regulation18. Erythropoietin (EPO) is one of the important stress induced growth factor that induces maturation of erythrocytes and vascular endothelial growth factor (VEGF), the major mediator of angiogenesis and vascular permeability19.
In the present study, high expression level of three proteins in hypobaric hypoxia tolerant rats indicates their possible involvement in hypobaric hypoxia tolerance. Protein with spot ID7 was characterized as homologous to “Rab GDP dissociation inhibitor β” belonging to NADB-Rossmann Superfamily having a characteristic role in regulating intracellular vesicle trafficking such as exocytosis, endocytosis and transcytosis20. The complete amino acid sequence of “Rab GDP dissociation inhibitor β” is well conserved among human, bovine, rat and Drosophila and shows 94 per cent amino acid homology with “Rab GDP dissociation inhibitor β” from R. norvegicus and “Rab GDP dissociation inhibitor” from Homo sapiens21. These proteins are involved in GDP/GTP exchange reactions with a vital role in energy metabolism22.
Protein spots with ID84 and 85 showed homology with the same protein viz., “Serotransferrin” which has a potential role in transport of iron from the site of absorption, storage, utilization and its delivery to all cells as a part of cellular respiration23. A cross-talk has been established between the iron metabolism and oxygen transport explaining the important associations between the control of iron concentration and the physiology of the hypoxic responses24.
The proteins that were found to be upregulated in susceptible samples belonged to two major classes of proteins. Threonine-tRNA ligase (ID30) and aspartate-tRNA ligase (ID32) belong to Class II aaRS-like core superfamily and help in protein biosynthesis. It catalyses the specific attachment of an amino acid to its cognate tRNA by forming an intermediate (aa-AMP) and then transferred to the acceptor end of tRNA25. Role of threonyl-tRNA synthetase (threonine-tRNA ligase) along with other members of aminoacyl tRNA synthetase (aaRS) protein superfamily has been reported in about 30 per cent autoimmune patients26. However, exact role of these class II aminoacyl tRNA synthetases is not known in hypoxia, but its increased expression in susceptible individuals indicates the possibility of its inhibitory role in the metabolic pathways of hypoxia tolerance.
Carbohydrate sulphotransferase 7 (ID31) utilizes 3’-phospho-5’-adenylyl sulphate (PAPS) as sulphonate donor for catalyzing sulphate transfer to N-acetylglucosamine (GlcNAc)27. It is known to be expressed in heart, spleen, liver and ovary and also secreted in body fluids (UniProt/SwissProt database). Certain adaptations that occur at the tissue and systemic levels lead to an increase in O2 delivery, which includes erythropoiesis induction, angiogenesis and hyperventilation19. Thus, comparative study of physiology of different individuals in response to hypobaric hypoxia can help in the identification of biomolecules to be focused for imparting tolerance either by drug (pharmaceutical) administration and food supplementation (nutraceuticals)28 or by their in vivo induction (biomarker discovery)29. The increased expression of such proteins may play an important role during hypobaric hypoxia stress by regulating energy requirements of cells and in oxygen carrying capacity of blood.
In conclusion, the homology of hypobaric hypoxia induced proteins to the cellular protein with a regulatory role in membrane trafficking, iron and protein transport, carbohydrate metabolism, protein synthesis, etc. indicates the possibility of their role in imparting tolerance against hypoxia and in various diseases. Further characterization of these proteins based on larger sample size may provide a basis for development of protein based biomarkers for the identification of hypoxia susceptible and tolerant individuals, diagnosis of various diseases and their treatment. Such type of studies on other tissues will widen our understanding of responses towards hypobaric hypoxia.
Acknowledgment
Authors thank the Director, DIPAS, DRDO for providing financial support and animal facilities for carrying out this work, and Shriyut Bhagwat Singh and Karan Pal for technical help in providing and handling of animals used in the experiment.
References
- Analysis of expression and post-translational modification of proteins during hypoxia. J Appl Physiol. 2004;96:1178-86.
- [Google Scholar]
- Work at high altitude and oxidative stress: Antioxidant nutrients. Toxicology. 2002;180:107-19.
- [Google Scholar]
- High-altitude cerebral edema (HACE): the Denver/ Front Range experience. Semin Neurol. 2000;20:209-17.
- [Google Scholar]
- From the twentieth to twenty first century. A public health perspective on stroke. In: Ginsberg MD, Bogoussalavsky J, eds. Cerebrovascular disease; pathophysiology, diagnosis and management. Malden, MA: Blackwell Science; 1998. p. :901-18.
- [Google Scholar]
- Effects of altitude on mood, behaviour and cognitive functioning: A review. Sports Med. 1993;16:97-125.
- [Google Scholar]
- Alterations in human upper extremity motor function during acute exposure to simulated altitude. Aviat Space Environ Med. 1993;62:759-64.
- [Google Scholar]
- Generation of oxidative stress contributes to the development of pulmonary hypertension induced by hypoxia. J Appl Physiol. 2001;90:1299-306.
- [Google Scholar]
- Hypothetical roles of angiogenesis, osmotic swelling, and ischemia in high-altitude cerebral edema. J Appl Physiol. 1995;79:375-9.
- [Google Scholar]
- Acute mountain sickness, prophylactic benefits of antioxidant vitamin supplementation at high altitude. High Altitude Med Biol. 2001;2:21-9.
- [Google Scholar]
- Seasonal variations in the survival index of rats at simulated high altitudes. Int J Biometeriol. 1966;10:63-9.
- [Google Scholar]
- Improved high altitude hypoxic tolerance and amelioration of anorexia and hypophagia in rats on oral glutamate supplementation. Aviat Space Environ Med. 1999;70:475-9.
- [Google Scholar]
- Modulation of hypoxiainduced pulmonary vascular leakage in rats by Seabuckthorn (Hippophae rhamnoides L.). 2009. Evid Based Complement Alternat Med 2011 2011 574524
- [Google Scholar]
- A rapid and sensitive method for the quantitation of microgram quantities of protein utilizing the principle of protein-dye binding. Anal Biochem. 1976;72:248-54.
- [Google Scholar]
- A highly sensitive silver stain for detecting proteins and peptides in polyacrylamide gels. Anal Biochem. 1979;98:231-7.
- [Google Scholar]
- Toward the full set of human mitochondrial aminoacyl-tRNA synthetases: characterization of AspRS and TyrRS. Biochemistry. 2005;44:4805-16.
- [Google Scholar]
- Individual variation in response to simulated hypoxic stress of rats. Indian J Exp Biol. 2012;50:744-8.
- [Google Scholar]
- HIF-1: the knowns and unknowns of hypoxia sensing. Acta Biochim Pol. 2004;51:563-85.
- [Google Scholar]
- Rab proteins and the road maps for intracellular transport. Neuron. 1993;11:789-99.
- [Google Scholar]
- Molecular cloning and characterization of two Rab GDI species from rat brain: Brain specific and ubiquitous types. J Biol Chem. 1994;269:14191-8.
- [Google Scholar]
- Intermittent hypercapnic hypoxia induced protein changes in the piglet hippocampus identified by MALDI-TOF-MS. Neurochem Res. 2009;34:2215-25.
- [Google Scholar]
- Rat mammary-gland transferrin: Nucleotide sequence, phylogenetic analysis and glycan structure. Biochem J. 1995;367:47-55.
- [Google Scholar]
- Regulation of iron homeostasis by the hypoxia-inducible transcription factors (HIFs) J Clin Invest. 2007;117:1926-32.
- [Google Scholar]
- Genetic and biochemical analysis of the functional domains of yeast tRNA ligase. J Biol Chem. 2003;278:43928-38.
- [Google Scholar]
- Myositis autoantibody inhibits histidyl-tRNA synthetases: a model for autoimmunity. Nature. 1983;304:177-9.
- [Google Scholar]
- Molecular cloning and expression of a novel chondroitin 6-O-sulfotransferase. J Biol Chem. 2000;275:21075-80.
- [Google Scholar]
- Sub-chronic oral toxicity study in Sprague-Dawley rats with hypoxia mimetic cobalt chloride towards the development of promising neutraceutical for oxygen deprivation. Exp Toxicol Pathol. 2010;62:489-96.
- [Google Scholar]
- Novel serum biomarkers for erythropoietin use in humans: A proteomic approach. J Appl Physiol. 2011;110:149-56.
- [Google Scholar]


