
Translate this page into:
Geographic information system-based mapping of air pollution & emergency room visits of patients for acute respiratory symptoms in Delhi, India (March 2018-February 2019)
For correspondence: Prof Sushil Kumar Kabra, Department of Pediatrics, All India Institute of Medical Sciences, New Delhi 110 029, India e-mail: skkabra@hotmail.com
-
Received: ,
This article was originally published by Wolters Kluwer - Medknow and was migrated to Scientific Scholar after the change of Publisher.
Abstract
Background & objectives:
Studies assessing the spatial and temporal association of ambient air pollution with emergency room visits of patients having acute respiratory symptoms in Delhi are lacking. Therefore, the present study explored the relationship between spatio-temporal variation of particulate matter (PM)2.5 concentrations and air quality index (AQI) with emergency room (ER) visits of patients having acute respiratory symptoms in Delhi using the geographic information system (GIS) approach.
Methods:
The daily number of ER visits of patients having acute respiratory symptoms (less than or equal to two weeks) was recorded from the ER of four hospitals of Delhi from March 2018 to February 2019. Daily outdoor PM2.5 concentrations and air quality index (AQI) were obtained from the Delhi Pollution Control Committee. Spatial distribution of patients with acute respiratory symptoms visiting ER, PM2.5 concentrations and AQI were mapped for three seasons of Delhi using ArcGIS software.
Results:
Of the 70,594 patients screened from ER, 18,063 eligible patients were enrolled in the study. Winter days had poor AQI compared to moderate and satisfactory AQI during summer and monsoon days, respectively. None of the days reported good AQI (<50). During winters, an increase in acute respiratory ER visits of patients was associated with higher PM2.5 concentrations in the highly polluted northwest region of Delhi. In contrast, a lower number of acute respiratory ER visits of patients were seen from the ‘moderately polluted’ south-west region of Delhi with relatively lower PM2.5 concentrations.
Interpretation & conclusions:
Acute respiratory ER visits of patients were related to regional PM2.5 concentrations and AQI that differed during the three seasons of Delhi. The present study provides support for identifying the hotspots and implementation of focused, intensive decentralized strategies to control ambient air pollution in worst-affected areas, in addition to the general city-wise strategies.
Keywords
Air pollution
AQI
ambient
children
Delhi
emergency room visits
geographic information system
PM2.5

The national capital of India, Delhi, is amongst one of the most-polluted cities of the world1,2 and is facing major environmental challenge3. In Delhi, per 10 unit increase in the concentration of sulphur dioxide and particulate matter (PM)10 increases respiratory disease-related hospital visits by 83 and 0.21 per cent, respectively, at a previous lag of 0-6 days4,5. Ambient air pollutant levels of PM2.5 PM10, sulphur dioxide (SO2), nitrogen dioxide (NO2), ozone (O3) and carbon monoxide (CO) in Delhi have been reported to exceed Indian National Ambient Air Quality Standards6. Fine particles having diameter of ≤2.5 μm (PM2.5) are more hazardous to human health than other pollutants and are used as a common measure for air pollution1,7. Smaller size PM is associated with higher fraction of redox-active components and is, therefore, highly toxic8. In 2017, Delhi reported having the highest annual population-weighted mean PM2.5 concentration (209 μg/m3)9 much above the Indian (40 μg/m3)10 and WHO-recommended limit (10 μg/m3)2. The alarming levels of PM2.5 are regional problem and are significantly contributed by vehicular (20%) and industrial emissions (11%), cooking related emissions, biomass burning, construction activities, burning of Kharif (local term for monsoon or autumn crops) crop residue, windblown dust, Diwali fireworks, etc.1,3,10-13, and meteorological factors (temperature, relative humidity and wind velocity, etc.)14. The major chemical components of PM2.5 include secondary inorganic aerosol (16-28%), organic matter (13-20%), elemental carbon (4.6-6.3%), chloride (4.5-7.9%) and metals (14-24%). The levels of PM2.5 are ~20-30 per cent higher in winter than in the summer months due to high total secondary aerosols and combustion-related total carbonaceous matter (elemental carbon + organic matter). However, the crustal matter is observed to be higher in summer (42%) than in winter (9%)1,13. Various time-series studies suggest that short-term exposure to PM2.5 can induce acute respiratory symptoms such as cough and difficulty in breathing and aggravation of pre-existing condition15-19 while long-term exposure to PM2.5 can result in the development of cardiovascular and respiratory diseases7,15. Several epidemiological studies have documented that ambient PM levels in Delhi are associated with increased respiratory morbidity and mortality5,16,20-24. Air quality index (AQI) is a single index value used to provide information on daily air quality status and its associated health effects to public15,25,26. PM2.51,14 and AQI27 can vary depending on seasons, time of the day and locations in the same city26. Various studies from India11,14,28,29 and other parts of the world30-32 have explored geographic information system (GIS)-based tools, e.g., inverse distance weighting (IDW), kriging, etc., to estimate the spatio-temporal distribution of air pollutants and its associated heath impact. GIS is a powerful technique that can be used to accurately analyze the spatial and temporal patterns of respiratory morbidity32, chemistry of pollutants and localization of the area of potential threat33. Therefore, integration of GIS can aid in understanding environmental health modelling, infrastructure planning, transport monitoring, public transit planning, etc. A study from Delhi revealed that PM2.5 concentrations had very high temporal and spatial variations14. However, there is no study available in Delhi that has used GIS technique to assess the spatial and temporal association of ambient air pollution with daily counts of emergency room (ER) visits of patients related to acute respiratory symptoms. Therefore, this study was aimed to determine the spatio-temporal relationship between variation of PM2.5 concentrations and AQI with ER visits of patients having acute respiratory symptoms in Delhi, India, using GIS techniques.
Material & Methods
Study area: Delhi is geographically located in north India between 76° 50′ 24″ and 77° 20′ 37″ East longitude and 28° 24′ 17″ and 28° 53′ 00″ North latitude1,34. The study area included 22 Continuous Ambient Air Quality Monitoring Stations (CAAQMS) operated by the Delhi Pollution Control Committee (DPCC), New Delhi and four study hospitals of Delhi viz. All India Institute of Medical Sciences (AIIMS), Kalawati Saran Children Hospital & Lady Harding Medical College, National Institute of Tuberculosis & Respiratory Diseases and Vallabhbhai Patel Chest Institute, New Delhi. The study was carried out for 12 months (March 2018-February 2019) to obtain the data for all seasons.
Clinical data: Daily counts of ER visits of four study hospitals of Delhi was recorded to obtain the data for acute respiratory ER visits during the study period. All children visiting the ER of AIIMS (South West) and Kalawati Saran Children Hospital (Central) and adults visiting ER of AIIMS, National Institute of Tuberculosis and Respiratory Diseases (South West) and Vallabhbhai Patel Chest Institute (North) were screened round-the-clock for enrolment. Eligible children (0-15 yr) and adults were included only if, on presentation, they reported acute onset (less than or equal to two weeks) of respiratory symptoms or an acute exacerbation of a pre-existing lung disease in the last two weeks and were currently residing in Delhi (staying continuously for at least four weeks). The patients who were not available because of investigations or procedures or did not provide informed written consent to participate were excluded from the study. Residential PIN code along with demographic and clinical data were recorded. All four participating hospitals obtained approval from their respective Institutional Ethics Committees.
Air pollution data: Daily air quality, viz. 24 h average values for PM2.5, AQI and meteorological variables (temperature and relative humidity) were obtained from DPCC for 22 CAAQMS16,35. The description of 22 CAAQMS along with longitude, latitude and districts is presented in Table I.
| Location of CAAQMS | Latitude (North) | Longitude (East) | Districts |
|---|---|---|---|
| Jahangirpuri (Industrial Training Institute) | 28.732820 | 77.170633 | North West |
| Narela (Industrial Training Institute) | 28.822836 | 77.101981 | North |
| Sonia Vihar (DJB water treatment plant) | 28.710508 | 77.249485 | North East |
| Patparganj (Mother dairy plant) | 28.623748 | 77.287205 | East |
| Ashok Vihar (Satyawati College, GT Karnal Road) | 28.695381 | 77.181665 | North West |
| Nehru Nagar (PGDAV College, Sriniwaspuri) | 28.567890 | 77.250515 | South |
| Sri Aurobindo Marg (National Institute of Tuberculosis and Respiratory Diseases) | 28.531346 | 77.190156 | South West |
| Najafgarh (CBPACS) | 28.570173 | 76.933762 | South West |
| VivekVihar (ITI Shahdra) | 28.672342 | 77.315260 | East |
| PUSA (Naraina) | 28.639645 | 77.146263 | Central |
| National Stadium (Dhayanchand Stadium) | 28.611381 | 77.237738 | New Delhi |
| Jawahar Lal National Stadium | 28.580280 | 77.233829 | South |
| Dr. Karni Singh Shooting Range | 28.498571 | 77.264840 | South |
| Dwarka (National Institute of Malaria Research) | 28.576552 | 77.076574 | South West |
| Rohini sector-16 (Shaheed Sukhdev College of Business Studies) | 28.732528 | 77.119920 | North West |
| Wazirpur (Delhi Institute of Tool Engineering) | 28.699793 | 77.165453 | North West |
| Okhla Phase II (Delhi Institute of Tool Engineering) | 28.530785 | 77.271255 | South |
| Bawana (Maharshi Valmiki Hospital) | 28.776200 | 77.051074 | North West |
| Anand Vihar (ISBT) | 28.646835 | 77.316032 | East |
| Mandir Marg (N.P. Boys Sr. Sec. School) | 28.636429 | 77.201067 | Central |
| Punjabi Bagh (SKV No. 2) | 28.563262 | 77.186937 | West |
| R.K. Puram (KV Sec-2) | 28.674045 | 77.131023 | South West |
Source: Ref 35. DPCC, Delhi pollution control committee; CAAQMS, continuous ambient air quality monitoring station
AQI was used to assess the air quality status of the city. AQI given by the Central Pollution Control Board in 2014 was calculated by transforming real-time hourly concentrations of various air pollutants into single index value15,36. AQI varied from 0 to 500; values were categorized as: good (0-50), satisfactory (51-100), moderate (101-200), poor (201-300), very poor (301-400) and severe (401-500). The higher the value of AQI, the greater the level of air pollution. PM2.5 breakpoints were categorized as: good (<30 μg/m3), satisfactory (31-60 μg/m3), moderate (61-90 μg/m3), poor (91-120 μg/m3), very poor (121-250 μg/m3) and severe (>250 μg/m3)15,36,37. The time period of the study was divided into three seasons, viz. summer (March, April, May and June), monsoon season (July, August and September) and winter (October, November, December, January and February). In order to have the overall picture of air pollution levels in Delhi, the average PM2.5 and AQI was calculated for every location in three seasons. The total study duration of 365 days was divided according to AQI categories in each of the three seasons37.
Geographic information system mapping: GIS tools were used to study the spatio-temporal changes in PM2.5 levels, AQI and the associated daily counts of acute respiratory ER visits for the study duration. CAAQMS at different locations of a city represents the ambient air pollution for a particular point. Therefore, inverse distance weighted (IDW) interpolation method was used to spatially predict PM2.5 concentrations at unmeasured locations in the study area31. In order to locate spatially the number of enrolled patients coming from a particular area in a particular season, the numbers of enrolled patients were mapped by PIN code corresponding to each patient’s residential address. The maps were plotted for winter, monsoon and summer seasons on the basis of breakpoints PM2.5 pollutant and AQI. These maps were then compared in relation to air quality and number of acute respiratory ER visits of patients during different seasons and at different locations of Delhi. The analysis was done using ArcGIS software, version 10.3.1. (USA).
Statistical analysis: Pearson’s correlation analyses of PM2.5 levels with temperature and relative humidity were performed. Linear regression models were built for three seasons to assess the relationship between: (i) total enrolled cases and PM2.5 levels and (ii) duration of acute respiratory symptoms and indoor air pollution indicators (such as choice of cooking fuel, smoker at home, smoker and separate kitchen). The analysis was performed using “mgcv” package in R-software version 3.6 (https://cran.r-project.org/web/packages/mgcv/mgcv.pdf).
Results
During the study period, a total of 70,594 patients attending ER were screened from ER of the participating hospitals. Of these, 18,063 were found eligible of having acute respiratory symptoms (less than or equal to two weeks) and residing in Delhi for the past four weeks. Table II presents the characteristics of the enrolled patients. The average age (mean±SD) of enrolled children was 2.0±3.4 yr and that of enrolled adults was 47.9±16.4 yr, of whom 30.8 per cent (n=2427) were elderly (>60 yr). Adult patients experienced acute respiratory symptoms for 4.6±3.0 days. Among the enrolled children (n=10,186), 10,031 (98%) had cough, 7,439 (73%) had noisy breathing, 8,837 (87%) had difficulty in breathing and 8,901 (87%) reported nasal symptoms. Eighty six per cent (n=8,755) of the children were given ambulatory treatment, 1,394 (13%) were advised admission, and 30 (0.3%) were referred to other departments and seven (0.1%) expired. Among the enrolled adults (n=7877) visiting ER, 7,074 (90%) had cough, 3,953 (50%) had noisy breathing, 7,305 (93%) had difficulty in breathing and 1,970 (25%) had nasal symptoms. Of the enrolled adults who visited ER, 6,220 (79%) were given ambulatory treatment, 1,680 (17%) were advised admission, 40 (0.5%) were referred to other departments and eight (0.1%) expired. The mean number of household members was five living in the average of two-room houses of which about 82 per cent (n=6,462) had a separate kitchen. Around 28 per cent (n=1,631) of adult patients were smokers and 21 per cent (n=2,129) of children lived in households where family members/relatives regularly smoked. Seven hundred and sixty one patients (children: n=692; adults: n=69) had repeat visits during the study period. Of these, 277 patients (children=271; adults=6) visited ER in summer and visited again in winter.
| Parameters | Total enrolled children (n=10186) | Total enrolled adults (n=7877) |
|---|---|---|
| Age (yr) (mean±SD) | 2.0±3.4 | 47.9±16.4 |
| Sex, n (%) | ||
| Male | 6731 (37.3) | 4577 (58.1) |
| Female | 3455 (19.1) | 3300 (41.9) |
| Duration of symptoms (days) (mean±SD) | 3.6±2.1 | 4.6±3.0 |
| Respiratory symptoms, n (%) | ||
| Cough | 10,031 (98.5) | 7074 (89.8) |
| Noisy breathing | 7439 (73.0) | 3953 (50.2) |
| Difficulty in breathing | 8837 (86.8) | 7305 (92.7) |
| Nasal symptoms | 8901 (87.4) | 1970 (25.0) |
| Respiratory rate (per minute) (mean±SD) | 46.9±12.4 | 46.9±12.4 |
| Outcomes at 12 h, n (%) | ||
| Ambulatory treatment | 8755 (86.0) | 6220 (79.0) |
| Advised admission | 1394 (13.7) | 1608 (16.6) |
| Referred to other departments | 30 (0.3) | 40.0 (0.5) |
| Expired | 7 (0.1) | 8 (0.1) |
| Factors related to indoor air pollution | ||
| Households having separate kitchen, n (%) | 9048 (88.8) | 6462 (82.0) |
| Smoker at home, n (%) | 2129 (20.9) | 1387 (17.6) |
| Smoker, n (%) | - | 1631 (20.7) |
| Total number of rooms (mean±SD) | 1.9±1.20 | 2.6±1.4 |
| Total number of household members (mean±SD) | 5.0±2.2 | 5.6±2.3 |
SD, standard deviation
Table III summarizes the total number of enrolled patients, mean of PM2.5 concentrations, AQI and meteorological data of Delhi during the three seasons. PM2.5 concentrations of Delhi were high during the study period, with an annual 24-hourly average of PM2.5 being 120.6±87.0 µg/m³. The maximum concentrations of PM2.5 with worst AQI were observed in winter season, while relatively lower concentrations of PM2.5 with moderate AQI were noticed during summer, and minimum concentrations of PM2.5 with satisfactory AQI were observed in monsoon. The daily ER visits of patients having acute respiratory symptoms mirrored this seasonality in pollution (most in winter, followed by summer and monsoon season). Maximum relative humidity was recorded in monsoon while it was at its minimum during summer. The PM2.5 concentrations had significant negative correlations with temperature (r=−0.593, P≤0.001) and relative humidity (r=−0.249, P≤0.001). Of 365 days, 64 out of 151 days in winter were reported to have ‘very poor’ AQI. In summer, 54 out of 122 days were observed under ‘moderate’ category, while in monsoon, 48 out of 92 days were observed under ‘satisfactory’ AQI. None of the days during the study period was found to have ‘good’ air quality (AQI<50). The number of enrolled cases was relatively higher in winter months (41.2%) in comparison to summer (27.9%) and monsoon months (30.8%).
| Parameters | Annual | Summer | Monsoon | Winter |
|---|---|---|---|---|
| PM2.5 µg/m3 | 120.6±87.0 | 93.7±35.1 | 40.8±15.3 | 190.3±88.7 |
| AQI | 225.3±106.0 | 212.0±68.2 | 108.5±42.1 | 307.1±84.7 |
| Temperature (°C) | 25.8±7.0 | 30.9±4.2 | 30.2±2.1 | 19.0±4.7 |
| Humidity (%) | 60.8±16.9 | 42.2±12.0 | 77.1±9.4 | 65.6±7.5 |
| Total enrolled patients, n (%) | 18,063 | 5564 (30.8) | 5050 (27.9) | 7449 (41.2) |
Data presented in mean±SD unless otherwise indicated. Number of days: Total (March 2018-February 2019), n=365 days; Summer season (March - June 2018), n=122 days; Monsoon season (July-September 2018), n=92 days; Winter season (October 2018-February 2019), n=151 days. AQI, air quality index; SD, standard deviation; PM, particulate matter
Figure 1 shows the distribution of days (March 2018-February 2019) according to AQI range of categories for defining air quality of Delhi. The air quality and daily patient count attending ER due to acute respiratory symptoms varied in different regions and during different seasons of Delhi. Table IV summarizes the seasonal and annual mean concentrations of PM2.5 concentrations and AQI recorded from 22 CAAQMS in Delhi. During the study period, the lowest annual mean PM2.5 concentration was observed at Sri Aurobindo Marg, whereas the highest PM2.5 concentration was observed at Anand Vihar. The lowest annual mean AQI was in ‘poor’ category observed at Dr Karni Singh Shooting range station, whereas the highest AQI was in ‘very poor’ category reported at Anand Vihar.
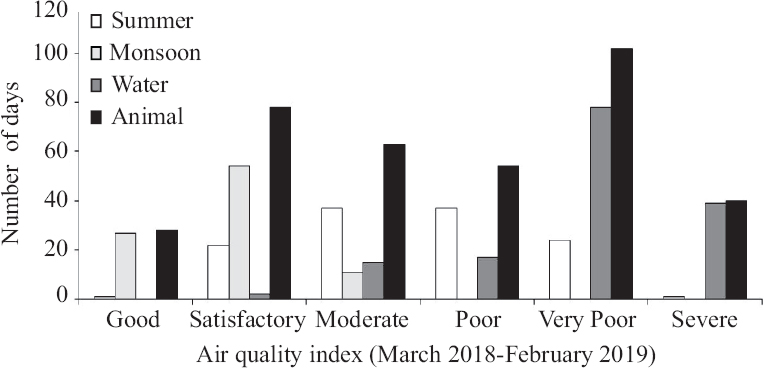
- Air quality index status of Delhi during the three seasons (March 2018-2019).
| CAAQMS locations | Seasons | |||||||
|---|---|---|---|---|---|---|---|---|
| Summer (n=122 days) | Monsoon (n=92 days) | Winter (n=151 days) | Annual (n=365 days) | |||||
| PM2.5 (µg/m3) | AQI | PM2.5 (µg/m3) | AQI | PM2.5 (µg/m3) | AQI | PM2.5 (µg/m3) | AQI | |
| Jahangirpuri (Industrial Training Institute) | 122.4±11.1 | 319.3±239.6 | 49.7±7.10 | 127.8±52.6 | 232.3±15.3 | 417.9±160.3 | 150.1±12.3 | 312.8±208.9 |
| Narela (Industrial Training Institute) | 109.7±37.7 | 297.3±192.7 | 45.7±18.8 | 102.1±43.4 | 188.7±79.6 | 342.9±102.9 | 126.3±80.8 | 266.9±163.6 |
| Sonia Vihar (DJB water treatment plant) | 96.5±37.4 | 254.6±168.6 | 38±15.5 | 91.3±37.1 | 200.3±97.3 | 349.7±102.9 | 124.7±94.7 | 252.7±159.9 |
| Patparganj (Mother Dairy plant) | 89.2±43.7 | 243.8±219.5 | 35.1±16.4 | 102.6±45.0 | 180.3±97.6 | 324.9±121.5 | 113.4±90.9 | 241.7±174.2 |
| Ashok Vihar (Satyawati College, GT Karnal road) | 100.1±39.2 | 297.2±248.6 | 39.7±20.2 | 106.9±48.8 | 209.4±137.6 | 363.4±154.8 | 130.1±115.7 | 276.6±203.9 |
| Nehru Nagar (PGDAV College, Sriniwaspuri) | 76.8±27.8 | 226.2±207.8 | 37.4±15.8 | 95.5±40.4 | 236.3±125.7 | 391.2±147.2 | 132.9±120.9 | 261.5±195.1 |
| Sri Aurobindo Marg, (National Institute of Tuberculosis and Respiratory Diseases) | 72.6±26.5 | 230.7±232.8 | 31±14.0 | 83.1±40.7 | 146.7±69.0 | 290.4±84.9 | 93.2±60.0 | 217.9±168.6 |
| Najafgarh (CBPACS) | 77.6±32.4 | 256.5±217.9 | 27.8±12.8 | 78.9±43.4 | 144.8±58.9 | 290.4±95.2 | 93±63.9 | 226.4±163.6 |
| Vivek Vihar (ITI Shahdara) | 96.2±46.1 | 237.9±115.8 | 43.1±19.7 | 113.4±53.7 | 181.7±117.7 | 366.9±157.3 | 118.2±98.9 | 259.6±160.1 |
| PUSA (Naraina) | 82.1±32.7 | 243.4±197.7 | 33.9±13.7 | 110.9±45.4 | 170.4±79.6 | 319.6±98.4 | 106.6±79.1 | 241.5±156.0 |
| National Stadium (Dhayanchand stadium) | 92.9±45.9 | 284.5±170.8 | 40.6±15.9 | 95.4±43.4 | 156.1±72.4 | 315.6±112.8 | 105.8±71.4 | 237.6±151.9 |
| Jawahar Lal National Stadium | 84.3±35.2 | 257.4±228.5 | 35.1±14.2 | 91.8±45.6 | 183.8±106.1 | 334.8±138.5 | 113.2±95.0 | 247.7±187.1 |
| Dr Karni Singh Shooting Range | 82.3±45.0 | 193.0±137.5 | 33.5±14.5 | 99.9±35.4 | 150.9±64.9 | 301.1±90.3 | 98.4±68.9 | 214.3±128.6 |
| Dwarka (National Institute of Malaria Research) | 89.4±37.5 | 284.4±212.5 | 35.8±15.9 | 132.7±64.5 | 166.7±83.2 | 398.8±162.5 | 107.9±78.9 | 293.5±195.1 |
| Rohini (Shaheed Sukhdev College of Business Studies) | 93.9±35.2 | 317.6±256.9 | 48.1±17.9 | 114.0±55.4 | 227.6±110.6 | 409.6±154.7 | 137.9±107.5 | 304.8±215.4 |
| Wazirpur (Delhi Institute of Tool Engineering) | 108.4±48.1 | 313.1±220.3 | 52.6±19.0 | 139.7±44.6 | 244.8±131.2 | 432.6±166.9 | 150.7±121.1 | 318.8±215.4 |
| Okhla Phase II (Delhi Institute of Tool Engineering) | 82.0±29.5 | 255.6±173.4 | 37.8±16.3 | 107.4±45.2 | 182.8±95.7 | 337.3±122.0 | 112.8±88.9 | 252.1±169.0 |
| Bawana (Maharshi Valmiki Hospital) | 126.7±52.2 | 313.7±157.5 | 51.7±20.3 | 113.4±49.9 | 186.4±82.4 | 390.7±134.5 | 133±82.3 | 295.1±169.0 |
| Anand Vihar (ISBT) | 113.7±52.6 | 333.4±156.6 | 51.1±21.9 | 156.6±70.7 | 220.8±113.1 | 431.7±208.7 | 153.4±107.4 | 349.6±213.6 |
| Mandir Marg (N.P. Boys Sr. Sec. School) | 82.4±31.5 | 213.9±145.7 | 41.3±19.7 | 105.8±47.6 | 169.8±78.7 | 310.1±98.3 | 108±76.7 | 225.4±135.2 |
| Punjabi Bagh (Sarvodaya Kanya Vidyalaya No. 2) | 88±31.9 | 247.2±216.1 | 43.7±14.9 | 105.8±37.8 | 187.2±89.4 | 341.4±137.3 | 117.5±85.7 | 249.0±180.2 |
| RK Puram (Kendiya Vidyalaya Sec-2) | 94.6±30.1 | 265.3±189.3 | 48.4±15.9 | 111.8±48.9 | 198.4±96.6 | 355.5±114.7 | 125.9±90.8 | 262.4±165.3 |
Data presented in mean±SD. AQI, air quality index; PM, particulate matter; CAAQMS, Continuous Ambient Air Quality Monitoring Station; PM, particulate matter
Figure 2 shows the spatio-temporal relationship between seasonal variation of PM2.5 concentrations obtained from 22 CAAQMS of Delhi versus enrolled cases [i.e., having acute respiratory symptoms (less than or equal to two weeks) and residing in Delhi for the past 4 wks] in three seasons, viz. monsoon, summer and winter from March 2018 to February 2019. The seasonal mean values of PM2.5 concentrations at each station and number of enrolled cases from various regions of Delhi were relatively higher in winter months (Fig. 2C) compared to summer (Fig. 2B) and monsoon months (Fig. 2A). During the winter season, it was observed that the number of enrolled children had a negative correlation (β=−0.02, P=0.01) while number of enrolled adults had a positive association (β=0.01, P=0.03) with PM2.5 concentrations. The duration of acute respiratory symptoms was not found to be associated with indoor air pollution indicators such as cooking fuel (β=−0.30, p=0.49) and separate kitchen (β=−0.17, P=0.06) in households, smoking status (β=−0.17, P=0.15) and smoker at house (β=0.04, P=0.56) during winters. As shown in Figure 2C, during the winter season, the number of enrolled cases was high in ‘very poorly polluted’ north-west region (n=1886, PIN code 110 086, Begumpur) of Delhi exposed to the highest mean levels of PM2.5 (244.8±131.8 and 232.3±109.5 µg/m3) observed at Wazirpur and Jahangirpuri monitoring station, respectively, situated in northwest of Delhi. The number of enrolled cases reporting to ER was lower from the ‘moderately polluted’ southwest region (n<5, PIN code 110 080, Sangam Vihar; 110 060, Rajinder Nagar; 110 066, RK Puram; 110 072, Jharoda Kalan; 110 097, Kapashera etc.) of Delhi exposed to relatively lower mean levels of PM2.5 (144.8±58.9 and 146.7± 69.0 µg/m3) recorded at Najafgarh and Sri Aurobindo Marg station, respectively, during the same season.
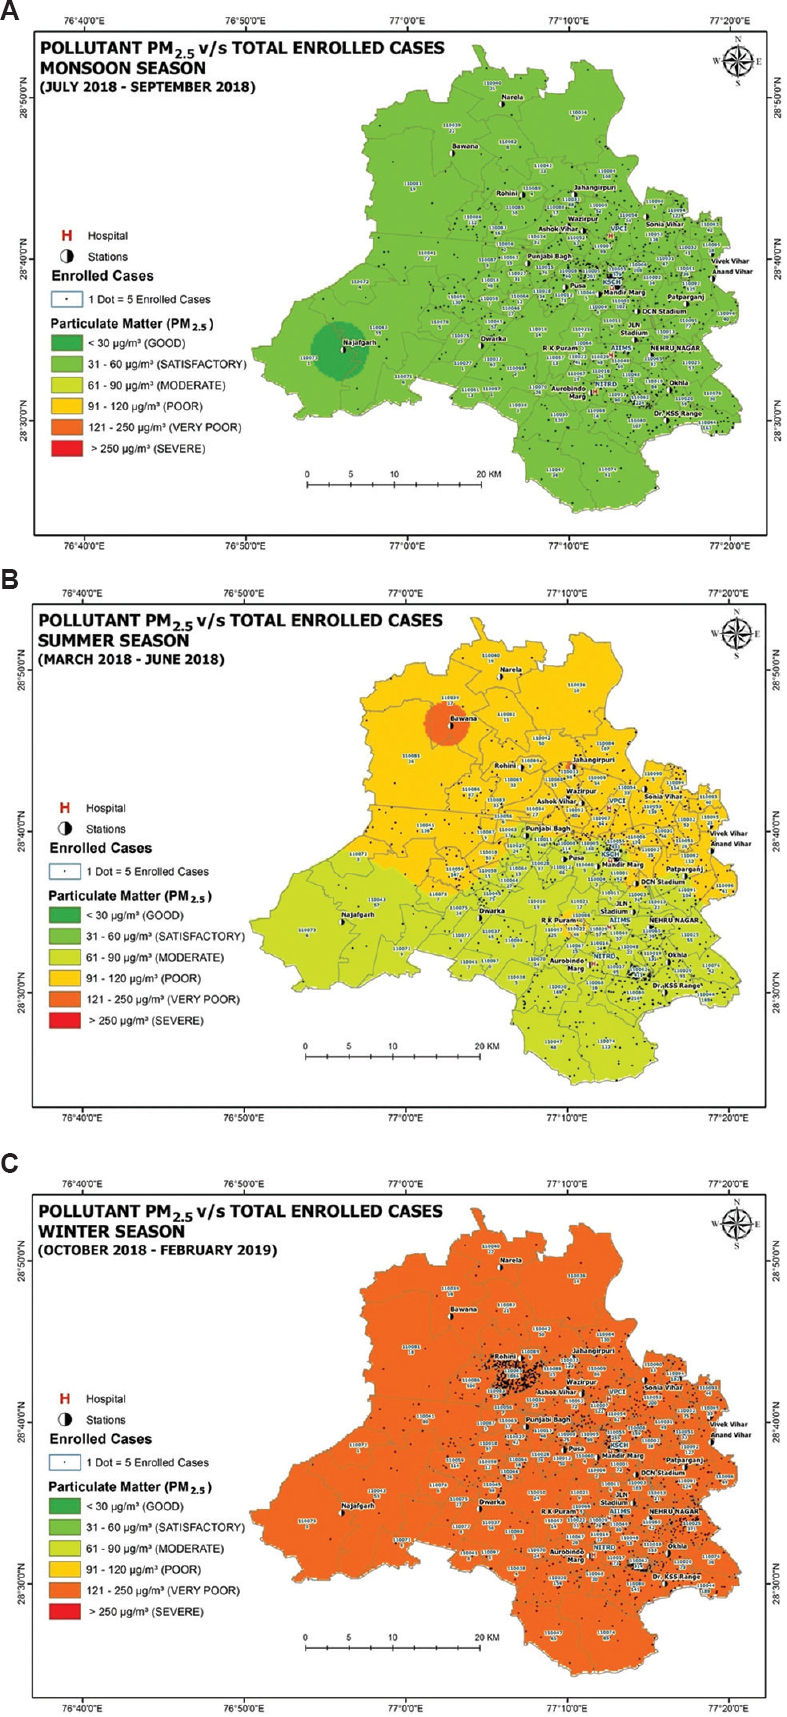
- Spatio-temporal relationship between the seasonal variation of PM2.5 concentrations obtained from 22 Continuous Ambient Air Quality Monitoring Station of Delhi versus enrolled cases in three seasons from March 2018-February 2019: (A) Monsoon, (B) Summer, and (C) Winter.
Figure 3 shows the spatio-temporal relationship between seasonal variations of AQI obtained from 22 CAAQMS of Delhi vs. enrolled cases in three seasons vs. monsoon, summer and winter. The seasonal mean AQI of 22 continuous monitoring stations ranges from ‘poor’ to ‘severe’ and the number of enrolled cases was relatively higher in winter months (Fig. 3C) contrasting with the relatively better AQI observed in summer (Fig. 3B) and monsoon months (Fig. 3A). As shown in Figure 3C, during winter season, the number of enrolled cases was high in the ‘severely polluted’ northwest region (n=1886, PIN code 110 086) of Delhi having high AQI (433) observed at Wazirpur station. The number of enrolled cases reporting at ER was low from the ‘poorly polluted’ southwest region (n<5, PIN code 110 038, Rajokari; 110 060, 66, 72, 97, etc.) of Delhi having comparatively low AQI (290 and 291) observed at Sri Aurobindo Marg and Najafgarh station, respectively.
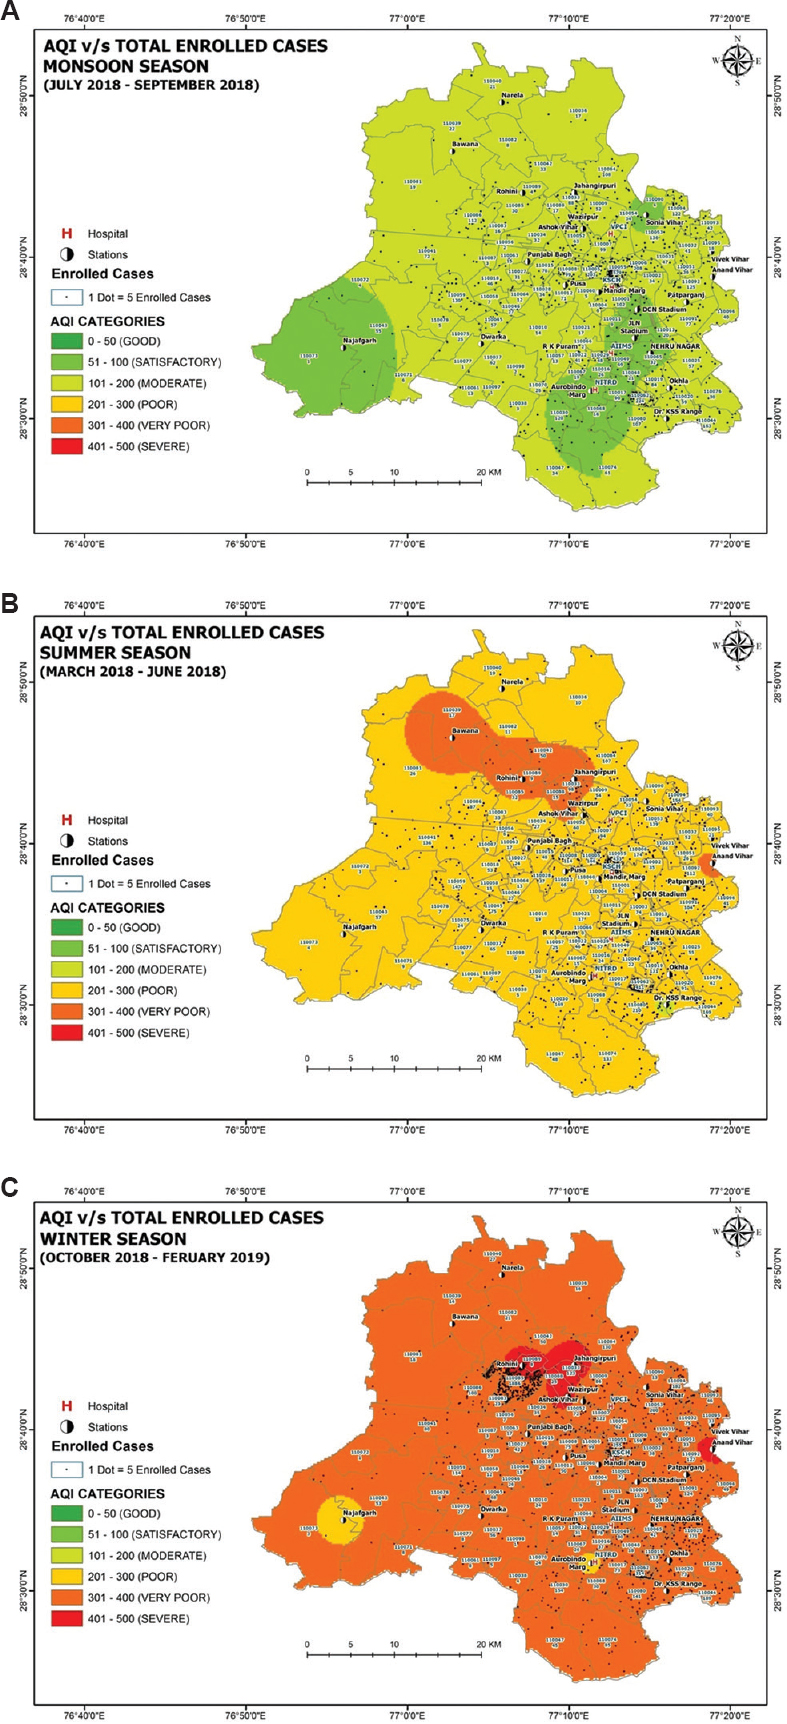
- Distribution of average air quality index obtained from 22 Continuous Ambient Air Quality Monitoring Stations of Delhi versus enrolled cases in three seasons from March 2018-February 2019: (A) Monsoon, (B) Summer, and (C) Winter.
Discussion
The study examined the spatio-temporal relationship between seasonal variation of PM2.5 concentrations, AQI and related ER visits of patients having acute respiratory symptoms in Delhi. During the study period, the annual average of PM2.5 concentration (120.6±87.0 µg/m³) in Delhi exceeded the Indian-recommended limits10. Such finding has been consistently reported by previous Delhi-based studies3,6,9,14,37. There was not a single day to register ‘good’ AQI37. AQI was ‘poor’ for most of the winter days compared to summer and monsoon reporting ‘moderate’ and ‘satisfactory’ AQI, respectively. The minimum annual mean PM2.5 concentration was noticed at Sri Aurobindo Marg situated in south-west Delhi district5. The maximum PM2.5 concentration was observed at Anand Vihar37, which is one of the most polluted areas in Delhi due to high traffic congestion and is affected by emissions from road dust, industries, commercial activities of hotels, etc.27,37. The variation observed in the PM2.5 levels in the present study could be due to the type of emission sources1,10-12 and meteorological factors14. Several Indian reports5,12,14,27-29 have recognized that there is significantly high seasonal and regional variation in ambient air quality and prevalence of respiratory symptoms. Low temperature and high relative humidity play a vital role in the formation and rise in PM2.5 levels, thereby resulting in evident seasonal variation in air quality3. In the current study, a weak and negative correlation was found between PM2.5 versus temperature and relative humidity38. GIS analysis showed that spatio-temporal association between air pollution and the number of ER visits for acute respiratory symptoms varied across different geographic areas of Delhi during three different seasons. In winter, ER visits of patients having acute respiratory symptoms were higher from the north-west region of Delhi exposed to very high air pollution recorded at Wazirpur and Jahangirpuri station. Furthermore, enrolled children had negative, whereas adults had a positive association with PM2.5 levels. Adults are more likely to be exposed to outdoor environmental pollution and even for longer duration, for example, commuting to work place; hence, they might have different intensity of cumulative exposure than children. In contrast, the southwest region of Delhi was less polluted (Najafgarh and Sri Aurobindo Marg station) corresponding to the low ER visits of patients. These results were in line with a previous study from Kanpur, India, which concluded that individuals with respiratory disease were at greater risk of hospital visits than those residing in low polluted area28.
The study had some limitations. First, the present study, we used a wide network of air quality monitoring stations spread around the city; however, the hospitals from each region of Delhi could not be included for collecting daily counts of acute respiratory ER visits. Second, adjustment for differential lifetime exposure to environmental pollutants of children and adults was not possible. Third, assessment of personal exposure at home and workplace to air pollution was practically not feasible in large sample, which could better illustrate the health impact of ambient air pollution32. Fourth, we could not study the sources of regional emission that could have helped us to know the reason for observed pattern. Fifth, we could not take into account the levels of indoor air pollutants and individual exposures to the pollutants that might have affected the quality of associations. Despite these limitations, the present study had several strengths. First, this multisite study had covered a large sample size in Delhi, India. Second, it was possible to study the role of seasonal variation in spatio-temporal association between ambient air pollution and acute respiratory ER visits in Delhi using novel GIS tools. Regional health impact was estimated based on PM2.5 levels and AQI. Although AQI is not a refined tool, it is an easily understandable generic information tool and help drafting advisories issued to the public. Third, we obtained 24 hourly real-time air quality data of Delhi from 22 newly installed DPCC CAAQMS on the daily basis, which contributed to high spatial resolution and robust results.
To strengthen the findings of the present study, systematic investigations are needed in Delhi to: (i) establish adequate monitoring system for air quality and health outcomes, (ii) demonstrate the causal relationship between air pollution and associated health outcomes and (iii) identify emission sources and their contribution to air pollution and economic evaluation of health impact of air pollution1,29. Severity of air pollution starts from post-monsoon and continues through winter. We acknowledge that indoor air pollution has a significant role to play in the type of investigation we conducted. In the present study, poor air quality was observed for majority of the days throughout the year in Delhi. Therefore to gain potential health benefits, effective measures to control air pollution should be executed throughout the year instead of focusing only during highly polluted winter season. In India, air pollution is one of the causes for producing damaging health effects and not the only cause as there are many aspects such as socio-economic issues, living conditions, location of emission sources, land use pattern, occupational exposure, food habit, other health ailments, etc. Growing evidence suggests that specific toxic compounds of PMs produce harmful effects on lungs and are carcinogenic and genotoxic. The exposure to PM may induce inflammatory response, oxidative stress, hormone dysregulation39 as well as placental dysfunction40. Therefore, geo-spatial distribution of respiratory diseases associated ER visits may serve as a good tool for location-based prevention and control of outdoor air pollution. The present study findings provide reference for decision-makers to improve air quality and related health outcomes at specific locations in Delhi. The study also provides, relevant information for public to modify their outdoor behaviour according to exposure to varying ambient air pollution.
Overall, the acute respiratory symptoms related ER visits of patients were associated with PM2.5 concentrations and AQI that varied by regions and seasons in Delhi. The study provides GIS-based scientific evidence for policy-makers to make adequate regional monitoring and emphasize localized improvement strategies for management of air pollution and associated respiratory health outcomes in Delhi.
Acknowledgement:
The maps were outsourced and done by ML Infomap Pvt. Ltd., New Delhi, India
Financial support & sponsorship: The study was funded by the Indian Council of Medical Research, New Delhi, India (grant no. 68/33/2015-NCD-I).
Conflicts of Interest: None.
References
- Characterization of PM2.5 in Delhi: Role and impact of secondary aerosol, burning of biomass, and municipal solid waste and crustal matter. Environ Sci Pollut Res Int. 2017;24:25179-89.
- [Google Scholar]
- Human health risks in national capital territory of Delhi due to air pollution. Atmospheric Poll Res. 2014;5:371-80.
- [Google Scholar]
- Seasonal variation, source apportionment and source attributed health risk of fine carbonaceous aerosols over National Capital Region, India. Chemosphere. 2019;237:124500.
- [Google Scholar]
- Air pollution and public health: the challenges for Delhi, India. Rev Environ Health. 2018;33:77-86.
- [Google Scholar]
- Air pollution in Delhi, India: It's status and association with respiratory diseases. PLoS One. 2022;17:e0274444.
- [Google Scholar]
- An integrated statistical approach for evaluating the exceedence of criteria pollutants in the ambient air of megacity Delhi. Atmos Environ. 2013;70:7-17.
- [Google Scholar]
- Ambient (outdoor) air pollution. Available from: https://www.who.int/news-room/fact-sheets/detail/ambient-(outdoor)-air-quality-and-health
- Toxic potential of ambient particulate matter in various urban areas of the world and its relation to chemical composition and emission sources. Eur Respir J. 2014;44((Suppl 58)):P4132.
- [Google Scholar]
- The impact of air pollution on deaths, disease burden, and life expectancy across the states of India: The Global Burden of Disease Study 2017. Lancet Planet Health. 2019;3:e26-39.
- [Google Scholar]
- Ministry of Environment. Forest and Climate Change, Government of India. National Ambient Air Quality Status and Trends in India-2010. Available from:http://cpcb.nic.in/openpdffile.php?id=UHVibGljYXRpb25 GaWxlLzYyOF8 xNDU3N TA1MzkxX1B1Ymxp Y2F0aW9uXzUy MF9OQUFRU1RJLnBkZg
- Objective evaluation of stubble emission of North India and quantifying its impact on air quality of Delhi. Sci Total Environ. 2020;709:136126.
- [Google Scholar]
- Estimates of air pollution in Delhi from the burning of firecrackers during the festival of Diwali. PLoS One. 2018;13:e0200371.
- [Google Scholar]
- A GIS based emissions inventory at 1 km ×1 km spatial resolution for air pollution analysis in Delhi, India. Atmos Environ. 2013;67:101-11.
- [Google Scholar]
- Spatio-temporal variation of particulate matter (PM2.5) concentrations and its health impacts in a Mega City, Delhi in India. Environ Health Insights. 2018;12:1178630218792861.
- [Google Scholar]
- Ministry of Environment, Forests and Climate Change, Government of India. Available from: https://app.cpcbccr.com/ccr_docs/FINAL-REPORT_AQI_.pdf
- Effects of ambient air pollution on emergency room visits of children for acute respiratory symptoms in Delhi, India. Environ Sci Pollut Res Int. 2021;28:45853-66.
- [Google Scholar]
- Part 1. Short-term effects of air pollution on mortality:Results from a time-series analysis in Chennai, India. Res Rep Health Eff Inst. 2011;157:7-44.
- [Google Scholar]
- Time-series analysis of ambient PM2.5 and cardiorespiratory emergency room visits in Lima, Peru during 2010-2016. J Expo Sci Environ Epidemiol. 2020;30:680-8.
- [Google Scholar]
- Acute effects of ambient air pollution on outpatient children with respiratory diseases in Shijiazhuang, China. BMC Pulm Med. 2018;18:150.
- [Google Scholar]
- Assessing respiratory morbidity through pollution status and meteorological conditions for Delhi. Environ Monit Assess. 2006;114:489-504.
- [Google Scholar]
- Ambient air pollution and chronic respiratory morbidity in Delhi. Arch Environ Health. 2001;56:58-64.
- [Google Scholar]
- Air pollution and associated respiratory morbidity in Delhi. Health Care Manag Sci. 2008;11:132-8.
- [Google Scholar]
- Association of air quality with respiratory and cardiovascular morbidity rate in Delhi, India. Int J Environ Health Res. 2018;28:471-90.
- [Google Scholar]
- PM2.5 exposure in highly polluted cities:A case study from New Delhi, India. Environ Res. 2017;156:167-74.
- [Google Scholar]
- India launches air quality index to tackle pollution problems. Lancet Oncol. 2015;16:e203.
- [Google Scholar]
- Air pollution and chronic airway diseases:What should people know and do?J Thorac Dis . . 2016;8:E31-40.
- [Google Scholar]
- An analysis of the annual and seasonal trends of air quality index of Delhi. Environ Monit Assess. 2007;131:267-77.
- [Google Scholar]
- Respiratory disease in relation to outdoor air pollution in Kanpur, India. Arch Environ Occup Health. 2013;68:204-17.
- [Google Scholar]
- Air quality mapping using GIS and economic evaluation of health impact for Mumbai City, India. J Air Waste Manag Assoc. 2016;66:470-81.
- [Google Scholar]
- Association of geographical distribution of air quality index and type 2 diabetes mellitus in Isfahan, Iran. Pak J Med Sci. 2015;31:369-73.
- [Google Scholar]
- Burden of disease attributed to ambient air pollution in Thailand:A GIS-based approach. PLoS One. 2017;12:e0189909.
- [Google Scholar]
- A GIS-based spatial correlation analysis for ambient air pollution and AECOPD hospitalizations in Jinan, China. Respir Med. 2015;109:372-8.
- [Google Scholar]
- The use of GIS to evaluate traffic-related pollution. Occup Environ Med. 2007;64:1-2.
- [Google Scholar]
- Ministry of Enviornment, Forest and Climate Change, Governmant of India. Air pollution in Delhi:An analysis. Available from:http://cpcbenvis.nic.in/envis_newsletter/Air%20pollution%20in%20Delhi.pdf
- Real time ambient air quality data of Delhi, India. Available from:https://www.dpccairdata.com/dpccairdata/display/index.php
- Gender disparity in lung function abnormalities among a population exposed to particulate matter concentration in ambient air in the National Capital Region, India. J Health Pollut. 2015;5:47-60.
- [Google Scholar]
- Assessment of the effectiveness of policy interventions for Air Quality Control Regions in Delhi city. Environ Sci Pollut Res Int. 2019;26:30967-79.
- [Google Scholar]
- Influence of temperature, relative humidity and seasonal variability on ambient air quality in a coastal urban area. Int J Atmos Sci. 2013;2013:e264046.
- [Google Scholar]
- Evaluation of adverse effects of particulate matter on human life. Heliyon. 2021;7:e05968.
- [Google Scholar]
- Association of prenatal ambient air pollution exposure with placental mitochondrial dna copy number, telomere length and preeclampsia. Front Toxicol. 2021;3:65940-7.
- [Google Scholar]


