
Translate this page into:
Fracture risk prediction & kidney function at different stages of chronic kidney disease: A correlation study
For correspondence: Dr Rajesh Jhorawat, Department of Nephrology, All India Institute of Medical Sciences, Jodhpur 342 005, Rajasthan, India e-mail: jhorawat2000@gmail.com
-
Received: ,
Accepted: ,
Abstract
Background & objectives
Mineral bone disease commonly occurs in individuals with chronic kidney disease (CKD) and increases fracture risk due to deficiency in bone quality and quantity. The FRAX score attempts to estimate fracture risk better. The primary aim of this study was to evaluate the prediction and correlation of fracture risk with different stages of CKD.
Methods
This was a correlational study. Data were collected from 95 individuals at different stages of CKD using non-probability consecutive sampling. The clinical and laboratory parameters were compared with the FRAX score in all CKD patients.
Results
A total of 95 CKD patients with a mean age of 51.42±9.95 yr were selected. Of these, 66.3 per cent between 40-55 yr, 25.3 per cent were 56-70 yr, and 8.4 per cent were ≥70 yr. There were 62 (65.3%) males and 33 (34.7%) females, and more than half (60%) were from rural areas. Age (P<0.001), occupation (P<0.005), and area of residence (P<0.003) showed a significant association with the FRAX score for major osteoporotic fracture risk. The FRAX score for predicting hip fracture risk showed a significant association with factors such as age, occupation, and area of residence, with P values of <0.001, 0.003, and 0.031, respectively. Additionally, the FRAX score for assessing the risk of major osteoporotic fractures demonstrated a significant association with various stages of CKD (P=0.018). Similarly, for hip fracture, there was a significant increase in the risk between stage III and V CKD patients (P=0.038).
Interpretation & conclusions
Based on the study findings it was found that the FRAX score was significantly associated with different stages of CKD, both for major osteoporotic as well as hip fracture risk.
Keywords
Bone mineral density
chronic kidney disease
DEXA scan
FRAX score
fracture risk

Chronic kidney disease (CKD) is a prevalent health issue and is emerging as a significant cause of mortality1. CKD affects an estimated 10 to 13 per cent of individuals worldwide, representing a significant global health concern2. A population-based study in India reported age-adjusted and crude incidence rates of end-stage renal disease (ESRD) at 151 and 232 per million people, respectively3. CKD patients have an elevated risk of bone mineral disease, which has long contributed to increased morbidity and reduced quality of life4,5. By the time patients begin dialysis, at least 50 per cent have experienced fractures due to reduced bone mass and impaired bone microarchitecture, a condition that worsens as kidney function declines6.
The CKD Registry of India collects data from numerous centres; however, there is still a lack of comprehensive information regarding the profile of untreated CKD-MBD (mineral bone disease) in patients before initiating dialysis and in those on maintenance haemodialysis (MHD)7. The prevalence of renal osteodystrophy (ROD) is reported to range between 90 per cent and 100 per cent among individuals with advanced kidney disease and those undergoing MHD8,9. Advanced imaging methods, such as dual-energy X-ray absorptiometry (DEXA) for assessing bone volume and mineralisation, and quantitative computerised tomography (CT) for evaluating bone volume and structure, can non-invasively measure aspects of ROD. FRAX is a tool that aids clinicians and researchers in identifying individuals who are at high risk for fragility fractures, but its effectiveness in the CKD population needs further evaluation10. The FRAX tool significantly improved the ability to identify individuals at high risk for fragility fractures11-14. This issue has, however, not been extensively studied in the Indian CKD population so far. While FRAX can serve as a reliable tool for assessing fracture risk in CKD stages I–III, there is limited information on its effectiveness for predicting fracture risk in individuals with advanced CKD. Hence, this study was designed to assess the relationship between FRAX scores in different stages of CKD.
Materials & Methods
The non-experimental correlational research was conducted in July-December 2023 in the department of Nephrology, All India Institute of Medical Sciences Jodhpur, a tertiary care teaching hospital in Rajasthan, India. The institute’s ethical clearance was obtained from the Institutional Ethics Committee. The confidentiality and anonymity of the subjects was maintained throughout the study. The non-probability consecutive sampling technique was used to recruit the patients with CKD.
Sample size
The sample size was determined based on a comparable study15, utilising the prevalence formula N=(Z1-α/2)2(p)(q)/d.2 Here, d represents the margin of error, set at five per cent (0.05). The value t=1.96 corresponds to the standard deviation score for a 95 per cent confidence interval. The assumed or estimated proportion was P=5.9 per cent (0.059), and q was calculated as 1-P=0.941. The sample size was estimated as 86.
Inclusion/exclusion criteria
The participants included were CKD patients with estimated glomerular filtration rate (eGFR) ≤ 60 ml/min/1.73m2 not on dialysis and age ≥40 yr attending nephrology OPD. Those with skeletal deformities and diagnosed with osteoporosis were excluded.
Study parameters
The patients’ demographic and clinical profile, including age, BMI, education, occupation, dietary habit, area of residence, family history of CKD, duration of symptoms, and stages of CKD, were noted. Age, haemoglobin, serum uric acid level, serum electrolytes, total protein, serum albumin, serum globulin, liver function test, phosphorus, calcium, serum PTH level, and vitamin D level were estimated. For the assessment of bone mineral density, we used a DEXA scan (Manufacturer- Hologic Horizon A) of the neck of the femur, and fracture risk was calculated by using the FRAX Score tool16 with the clinical risk factor response records as ‘yes’ or ‘no’, and BMD (bone mineral density) and calculated major osteoporotic fracture risk and hip fracture risk.
Statistical analysis
The data were organised and analysed using SPSS version 29.0 (IBM corp., TX, USA) for macOS. Descriptive statistics were performed, including mean, standard deviation, frequency, and percentage distribution. For inferential statistics, the Kolmogorov-Smirnov Test was used to check data normality. The results indicated that the data did not follow a normal distribution (P<0.05), leading to the use of non-parametric tests. Spearman’s coefficient was applied for continuous variables, the Mann-Whitney U test for comparisons between two groups, the Kruskal-Wallis test for comparisons involving more than two groups, and regression analysis was conducted to determine factors influencing the FRAX score in CKD patients based on clinical parameters.
Results
The mean age of the participants was 51.42±9.95 yr. Of the total numbers of CKD patients, 66.3 per cent were between 40-55 yr, 25.3 per cent were 56-70 yr, and 8.4 per cent were ≥70 yr. The number of males was (65.3%), more than females (34.7%). More than half (60%) of total participants were from rural areas. 21.1 per cent, 25.3 per cent, and 53.7 per cent of patients were on CKD stages III, IV and V, respectively. Among laboratory parameters, mean serum creatinine was 5.32±3.19 mg/dl, serum urea level was 86.63±49.81 mg/dl, and mean eGFR was 17.96±13.36 ml/min. Bone mineral markers like serum calcium were 8.38±1.26 mg/dl, phosphorus was 5.28±2.02 mg/dl, serum vitamin D was 17.31±13.17 ng/ml, and iPTH was 349.81±564.71 pg/ml. The average femoral neck BMD of the study participants was 0.69±0.138. Table I presents the baseline characteristics of the study population.
| Parameters | Number (%) |
|---|---|
| Age (in yr) mean±SD | 51.42±9.955 |
|
40-55 56-70 >70 |
63 (66.3) 24 (25.3) 08 (08.4) |
| Gender | |
|
Male Female |
62 (65.3) 33 (34.7) |
| Occupation | |
|
Unemployed Public Sector Business/other |
34 (35.8) 03 (03.2) 58 (61) |
| Area of residence | |
|
Urban Rural |
38 (40) 57 (60) |
| Dietary habits | |
|
Vegetarian Non vegetarian |
72 (75.8) 23 (24.2) |
| Cause of CKD | |
|
Diabetes mellitus Hypertension Stone disease CGN Other cause |
15 (15.8) 32 (33.7) 06 (06.3) 14 (14.7) 28 (29.5) |
| Stages of CKD | |
|
Stage III Stage IV Stage V |
20 (21.1) 24 (25.3) 51 (53.7) |
| Body mass index, mean±SD | 23.15±3.37 |
|
Underweight Normal weight Overweight Obesity |
07 (7.4) 61 (64.2) 25 (26.3) 02 (2.1) |
| Laboratory parameters | |
|
Serum creatinine (mg/dl) Serum urea (mg/dl) eGFR Serum potassium (mEq/l) Serum chloride (mEq/l) Serum calcium (mg/dl) Serum phosphorus (mg/dl) Vitamin D level (ng/ml) Serum iPTH (pg/ml) Femoral neck BMD T score |
5.32±3.19 86.63±49.81 17.96±13.36 4.76±0.851 101.25±5.31 8.389±1.268 5.28±2.02 17.31±13.17 349.81±564.71 0.690±0.138 -1.383±1.156 |
| FRAX-score (%) | |
| Major osteoporotic fracture risk | |
|
Overall CKD 3 CKD 4 CKD 5 |
3.36±3.38 1.94±1.42 3.18±3.97 4.01±3.67 |
| Hip fracture risk | |
|
Overall CKD stage III CKD stage IV CKD stage V |
1.17±1.75 0.55±0.74 1.26±2.23 1.38±1.76 |
CKD, chronic kidney disease; CGN, chronic glomerulonephritis, eGFR, estimated glomerular filtration rate; iPTH, intact parathyroid hormone; BMD, bone mineral density; FRAX, fracture risk assessment tool
Age was significantly associated with the FRAX-Score for major and hip osteoporotic fracture risk. In addition, occupation, area of residence, and stage of CKD were significantly associated with the FRAX score, as shown in supplementary table I, supplementary figures 1 and 2. Among laboratory parameters, eGFR, serum urea, serum chloride, and BMI were significantly associated with FRAX-Score (Supplementary Table II). In regression analysis, age, occupation, area of residence, and stage of CKD were independently associated with FRAX-Score for major osteoporotic fracture risk in this study (Table II; Fig. 1). Age, occupation, and resident area were significantly associated with the FRAX score for hip fracture risk. Overall, the FRAX-Score for hip fracture risk was not associated with the CKD stage; however, there was a significant increase in the hip fracture risk when stages III and V were compared (Fig. 2; Table III). In the different stages of CKD, the FRAX-Score for major osteoporotic fracture and hip fracture risk, age strongly contributes to fracture risk (Fig. 3 and 4). Table III shows that in CKD stage III, 50 per cent of the participants were normal, 40 per cent had osteopenia, and 10 per cent had osteoporosis. In CKD stage IV, 29.2 per cent of participants were normal, 54.4 per cent had osteopenia, and 16.7 per cent had osteoporosis. Similarly, in CKD stage V, 25.5 per cent had normal BMD, 64.7 per cent had osteopenia, and 9.8 per cent had osteoporosis.
| Parameter | Major osteoporotic risk | Hip fracture risk | ||||
|---|---|---|---|---|---|---|
| OR | CI (95%) | P value | OR | CI (95%) | P value | |
|
BMI Serum urea (mg/dl) Serum chloride (mEq/l) eGFR |
1.072 1.006 1.015 1.061 |
-0.046 to 0.185 -0.004 to 0.016 -0.004 to 0.033 -0.009 to 0.128 |
0.239 0.235 0.122 0.088 |
1.032 1.009 1.011 1.05 |
-0.085 to 0.147 -0.001 to 0.019 -0.008 to 0.03 -0.014 to 0.124 |
0.6 0.095 0.244 0.119 |
| Age (yr) | ||||||
|
40-55 55-70 >70 |
0.035 0.280 - |
4.868 to -1.816 -2.862 to 0.318 - |
<0.001 0.117 |
0.084 0.265 - |
-3.95 to -1.009 -2.905 to 0.252 - |
0.001 0.100 |
| Occupation | ||||||
|
Unemployed Public Sector Business/Other |
0.874 20.257 - |
-1.175 to 0.905 0.600 to 5.417 - |
0.80 0.014 |
0.947 63.159 - |
-1.099 to 0.991 1.651 to 6.64 - |
0.919 0.001 |
| Area of Residence | ||||||
|
Urban Rural |
4.914 - |
0.724 to 2.46 - |
<0.001 |
2.904 - |
0.212 to 1.919 - |
0.014 |
| Stage of CKD | ||||||
|
Stage III Stage IV Stage V |
0.020 0.201 - |
-6.189 to -1.618 -2.862 to - 0.346 - |
0.001 0.012 |
0.070 0.331 - |
-4.918 to -0.393 -2.364 to -0.153 - |
0.021 0.085 |
Significant at P<0.05; BMI, body mass index; eGFR, estimated glomerular filtration rate; CKD, chronic kidney disease; OR, odds ratio; CI, confidence interval
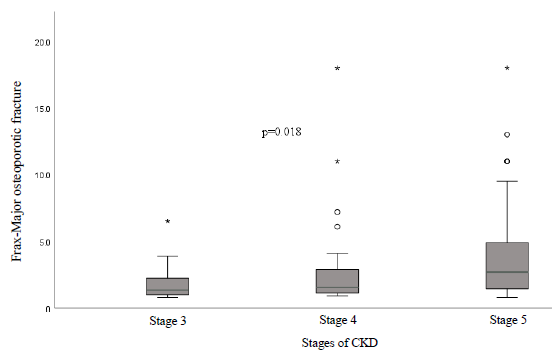
- FRAX Score of major osteoporotic fracture among individuals with different stages of CKD. The boxplot diagram shows that the average 10-yr probability of major osteoporotic fracture risk in stage V was observed to be significantly higher (P= 0.018) than that in stage IV and stage III. Further investigation through post hoc testing revealed that there was a statistically significant difference found between major osteoporotic fracture risk for stage IV and stage V patients with CKD (P=0.017) and similarly stage III and stage V patients with CKD (P=0.010).
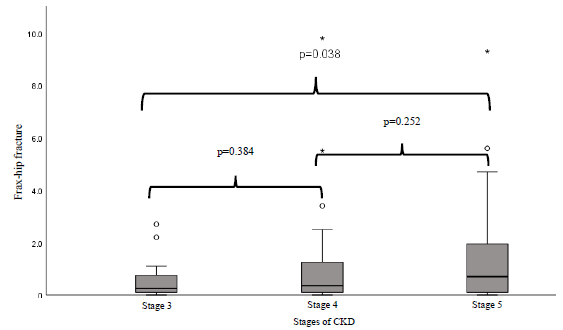
- FRAX Score of hip fracture among individuals with different stages of CKD. The boxplot diagram shows that the average 10-year probability hip fracture risk increases with stage of CKD. Further investigation through post hoc testing revealed that there was a statistically significant difference found between hip fracture risk for stage III and stage V patients with CKD (P= 0.038).
| Parameters | Normal, n (%) | Osteopenia, n (%) | Osteoporosis, n (%) | Total |
|---|---|---|---|---|
| Age (in yr) | ||||
| 40-55 | 23 (36.51) | 34 (53.97) | 6 (9.52) | 63 |
| 56-70 | 6 (25) | 15 (62.5) | 3 (12.5) | 24 |
| >70 | 1 (12.5) | 5 (62.5) | 2 (25) | 8 |
| Occupation | ||||
| Unemployed | 10 (29.41) | 18 (52.94) | 6 (17.65) | 34 |
| Public Sector | 0 (0) | 3 (100) | 0 (0) | 3 |
| Business/Other | 20 (34.48) | 33 (56.9) | 5 (8.62) | 58 |
| Area of residence | ||||
| Urban | 9 (23.68) | 23 (60.53) | 6 (15.79) | 38 |
| Rural | 21 (36.84) | 31 (54.39) | 5 (54.39) | 57 |
| Stages of CKD | ||||
| Stage III | 10 (50) | 8 (40) | 2 (10) | 20 |
| Stage IV | 7 (29.2) | 13 (54.4) | 4 (16.7) | 24 |
| Stage V | 13 (25.5) | 33 (64.7) | 5 (9.8) | 51 |
WHO defines osteoporosis as a T-score of ≤ -2.5 standard deviations (SD). Osteopenia is characterized by a T-score ranging from -1 SD to -2.4 SD, while a normal bone density is indicated by a T-score of > -1 SD
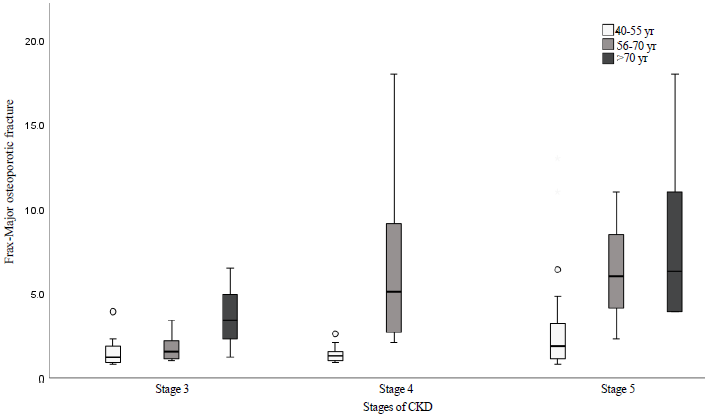
- Clustered Boxplot of FRAX-Score for Major Osteoporotic Fracture by Stage of CKD by Age. CKD stage and age significantly impact major osteoporotic fracture risk .
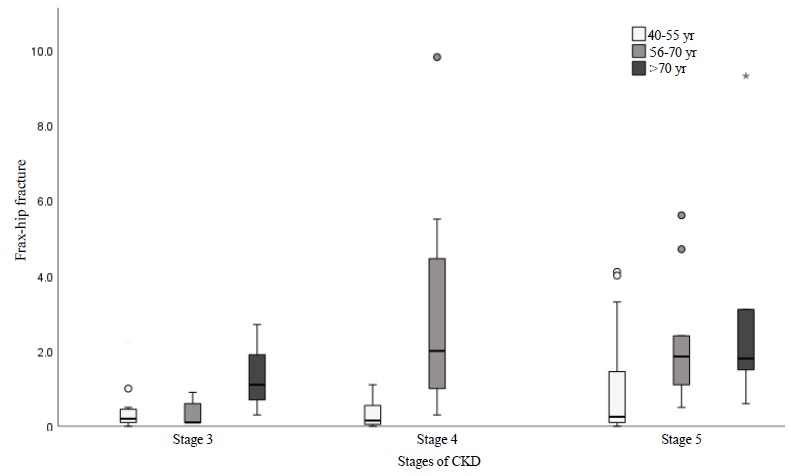
- Clustered Boxplot of FRAX-Score for Hip Osteoporotic Fracture risk by stage of CKD by Age. It highlights the impact of CKD and age with different stages and age groups. Both CKD stage and age had significant impacts on Hip osteoporotic fracture risk, especially when comparing stages III and V and age groups 40-55 and >70 yr.
Discussion
While diabetes, hypothyroidism, and chronic liver disease are recorded as secondary causes of osteoporosis, it is interesting to note that CKD has not been incorporated in the same, despite studies showing a higher risk of fragility fractures. The original FRAX score development dataset included some patients with reduced eGFR, but the number was not significant enough to incorporate CKD as an isolated factor for osteoporosis17-19. The present study demonstrates that advanced age significantly increases FRAX-scores for major osteoporotic and hip fractures. The association of fractures with age in CKD and the non-CKD population is well established17,18. This finding is in line with the study done by Li et al20, where the risk of osteoporotic fracture increased in elderly patients. Our findings align with previous studies highlighting age as a critical factor in fracture risk. A study done by Zhang et al21 found that patients aged >70 yr had significantly higher fracture risks compared to younger non-CKD patients, which is consistent with our finding of higher major osteoporotic and hip fracture risks in older age groups. A similar study done by Drake et al22 showed that increased age increases the risk of fracture.
Data on socioeconomic factors affecting the FRAX score and fracture risk within the general population is available but absent in CKD patients. The findings of this study revealed that major osteoporotic fracture and hip fracture risks are higher in the urban population than in the rural population, similarly, to the findings of Matsuzaki et al23. In a systematic review comparing BMD among urban and rural residents, it was noted that BMD was five per cent lower in the urban population in high-income countries; results from low and middle-income countries did not show a significant difference in the pooled analysis. However, there are other studies which have shown urban population has less osteoporosis than rural24,25. However, the present study is in contrast with the findings by Zheng et al25, which revealed that the prevalence of osteoporosis is higher in rural (10.33%) populations as compared to urban (5.52%). In addition, a systematic review26 analysed the relationship between the risk of osteoporotic fractures and socioeconomic factors - income, education, occupation, area of residence, and marital status. It was observed that there was a strong level of evidence for being married, a low level of evidence for being employed and having a larger house size, and no significant evidence for the level of income or educational qualification for a lower risk of fractures26. In the present study, the type of occupation had an impact on the FRAX-Score, which needs further study to confirm this finding.
In this study using the Indian FRAX calculator, the average probability of major osteoporotic fractures in stage V was significantly higher (P=0.018) compared to stages IV and III. Post hoc testing further indicated a significant difference in the risk of major osteoporotic fractures between CKD stage IV and stage V (P=0.017), as well as between stage III and stage V (P=0.010). Additionally, the average probability of hip fractures was significant between stages III and V (P=0.038) in CKD patients. Our findings align with those of Manda et al2, who reported an increase in the 10-year probability of major osteoporotic fractures in CKD stage IV (9.47±2.62%) compared to CKD stage III (1.92±0.8%) (P<0.0001). The results of our study suggest that patients in advanced stages of CKD (stages IV and V) have higher FRAX scores for major osteoporotic fractures compared to those in stage III (P=0.018). This is consistent with a study by Pimental et al2⁷, which found that fracture risk increases as kidney function declines, likely due to the mineral and bone disorders prevalent in advanced CKD.
In our study, 56.8 per cent of CKD participants had osteopenia, and 11.6 per cent had osteoporosis. Osteopenia can develop into osteoporosis if left untreated. The prevalence of osteopenia in our study is consistent with findings from Aggarwal et al28, who reported osteopenia and osteoporosis rates of 42 per cent and 8.5 per cent, respectively. Additionally, research by Akkupalli et al29 found that among CKD patients, the prevalence of osteopenia and osteoporosis was both 33.3 per cent each, respectively. Jha et al30 also noted that the prevalence of osteopenia and osteoporosis in CKD patients was 37 per cent and 12 per cent, respectively. Likewise, Govindarajan et al31 reported a prevalence of 23.2 per cent for osteopenia and 8.3 per cent for osteoporosis among CKD patients. Our findings align with those of other earlier research in the Indian CKD population.
The present study did suffer from certain limitations. The study’s cross-sectional nature did not allow estimates of the fracture incidence to be calculated, and the FRAX score was used as a corollary for the same. Additionally, our study was done in an Indian population, limiting generalisability to the entire CKD population. While the FRAX score considers a good number of variables, including BMD at the femoral neck, density only represents the strength of the bone. Other parameters, such as bone quality and turnover, as measured by the trabecular bone score, bone biopsy, and biomarkers, also impact the risk of fractures and were omitted. Newer iterations of the FRAX score, which include the TBS, have also come up but require further validation.
Overall, this study not only validated the use of the FRAX score in the Indian CKD population but also demonstrated the effect of decreasing eGFR on the risk of fragility fractures. Importantly, it also fills the gap in terms of the role that socioeconomic and environmental factors play in the development of fragility fractures. Disparities in terms of area of residence, occupation, and education status are a stark reality in middle-and low-income countries like ours and warrant inclusion into a FRAX score specific to the Indian population. Moreover, long-term follow up studies are needed to establish the connection between CKD and fracture rates.
Acknowledgment
The authors would like to express their gratitude to all the participants for their cooperation during the study.
Financial support & sponsorship
None.
Conflicts of Interest
None.
Use of Artificial Intelligence (AI)-Assisted Technology for manuscript preparation
The authors confirm that there was no use of AI-assisted technology for assisting in the writing of the manuscript and no images were manipulated using AI.
References
- Demographic profile, spectrum, awareness, and cost of renal replacement therapy of chronic kidney disease patients in a public tertiary care center in Rajasthan, India. Indian J Med Sci. 2024;76:99-104.
- [CrossRef] [Google Scholar]
- A study on WHO frax score to predict fracture risk in predialysis patients of chronic kidney disease. Int J Res Med Sci. 2020;8:2978.
- [CrossRef] [Google Scholar]
- Fracture risk assessment in chronic kidney disease, prospective testing under real world environments (FRACTURE): A prospective study. BMC Nephrol. 2010;11:17.
- [CrossRef] [PubMed] [Google Scholar]
- Relationship between biochemical parameters of mineral bone disease and static bone histomorphometry in chronic kidney disease patients on hemodialysis: An Indian cross-section study. Nefrologia (Engl Ed). 2023;43:67-76.
- [CrossRef] [PubMed] [Google Scholar]
- Mineral and bone disorders, morbidity and mortality in end stage renal disease. Clujul Med. 2016;89:94-103.
- [CrossRef] [PubMed] [PubMed Central] [Google Scholar]
- Chronic kidney disease in India: Challenges and solutions. Nephron Clin Pract. 2009;111:c197-203.
- [CrossRef] [PubMed] [Google Scholar]
- What do we know about chronic kidney disease in India: First report of the Indian CKD registry. BMC Nephrol. 2012;13:10.
- [CrossRef] [PubMed] [PubMed Central] [Google Scholar]
- Textbook of Nephrology (4th ed). Baltimore: London Williams and Wilkins; 1984.
- Renal function and risk of hip and vertebral fractures in older women. Arch Intern Med. 2007;167:133-9.
- [CrossRef] [PubMed] [Google Scholar]
- From fracture risk prediction to evaluating fracture patterns: Recent advances in the epidemiology of osteoporosis. Curr Rheumatol Rep. 2012;14:205-11.
- [CrossRef] [PubMed] [Google Scholar]
- A study to predict fracture risk using bone mineral density and FRAX score in patients on chronic maintenance haemodialysis. J Family Med Prim Care. 2022;11:170-5.
- [CrossRef] [PubMed] [PubMed Central] [Google Scholar]
- Increased risk of hip fracture among patients with end-stage renal disease. Kidney Int. 2000;58:396-9.
- [CrossRef] [PubMed] [Google Scholar]
- Impaired muscle strength is associated with fractures in hemodialysis patients. Osteoporos Int. 2006;17:1390-7.
- [CrossRef] [PubMed] [Google Scholar]
- Age and sex are sufficient for predicting fractures occurring within 1 year of hemodialysis treatment. Bone. 2007;40:516-21.
- [CrossRef] [PubMed] [Google Scholar]
- Epidemiology and risk factors of chronic kidney disease in India - results from the SEEK (Screening and early evaluation of kidney disease) study. BMC Nephrol. 2013;14:114.
- [CrossRef] [PubMed] [PubMed Central] [Google Scholar]
- FRAX plus. Available from: https://frax.shef.ac.uk/FRAX/index.aspx, accessed on May 16, 2024.
- The burden of osteoporotic fractures: a method for setting intervention thresholds. Osteoporos Int. 2001;12:417-27.
- [CrossRef] [PubMed] [Google Scholar]
- FRAX and the assessment of fracture probability in men and women from the UK. Osteoporos Int. 2008;19:385-97.
- [CrossRef] [PubMed] [PubMed Central] [Google Scholar]
- Risk factors of osteoporosis in elderly inpatients: A cross-sectional single-centre study. Front Aging. 2023;4:1126172.
- [CrossRef] [PubMed] [PubMed Central] [Google Scholar]
- Urban-rural differences in patterns and associated factors of multimorbidity among older adults in China: A cross-sectional study based on apriori algorithm and multinomial logistic regression. Front. Public Health. 2021;9:707062.
- [CrossRef] [PubMed] [PubMed Central] [Google Scholar]
- Risk factors for low bone mass-related fractures in men: A systematic review and meta-analysis. J Clin Endocrinol Metab. 2012;97:1861-70.
- [CrossRef] [PubMed] [Google Scholar]
- Comparison of bone mineral density between urban and rural areas: Systematic review and meta-analysis. PLoS One. 2015;10:e0132239.
- [CrossRef] [PubMed] [PubMed Central] [Google Scholar]
- Urban-rural difference in outcome and management of vertebral fracture: A real world observation study. J Formos Med. 2023;122:690-98.
- [Google Scholar]
- Differences in the prevalence and risk factors of osteoporosis in Chinese urban and rural regions: a cross-sectional study. BMC Musculoskelet Disord. 2023;24:46.
- [CrossRef] [PubMed] [PubMed Central] [Google Scholar]
- The association between socioeconomic status and osteoporotic fracture in population-based adults: A systematic review. Osteoporos Int. 2009;20:1487-9.
- [CrossRef] [PubMed] [Google Scholar]
- Fractures in patients with CKD – diagnosis, treatment, and prevention: a review by members of the European Calcified Tissue Society and the European Renal Association of Nephrology Dialysis and Transplantation. Kidney Int. 2017;92:1343-55.
- [CrossRef] [PubMed] [Google Scholar]
- Prevalence of chronic renal failure in adults in Delhi, India. Nephrol Dial Transplant. 2005;20:1638-42.
- [CrossRef] [PubMed] [Google Scholar]
- Bone mineral density in chronic kidney disease patients. Int J Biol Med Res. 2013;4:2870-4.
- [Google Scholar]
- Noninvasive assessment of bone health in Indian patients with chronic kidney disease. Indian J Nephrol. 2013;23:161-7.
- [CrossRef] [PubMed] [PubMed Central] [Google Scholar]
- Bone mineral density in patients with end‐stage renal disease and its evolution after kidney transplantation. Indian J Nephrol. 2011;21:85‐9.
- [CrossRef] [PubMed] [Google Scholar]


