
Translate this page into:
Findings from the 2017 HIV estimation round & trend analysis of key indicators 2010-2017: Evidence for prioritising HIV/AIDS programme in India
For correspondence: Dr M. Vishnu Vardhana Rao, Director, ICMR-National Institute of Medical Statistics, Ansari Nagar, New Delhi 110 029, India e-mail: nims-director@icmr.gov.in
-
Received: ,
This is an open access journal, and articles are distributed under the terms of the Creative Commons Attribution-NonCommercial-ShareAlike 4.0 License, which allows others to remix, tweak, and build upon the work non-commercially, as long as appropriate credit is given and the new creations are licensed under the identical terms.
This article was originally published by Wolters Kluwer - Medknow and was migrated to Scientific Scholar after the change of Publisher.
Abstract
Background & objectives:
The National AIDS Control Organisation (NACO) and the ICMR-National Institute of Medical Statistics, the nodal agency for conducting HIV estimations in India, have been generating HIV estimates regularly since 2003. The objective of this study was to describe India's biennial HIV estimation 2017 process, data inputs, tool, methodology and epidemiological assumptions used to generate the HIV estimates and trends of key indicators for 2010-2017 at national and State/Union Territory levels.
Methods:
Demographic Projection (DemProj) and AIDS Impact Modules (AIM) of Spectrum 5.63 software recommended by the United Nations Programme on HIV and AIDS Global Reference Group on HIV Estimates, Modelling and Projections, were used for generating HIV estimations on key indicators. HIV sentinel surveillance, epidemiological and programme data were entered into Estimation Projection Package (EPP), and curve fitting was done using EPP classic model. Finally, calibration was done using the State HIV prevalence of two rounds of National Family Health Survey (NFHS) -3 and -4 and Integrated Biological and Behavioural Surveillance (IBBS), 2014-2015.
Results:
The national adult prevalence of HIV was estimated to be 0.22 per cent in 2017. Mizoram, Manipur and Nagaland had the highest prevalence over one per cent. An estimated 2.1 million people were living with HIV in 2017, with Maharashtra estimated to have the highest number. Of the 88 thousand annual new HIV infections estimated nationally in 2017, Telangana accounted for the largest share. HIV incidence was found to be higher among key population groups, especially people who inject drugs. The annual AIDS-related deaths were estimated to be 69 thousand nationally. For all indicators, geographic variation in levels and trends between States existed.
Interpretation & conclusions:
With a slow decline in annual new HIV infections by only 27 per cent from 2010 to 2017 against the national target of 75 per cent by 2020, the national target to end AIDS by 2030 may be missed; although at the sub-national level some States have made better progress to reduce new HIV infection. It calls for reinforcement of HIV prevention, diagnosis and treatment efforts by geographical regions and population groups.
Keywords
AIDS impact module
AIDS related deaths
antiretroviral therapy
HIV estimates
HIV prevalence
PLHIV

The National AIDS Control Organisation (NACO), Ministry of Health and Family Welfare, and the ICMR-National Institute of Medical Statistics (ICMR-NIMS), the nodal agency for conducting HIV estimations in India, have been providing critical data on the HIV epidemic regularly since 2003. These data help to inform the strong public health response to HIV in India and have remained a key source for planning and the decision-making processes of India's National AIDS Control Programme (NACP)1. HIV estimates in India are generated using tools and methods recommended by the United Nations Programme on HIV and AIDS (UNAIDS) Global Reference Group on HIV Estimates, Modelling and Projections2. However, the assumptions and parameters for modelling are specifically anchored using country data, with the most current data used as inputs. The HIV Sentinel Surveillance (HSS) was launched in 1998 at 180 sites and over time expanded to 1800 sites by 2017 under various sequential phases of the NACP for geographical and population representativeness345.
The indigenous spreadsheet method3 was utilized from 1998 to 2005 and from 2006, the UNAIDS/WHO-recommended Workbook and Spectrum software-based method2 was adopted. In 2006, the first change included a refinement in assumptions used in spreadsheet method and a decision to stop using HIV prevalence data from sexually transmitted diseases sites and use only HSS data from key population-specific sites to address the potential issue of double counting. Second, HIV prevalence data from the large-scale community-based population survey National Family Health Survey 3 (NFHS-3)6 were used to calibrate the overall epidemic curve. As a result, the quality of estimates improved in 2006, and numbers were revised as compared to the 2005 results7.
The UNAIDS/WHO Workbook and Spectrum software2 were adopted and used for 2006 and 2007 estimations. From 2008 onwards, the UNAIDS Global Reference Group on HIV Estimations, Projections and Modelling-recommended method of using the Estimation and Projection Package (EPP) and Spectrum software were adopted for global comparability89. For each round of estimations, newer updated versions of Spectrum based on recent data and assumptions were used.
The Spectrum software includes various modules, of which the DemProj for demographic projections and AIDS Impact Module (AIM)10 for estimating the impact of the epidemic were used. Wherever Indian data were not available, the global default parameters in the model, which were up-to-date by global scientific studies, were retained. The demographic projection under DemProj module of spectrum was made India State specific using input parameters such as fertility, mortality and migration1112.
This study was carried out to describe India's biennial HIV estimation 2017 process and highlights the data inputs, tool, methodology and epidemiological assumptions which have been used to generate the HIV estimates for key indicators at national and State/Union Territory (UT) levels.
Material & Methods
Spectrum software version 5.63 by Avenir Health (Glastonbury, USA)101314, the tool recommended by the Joint UNAIDS worldwide, was used by the National Working Group (NWG) for HIV estimations in the 2017 HIV estimations round. This version of Spectrum had improved modelling assumptions as informed by the latest global scientific evidences on the probability of mortality among adults when on antiretroviral therapy (ART), preventive impact of ART, fertility pattern among HIV-positive pregnant women and mother-to-child transmission rate15. The process and steps for generating the HIV estimates by the NWG were as given below:
The first step in the process was to input demographic data into the DemProj module of Spectrum for each of the 35 States/UTs in India including for the State of Telangana which was bifurcated from Andhra Pradesh in 201416. For demographic projections, Census data17, Sample Registration System (SRS)18 and NFHS619 data i.e., size of total population by age and sex, total fertility rate, age-specific distribution of fertility, sex ratio at birth, life expectancy at birth by sex, model life table and migration by age and sex were projected for each year in 1981-2026 period using component method of projection20. A number of demographic direct and indirect calculation methods such as smoothing technique, the Gompertz Model, the Reverse Survival method and indirect Residual Method were used for the estimation and projection of the above-mentioned input parameters21222324252627.
In the next step, in the AIM module of Spectrum, treatment eligibility criteria for adults and children were updated. These affect the survival and mortality of people living with HIV (PLHIV), and hence influence the disease burden11. Prior to 2017, treatment eligibility was determined by a specific CD4 count threshold11. From 2017, all adults and children tested HIV positive were eligible for treatment under the ‘Treat All Policy’ regardless of CD4 count28.
The third step was to input programme data on pregnant women receiving PMTCT (Prevention of mother-to-child transmission) services (provided by NACO) by various regimens: single-dose nevirapine, Option A, B and B+. Programme data from the start year of treatment provision up to the most recent year 2017 were included. Data on adult males and females and children alive and on ART were also added from 2004 to 2017. For the projection period 2018 to 2026, for PMTCT and adult and child ART, a linear scale-up in coverage assumed at around five per cent annually reaching a threshold of 90 per cent overall coverage was assumed by the NWG and entered into the model.
In the next step, the model required assumptions pertaining to adult and child HIV transmission parameters. These assumptions were informed by global scientific studies in the absence of national data1129. In the fifth step, inputs were made to the EPP by East-West Center (Hawaii, USA) inbuilt with Spectrum30. Herein, the epidemic characteristic was defined as ‘concentrated’ for all States/UTs. The epidemic was configured to include subpopulations for each of the State/UT and the risk behaviour associated with each population defined so that Spectrum could link these two aspects considering whether it was an urban or rural epidemic or both. NACO's mapping and key population size estimation data were entered accordingly in the epidemic configuration. The per cent of the key population groups estimated to be male was specified, and turnover for injecting drug users (IDU) and female sex workers (FSW) was defined considering national data from 2009 behavioural surveillance survey (BSS)1112. After this, HIV prevalence data from HSS were added from the year when surveillance was started, up to the most recent 2017 round, for each subpopulation group.
The next step was curve fitting using the EPP Classic model31. EPP Classic model is governed by four parameters; (i) r, the rate of infection, assumed constant; (ii) t0, the start year of the epidemic; (iii) f0, the initial fraction of the adult population at risk of infection; and (iv) φ, which specifies the behavioural response of the population to the epidemic modulating the split between at-risk and not-at-risk populations. Curve fitting was done for each State/UT to calculate the adult HIV prevalence and associated HIV incidence31. The EPP classic model uses the time series data available from surveillance system for various subpopulations to generate prevalence projection and then calculates the associated incidence. The method has been detailed elsewhere31 The HSS network and system has been expanded over the years with active engagement of regional institutes. While the overall quality and geographic and population representativeness of this information is also improved, it does have a few biases. Antenatal care (ANC) and key population sites were higher in the erstwhile high HIV-prevalence States of Andhra Pradesh, Karnataka, Maharashtra, Tamil Nadu and Telangana, while these were scaled up in other States. ANC surveillance sites were primarily located only in public sector with relatively more sites at secondary-level facilities. The surveillance sites in the high-risk population are predominantly from urban locations with less data available for rural areas. These known biases were addressed in two ways in the 2017 estimations rounds. First, for the general population, the two rounds of NFHS data619 were used to inform the general population epidemic curve with a representative prevalence data set. For the high-risk population group, the findings from the national integrated bio-behavioural surveillance survey32 provided calibration factor for the epidemic trend for the population.
There were several options available in the Spectrum under the ‘calibration page’ to calibrate the adult HIV prevalence in EPP. For key populations, HIV prevalence curves were adjusted to fit 2015 values to HIV prevalence recorded in the Integrated Biological and Behavioural Surveillance (IBBS), a method introduced under the 2015 estimations round7. For the general population, both NFHS-36 and NFHS-419 HIV prevalence data were included as survey data points. Curve fitting was obtained by an appropriate balance of the two survey data points and HSS data. Thus, the modelling results for the general population were used without further calibration except for the States of Bihar, Chhattisgarh, Gujarat, Himachal Pradesh and Kerala. For these States, excluding Kerala, the ‘best curve fit’ for the general population was adjusted to the results of the last survey (i.e., NFHS-4).
In the final step, under the ‘sex/age pattern tab’ of Spectrum, the sex ratio and incidence rate ratios were updated considering survey data11. Following these steps and approaches, separate models were developed for each State/UT and then combined into the national model to produce national HIV estimates on key indicators.
Limitation of data: The AIDS impact model of Spectrum used for generation of estimation had several assumptions, for example, probabilities of HIV-related mortality among adults and children on ART/not on ART by CD4 count and gender and age-specific fertility rate among PLHIV versus HIV-negative population. These assumptions were based on evidence generated from research studies conducted in various countries, primarily Africa210, and not specific to the Indian population. There is a provision in Spectrum to make these assumptions more India specific if there are national-level data. The estimates may be affected by the quality of surveillance and programme data entered into Spectrum. To address the biases of the surveillance system in terms of geographic representativeness, the general population curve was calibrated using NFHS data while the key population curve was calibrated by IBBS data during the curve fitting step of the HIV estimates modelling. There might be varying estimates uncertainty. Though the uncertainty bounds addressed some of this variance, it might be worth mentioning that the programme coverage was based on the monthly summary report from the facilities and might have a small proportion of duplicate entries of the beneficiaries. The size of the key population or the high-risk group population is an indispensable information for the concentrated epidemics. The last mapping and key population size estimation exercise was conducted during 2008-2009. To determine paediatric HIV prevalence among concentrated epidemic was another critical issue and a challenge because of the difficulty to ascertain fertility among key population living with HIV at the national level and hence, global defaults available in different countries were used. Besides, assumptions pertaining to AIDS mortality in the children not receiving ART were not strong and updated due to the lack of the evidence33.
Despite the limitations, the 2017 HIV estimates provide the most robust, critical and latest evidence on epidemic patterns at national and State/UT level by key indicators in India at this time. It provides evidence which can be used by the NACP for focusing programme interventions further to achieve national targets.
Results
The key findings for adult HIV prevalence, PLHIV numbers, annual new HIV infections, HIV incidence, AIDS-related deaths and PMTCT need nationally and at State/UT level are presented. The estimated adult (15-49 yr) HIV prevalence of 0.22 per cent (0.16-0.30) was the lowest till now at the national level compared to 0.49 per cent in 1999 to 0.36 per cent (0.29-0.46) in 2006 and 0.26 per cent (0.22-0.32) in 201511. This trend suggesting an overall decline in the level of the epidemic was in conformity with HIV prevalence reported from the large-scale community-based survey results of NFHS-3 and NFHS-4 (Fig. 1). The adult HIV prevalence among males was estimated to be 0.25 (0.18-0.34) per cent in 2017, while among females, it was 0.19 (0.14-0.25) per cent. During the peak year of 1999, the estimated prevalence was 0.59 per cent among males and 0.39 per cent among females (Fig. 1).
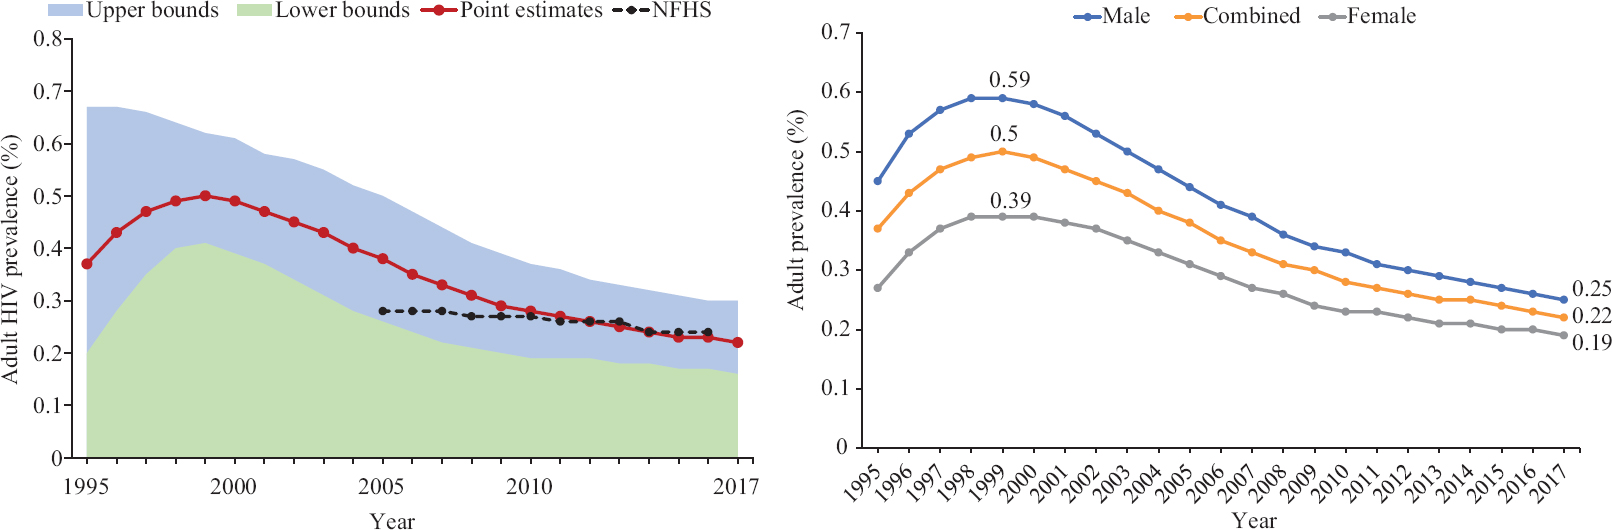
- Estimated adult HIV prevalence (%), India, 1995-2017. Source: Ref. 11.
At State level, adult HIV prevalence was estimated to be rising in recent years in some States such as Mizoram, Bihar, Jharkhand, Odisha, Punjab, Haryana and Delhi. In the southern region, all the major States showed a declining trend. In other regions of India, the State level trends were mixed11.
There were nine States with adult HIV prevalence above the national level. Mizoram, Manipur and Nagaland were the three States with the highest adult HIV prevalence in India at 2.04, 1.43 and 1.15 per cent in 2017, respectively. In Telangana, Andhra Pradesh, Karnataka, Goa, Maharashtra and Delhi, these were estimated at 0.70, 0.63, 0.47, 0.42, 0.33 and 0.30 per cent, respectively, in 201711. The number of PLHIV was stabilized since 2004. There were 2.14 (1.59-2.83) million PLHIV estimated in India in 2017, which was around one per cent more than the total number of PLHIV in 2015 (Fig. 2). The average annual rate of increase in the number of PLHIV has declined over time. Ninety seven per cent of the total PLHIV belonged to the age group of more than 15 yr. Females constituted 42 per cent of the total estimated PLHIV in the 15 yr plus age group11. Children accounted for three per cent of the total PLHIV [0.61 thousand (0.43-0.85)]11.

- Estimated number of people living with HIV, India, 1995-2017. Source: Ref. 11.
The top three States having the highest number of PLHIV in 2017 were Maharashtra (0.33 million), Andhra Pradesh (0.27 million) and Karnataka (0.24 million). States with estimated PLHIV numbers between 0.2 and 0.1 million were Telangana, West Bengal, Tamil Nadu, Uttar Pradesh and Bihar (Fig. 3)11. Regarding the annual new HIV infections, the programme target was to reduce it by 75 per cent from 2010 to 2020. Annual new HIV infections were estimated at 87.6 thousand (36.4-172.9) in 2017 compared with 119.7 thousand (64.6-196.8) in 2010, indicating a 27 per cent. This indicated slow progress on prevention goals. Adults (15+ yr) constituted 96 per cent of the total annual new HIV infections and females (15+ yr) constituted 40 per cent of adult annual new HIV infections11.
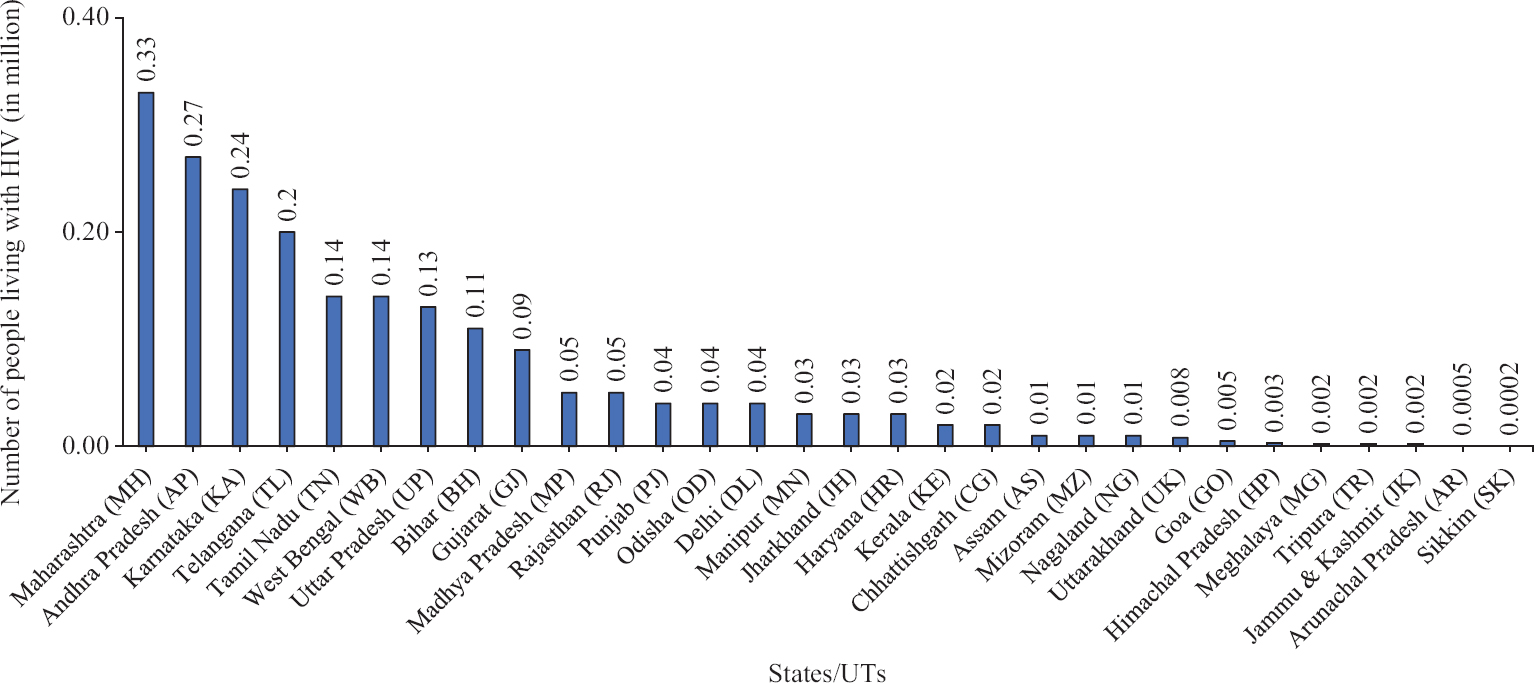
- Estimated number of people living with HIV, States/Union Territories, 2017. Source: Ref. 11.
At the State level, there was a variation in trend for this indicator. States of Arunachal Pradesh, Assam, Mizoram, Meghalaya and Uttarakhand showed an increasing number of annual new HIV infections in 2017 compared to 2010. In the remaining States, the trend was estimated to be declining at varying levels. The top three States with the largest number of estimated annual new HIV infections were Telangana, Bihar and West Bengal. Telangana accounted for 11 per cent of the total annual new HIV infections among adults in 2017 at 9324 (4860-14,768). Bihar and West Bengal accounted for 10 per cent each of the total.
The 2017 HIV estimates showed the highest incidence rate among the key population group of IDU compared with men who have sex with men (MSM) and FSW. In addition, incidence is much higher among key population groups compared with the general population11.
At the national level, annual AIDS-related deaths among PLHIV continuously increased till 2005, following which there was a steady decline with the advent of ART treatment. Annual AIDS-related deaths declined by 71 per cent after the peak of 2005. From 2010 to 2017, the decline was 55 per cent (Fig. 4). At the national level, the estimated annual AIDS-related death among PLHIV was 69.11 thousand (29.94-140.84), with adults (15+ yr) constituting 96 per cent and adult females constituting 31 per cent of the total.
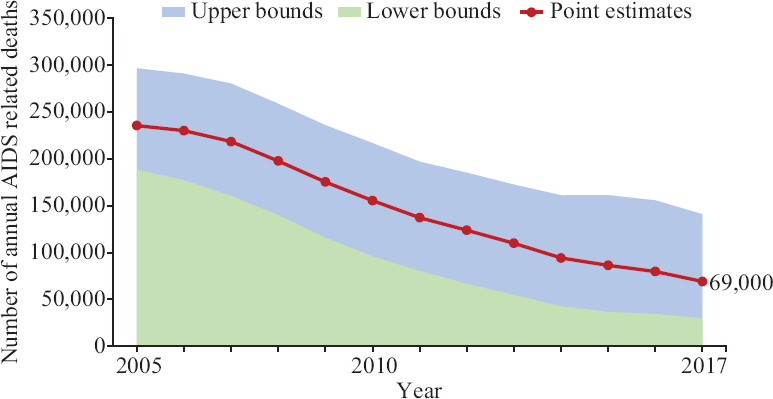
- Estimated annual AIDS-related deaths, 2005-2017, India. Source: Ref. 11.
Akin to the national trend, the number of annual AIDS-related deaths dropped in most States/UTs during 2005-2010. AIDS-related deaths declined from 2007, most sharply in the erstwhile high-prevalence States of Andhra Pradesh, Karnataka, Maharashtra, Tamil Nadu and Telangana in the southern and western regions of the country. In Bihar, Jharkhand and Haryana, there was a rising trend, while in Assam, the annual AIDS-related deaths were estimated to have remained stable. The top three States with the highest number of estimated annual AIDS-related deaths were Telangana, Maharashtra and Andhra Pradesh11. Latest estimates from 2017 suggested that 22,677 (10,927-40,605) HIV-positive women in India who gave birth in 2017, were in need of ART to prevent HIV transmission to their infants (Fig. 5). At the State level, PMTCT need was highest in Maharashtra (2406), followed by Uttar Pradesh (2286), Bihar (2090), Andhra Pradesh (1960), Karnataka (1951), Telangana (1737), West Bengal (1453), Gujarat (1297), Tamil Nadu (1167) and Rajasthan (959) (Fig. 3)11.
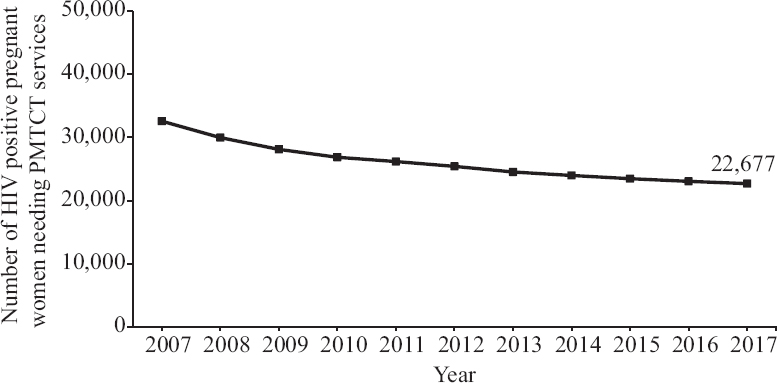
- Prevention of mother-to-child transmission (PMTCT) need estimates, 2007-2017. Source: Ref. 11.
Discussion
The 2017 estimates confirmed that overall, the HIV epidemic declined in India11. The HIV prevention and treatment programme under the various phases of NACP was successful. This was especially considering the following two key impact indicators: annual new infections which declined by 85 per cent from its peak year 1995 to 2017 and annual AIDS-related deaths which declined by 60-70 per cent over the last decade from 2007 when the NACP-3 programme was launched with a particular focus on treatment scale-up as its strategy with HIV prevention11.
The 2017 estimates also indicated a slowdown in the rate of decline in the epidemic in recent years. Annual new HIV infections declined by 27 per cent in India from 2010 to 2017 against the national target of 75 per cent decline from 2010 to 2020. The annual AIDS-related deaths declined by 55 per cent from 2010 to 201711. With a slow decline in annual new HIV infections, India may miss the national target to end AIDS by 2030 although some States have achieved a rate of decline greater than the national average. While this decline in new HIV infections was better than the global average of 18 per cent, the slowdown in the reduction of new infections indicated that the traditional prevention approaches showed diminishing returns under the NACP. New infections in the north-eastern States were either increasing or showed less progress than the national averages. The States of Bihar, West Bengal and Telangana, the three major contributors in new infections, showed less decline than the national average. Exploring mechanisms to enhance coverage to a broader population group in these locations with a basket of combination prevention services may accelerate the progress of prevention of new infections.
HIV estimates for key indicators pointed towards the geographic areas (States) where the burden of PLHIV, annual new HIV infections, annual AIDS-related deaths and PMTCT needs were greater compared to those States where HIV prevention, diagnosis, treatment and care programmes could be reinforced. There were 15 States which accounted for 87 per cent of the total population of India in 201711. These accounted for 90 per cent of the total burden of PLHIV in India, around 86 per cent of the total annual new HIV infections, 91 per cent of annual AIDS-related deaths and 89 per cent of the total PMTCT needs. These States were Andhra Pradesh, Bihar, Delhi, Gujarat, Haryana, Jharkhand, Karnataka, Madhya Pradesh, Maharashtra, Odisha, Rajasthan, Tamil Nadu, Telangana, Uttar Pradesh and West Bengal. It is important to reiterate that while focus may be further reinforced in these geographic areas as a priority, it is not to suggest that other States are neglected and efforts there must also continue.
An analysis of interstate-level variation in the levels and trends for number of PLHIV showed that the epidemic was no longer solely concentrated in the southern States as was the case in early epidemic years and as indicated in earlier estimations rounds34 but now has substantially proliferated in the western, northern and eastern parts of the country. While the four States of Maharashtra, Andhra Pradesh, Karnataka and Telangana together accounted for 50 per cent of the total burden of PLHIV, the States of West Bengal, Tamil Nadu, Uttar Pradesh, Bihar, Gujarat, Rajasthan, Madhya Pradesh, Delhi, Odisha and Haryana in the western, central and eastern regions accounted for the 40 per cent of the total PLHIV estimates11.
Regarding annual new HIV infections, States accounting for the highest number were Bihar, West Bengal and Uttar Pradesh in the central and western parts of the country. Together with the southern States of Telangana and Andhra Pradesh, these five States accounted for about 46 per cent of the total annual new HIV infections in the country. HIV prevention, diagnosis and treatment and care services are critical in these States. These series are also critical in other States which showed increasing trend for the annual new HIV infections. There was indication of rising annual new HIV infections in the low burden States of Arunachal Pradesh, Assam, Mizoram, Meghalaya and Uttarakhand in 2017 compared with 2010. In contrast, the annual new HIV infections declined in the high-burden States. These comparative analyses of key indicators for the States indicated the type of intervention (prevention/diagnosis/treatment and care), which would be beneficial to further control the epidemic and reach the target 3.3 of the Sustainable Development Goals (SDGs)35. This pattern of the epidemic was observed under previous estimations rounds also34. The UNAIDS has advocated achievement of 90-90-90 (i.e., 90% of HIV-infected people know their HIV status, 90% of HIV-infected people who know their HIV status are on ART and 90% of HIV-infected people who are on ART are virally suppressed) by 202036, which will help pave the way towards a world where AIDS is no longer a public health threat (Sustainable Development Goal target 3.3, 203035). In India, of the total estimated PLHIV, 79 per cent know their HIV status and 65 per cent are on ART37.
Elimination of mother-to-child transmission of HIV is another critical target to be achieved by 20201. Of the 22,677 estimated PMTCT need in India, 58.2 per cent were on treatment as of December 201831. States of Bihar, Jharkhand, Uttar Pradesh and Telangana had relatively higher PMTCT need, however, treatment coverage was still significantly lower than the national average and thus required specific attention.
In conclusion, the 2017 HIV estimates pointed towards geographic areas and populations where HIV burden was higher. To achieve the national target of decline in annual new HIV infections and AIDS-related deaths by 2020, ongoing HIV prevention, testing and treatment services should be fast-tracked in the 15 States, mentioned earlier accounting for bulk of the epidemic. At the same time, AIDS response efforts in other States and UTs must sustain.
Financial support & sponsorship: None.
Conflicts of Interest: None.
References
- National strategic plan for HIV/AIDS and STI 2017-2024. New Delhi: NACO, Ministry of Health & Family Welfare, Government of India; 2017.
- UNAIDS Reference Group on Estimates, Modelling and Projections. Available from: http://www.epidem.org
- Process of estimating the number of people living with HIV in India. Indian J Public Health. 2007;51:7-13.
- [Google Scholar]
- Increasing HIV prevalence in STD clinic attendees in Delhi, India: 6 year (1995-2000) hospital based study results. Sex Transm Infect. 2001;77:393.
- [Google Scholar]
- To halt and reverse the HIV pandemic in India 2006
- National Family Health Survey (NFHS-3), 2005-06: India. Vol I. Mumbai: IIPS; 2007.
- Modelling and estimation of HIV prevalence and people living with HIV in India, 2010-11. Int J STD AIDS. 2016;27:1257-66.
- [Google Scholar]
- Estimate of HIV prevalence and number of people living with HIV in India 2008-2009. BMJ Open. 2012;2:e000926.
- [Google Scholar]
- Spectrum: AIM. Available from: https://wwwavenirhealthorg/software-spectrummodelsphp#aim
- HIV Estimations 2017: Technical Report 2018
- India HIV Estimations 2015: Technical Report 2015
- The 2005 Workbook: An improved tool for estimating HIV prevalence in countries with low level and concentrated epidemics. Sex Transm Infect. 2006;82(Suppl 3):iii41-4.
- [Google Scholar]
- Projecting the demographic impact of AIDS and the number of people in need of treatment: Updates to the Spectrum projection package. Sex Transm Infect. 2006;82(Suppl 3):iii45-50.
- [Google Scholar]
- Updates to the Spectrum/AIM model for estimating key HIV indicators at national and subnational levels. AIDS. 2019;33(Suppl 3):S227-34.
- [Google Scholar]
- The Andhra Pradesh Reorganisation (Amendment) Act, 2014. Available from: http://wwwegazettenicin/writereaddata/2014/160253pdf
- 2011 Census Data. New Delhi: Ministry of Home Affairs, Government of India; 2011. Available from: https://censusindiagovin/census_and_you/area_and_populationaspx
- 2017. Sample Registration System - Statistical Report 2017. New Delhi: Ministry of Home Affairs, Government of India; Available from: https://censusindiagovin/Vital_Statistics/SRS_Report_2017/SRS%20Statistical%20Report%202017pdf
- National Family Health Survey (NFHS-4), 2015-16: India 2017
- Overview of projection methods. Available from: https://wwwunorg/en/development/desa/population/events/pdf/other/14/2-ProjectionMethodspdf
- Population projection for India and States 2001-2026: Report of the technical group on population projections. New Delhi: National Commission on Population, Office of the Registrar General and Census Commissioner; 2006.
- Fertility estimation for Bangladesh using Gompertz model. Rural Demogr. 1983;10:19-22.
- [Google Scholar]
- Estimation of growth parameters using a nonlinear mixed Gompertz model. Poult Sci. 2004;83:847-52.
- [Google Scholar]
- Regional model life tables and stable populations (2nd ed). New York: Academic Press; 1983.
- Model life tables for developing countries. New York: United Nations; 1982.
- Manual X - Indirect techniques for demographic estimation Population Studies No 81, Department of International Economic and Social Affairs 1983
- The methods and materials of demography: Department of commerce. Vol 1. United States: Bureau of the Census; 1980.
- Implementation of the treat all policy among persons with HIV infection enrolled in care but not on antiretroviral therapy - India, May 2017-June 2018. Morb Mortal Wkly Rep. 2018;67:1305-9.
- [Google Scholar]
- Methods for deriving UNAIDS estimates. Available from: https://www.unaids.org/sites/default/files/media_asset/2016_methods-for-deriving-UNAIDS-estimates_en.pdf
- About Estimation and Projection Package, the East-West Center, Hawaii, USA. Available from: http://www EastWestCenterorg
- Updates to the Spectrum/Estimation and Projection Package (EPP) model to estimate HIV trends for adults and children. Sex Transm Infect. 2012;88(Suppl 2):i11-6.
- [Google Scholar]
- National Integrated Biological and Behavioural Surveillance (IBBS), 2014-15 2015
- HIV estimates through 2018: Data for decision-making. AIDS. 2019;33(Suppl 3):S203-11.
- [Google Scholar]
- Sustained progress, but no room for complacency: Results of 2015 HIV estimations in India. Indian J Med Res. 2017;146:83-96.
- [Google Scholar]
- Sustainable Development Goal 3: Targets & Indicators. Available from: https://sustainabledevelopment.un.org/SDG3
- 90-90-90 an ambitious treatment target to help end the aids epidemic. Available from: https://filesunaidsorg/en/media/unaids/contentassets/documents/unaidspublication /2014/90-90-90_enpdf
- India. Available from: https://wwwunaidsorg/en/regionscountries/countries/india


