
Translate this page into:
Exploratory analysis of the suitability of data from the civil registration system for estimating excess mortality due to COVID-19 in Faridabad district of India
For correspondence: Dr Anand Krishnan, Room No. 13, Centre for Community Medicine, Old OT Block, All India Institute of Medical Sciences, Ansari Nagar, New Delhi 110 029, India e-mail: anand.drk@gmail.com
-
Received: ,
This article was originally published by Wolters Kluwer - Medknow and was migrated to Scientific Scholar after the change of Publisher.
Abstract
Background & objectives:
Due to shortcomings in death registration and medical certification, the excess death approach is recommended for COVID-19 mortality burden estimation. In this study the data from the civil registration system (CRS) from one district in India was explored for its suitability in the estimation of excess deaths, both directly and indirectly attributable to COVID-19.
Methods:
All deaths registered on the CRS portal at the selected registrar’s office of Faridabad district in Haryana between January 2016 and September 2021 were included. The deaths registered in 2020 and 2021 were compared to previous years (2016-2019), and excess mortality in both years was estimated by gender and age groups as the difference between the registered deaths and historical average month wise during 2016-2019 using three approaches – mean and 95 per cent confidence interval, FORECAST.ETS function in Microsoft Excel and linear regression. To assess the completeness of registration in the district, 150 deaths were sampled from crematoria and graveyards during 2020 and checked for registration in the CRS portal. Agreement in the cause of death (CoD) in CRS with the International Classification of Diseases-10 codes assigned for a subset of 585 deaths after verbal autopsy was calculated.
Results:
A total of 7017 deaths were registered in 2020, whereas 6792 deaths were registered till 30 September 2021 which represent a 9 and 44 per cent increase, respectively, from the historical average for that period. The highest increase was seen in the age group >60 yr (19% in 2020 and 56% in 2021). All deaths identified in crematoria and graveyards in 2020 had been registered. Observed peaks of all-cause excess deaths corresponded temporally and in magnitude to infection surges in the district. All three approaches gave overlapping estimates of the ratio of excess mortality to reported COVID-19 deaths of 1.8-4 in 2020 and 10.9-13.9 in 2021. There was poor agreement (κ<0.4) between CoD in CRS and that assigned after physician review for most causes, except tuberculosis and injuries.
Interpretation & conclusions:
CRS data, despite the limitations, appeared to be appropriate for all-cause excess mortality estimation by age and sex but not by cause. There was an increase in death registration in 2020 and 2021 in the district.
Keywords
Cause of death
civil registration
COVID-19
excess mortality
India
verbal autopsy

An estimate of deaths caused by a pandemic is a good measure of its severity. Variations in testing policies and coverage and COVID-19 death definitions limit comparability of death tolls across geographies as do access to care and robustness of vital registration systems. India officially reported over 43 million cases and 516,543 COVID-19 deaths till March 20221. It was estimated that although 86 per cent of all deaths were registered, yet only 21.1 per cent of all registered deaths were medically certified2,3.
In countries with near-complete registration of deaths in normal times have also acknowledged that their officially recorded COVID-19 death tolls might be underestimates4,5. This has shifted the focus to indirect estimation procedures. One established approach is estimating excess mortality i.e., the number of deaths above that expected during normal times4,6. Excess mortality reflects both direct and indirect mortality due to COVID-19. Indirect deaths include cardiac or diabetic deaths occurring as a sequela of COVID-19 or those occurring due to a reduction in healthcare access during pandemic-related restrictions. Similar approaches have been used in the past for the estimation of deaths due to influenza pandemics7. The WHO advocates the use of rapid mortality surveillance approaches with a focus on excess mortality to inform decision-makers about the scale of the epidemic6.
All deaths in India whether at home or in hospital must be registered in the jurisdiction of occurrence by next of kin or hospitals under the civil registration system (CRS)2. Two evaluations of the different sources of data for the estimation of influenza mortality scored CRS high on sample size and representativeness while rating it low on cause of death (CoD) ascertainment and timely availability of data8,9.
In the present study, the suitability of the CRS was examined for estimation of excess mortality due to COVID-19 in two tehsils (Ballabgarh and Badkhal) in Faridabad district of Haryana, India. The parameters for suitability included completeness of death registration, the feasibility of estimating excess mortality from the dataset using different statistical approaches and the validity of lay reporting of CoD in the CRS data.
Material & Methods
The study was based on the secondary data analysis. The study protocol was approved by the Institutional Ethics Committee, All India Institute of Medical Sciences, New Delhi, India. Initial exploratory analysis was performed using available data from a concurrent study. Later, Municipal Commissioner, Faridabad, was approached formally who provided CRS (civil registration system) data for the estimation of excess deaths. The study was carried out between March to December 2021.
Study setting: Faridabad district of Haryana State lies in the National Capital Region with Delhi to its north and Uttar Pradesh to its east. The district has one functioning government medical college hospital and several tertiary care multi-speciality hospitals in the private sector10. The 2011 census recorded the population of the district as 1,809,733, with 79.5 per cent residing in urban areas with an estimated population in 2020 of 2.1 million11,12. In 2019, 11,141 deaths were registered in Faridabad district and the State of Haryana reported 100 per cent coverage of death registration2. The district reported over 45,000 cases and 400 COVID-19-related deaths in 2020 with a peak of active and confirmed cases being recorded on November 20, 202013. A serosurvey in October 2020 found that almost one-third of the population (31.2%) had been exposed to the virus14.
Data sources: A line list of all deaths between January 1, 2016 and September 30, 2021 registered until November 30, 2021 was obtained from the Registrar of Births and Deaths Offices in Ballabgarh and Badkhal tehsils of Faridabad district. To check for the level of completeness in the registration of deaths in 2020, a sample of 50 deaths each recorded in the registers of two large crematoria and one graveyard (total 150) in the local area were drawn through systematic random sampling and compared with death records obtained from CRS.
Data analysis: Data were analyzed using Microsoft Excel 2016 and STATA® release 15 (StataCorp LLC, College Station, Texas, USA). Three approaches were explored to estimate excess mortality by gender and age groups (0-14, 15-59 and ≥60 yr) in 2020 and 2021 against a baseline estimated from monthly deaths in the corresponding group during 2016-2019. The first approach compared monthly mortality in 2020 and 2021 (pandemic years) against the historical average, using standard error (SE) for the confidence intervals (CIs). In the second approach, expected monthly mortality for 2020 and 2021 was estimated using the FORECAST.ETS function with seasonality set to 1 (automatic calculation) in Microsoft Excel 2016. The function utilizes a triple exponential smoothing method based on historical data and using the square root of deaths as the CI15. The total (cumulative) number of excess (observed vs. baseline) all-cause deaths in both approaches was obtained by summing the excess all-cause deaths (with negative values set to 0) in each month. Weekly mortality was plotted by age and sex separately for the years 2020 and 2021 and compared with the range identified by the above two approaches. The third approach was a modification of the simple linear regression method elaborated by Gibertoni et al16, with the observed deaths as the dependent variable and an ordinal variable indicating year as the independent variable (coded 1-6 to represent years from 2016 to 2020-21). The constant and slope obtained for each month were used to estimate by extrapolation; the expected number of monthly deaths in 2020 and 2021, using the equation:
d (Expected Deaths)=a+(b×4)
where, x=5 corresponds to the year 2020-21.
Monthly excess mortality (observed minus expected) with negative values set to 0 was summed to arrive at cumulative all-cause excess mortality. Excess deaths were expressed as a range by taking the mean and 95 per cent upper bound of the CI for expected or predicted values.
Verbal autopsies (VA) were conducted by trained field workers using a validated instrument17 for a subset of 585 deaths in the age group of 30-69 yr which occurred in study tehsils as a part of an ongoing study to identify cardiac deaths. To assess the reliability of CoD from CRS, International Classification of Diseases-10 (ICD-10) codes for the underlying CoD based on the VA interview were assigned by the authors18. Appropriate ICD-10 codes were also assigned for the CoD recorded in the CRS portal for the same subset. Cohen’s κ was calculated to assess agreement between physicians assigned CoD and that recorded in CRS for major CoD categories. Cohen’s κ ≥0.4 was interpreted as a moderate level of agreement19.
Results
A total of 7017 all-cause deaths were registered in Ballabgarh and Badkhal tehsils between January 1, 2020 and December 31, 2020. This was 8.9 per cent higher than the mean annual deaths (6446±147; 95% CI) registered from 2016 to 2019. In 2021, 6792 all-cause deaths were recorded until September 30, representing a 43.8 per cent increase over the mean for the same period (4723±277) (Table I). There did not appear to be an increased delay in death registration as compared to previous years. All the 150 deaths identified from crematoria and a graveyard in the study area in 2020 were registered on the CRS portal. A significant increase (19% in 2020 and 56% in 2021) in deaths in the population >60 yr old was seen as compared to the average for 2016-2019, with no sex differences.
| Characteristics | 2016 (n=6626) | 2017 (n=6285) | 2018 (n=6502) | 2019 (n=6370) | 2016-2019, mean deaths (n=6446), n (%) | 2020 (n=7017), n (%) | 2021 (till 30 September) (n=6792), n (%) |
|---|---|---|---|---|---|---|---|
| Age (yr) | |||||||
| 0-14 | 452 | 277 | 277 | 213 | 305 (4.7) | 189 (2.7) | 125 (1.8) |
| 15-59 | 2721 | 2726 | 2667 | 2749 | 2716 (42.1) | 2750 (39.2) | 2763 (40.7) |
| ≥60 | 3453 | 3282 | 3558 | 3408 | 3425 (53.1) | 4078 (58.1) | 3904 (57.5) |
| Sex | |||||||
| Male | 4347 | 4101 | 4184 | 4089 | 4180 (64.8) | 4499 (64.1) | 4298 (63.3) |
| Female | 2279 | 2184 | 2318 | 2281 | 2266 (35.2) | 2518 (35.9) | 2494 (36.7) |
| Place of death | |||||||
| Hospital | 2543 | 2505 | 2584 | 2402 | 2509 (38.9) | 2650 (37.8) | 2881 (42.4) |
| Home | 3389 | 3126 | 3417 | 3404 | 3334 (51.7) | 4019 (57.3) | 3628 (53.4) |
| Other | 694 | 654 | 501 | 564 | 603 (9.4) | 348 (4.9) | 283 (4.1) |
Figure 1A and B depict the week-wise COVID-19-confirmed cases and deaths in the Faridabad district reported in 2020 and 2021 (untill September 30, 2021). A multimodal curve with the peak in wk 48 is seen in Figure 1A while in Figure 1B a steeply sloping unimodal curve peaking at wk 18. A total of 402 COVID-19 deaths were reported in the Faridabad district till December 31, 2020 and a further 314 were reported between January 1, 2021 and September 30, 202113. The peaks of all-cause deaths observed, correspond temporally and in terms of magnitude to infection surges in the district13. Figures 2A, B and 3A–D depict the week-wise mortality reported in 2020 and 2021 along with the CIs of the historical average by sex and age groups. These show that the highest estimate of excess mortality was in ≥60 yr age group, with little impact on children below 14 yr and that women had parallel though smaller peaks than men throughout the pandemic.
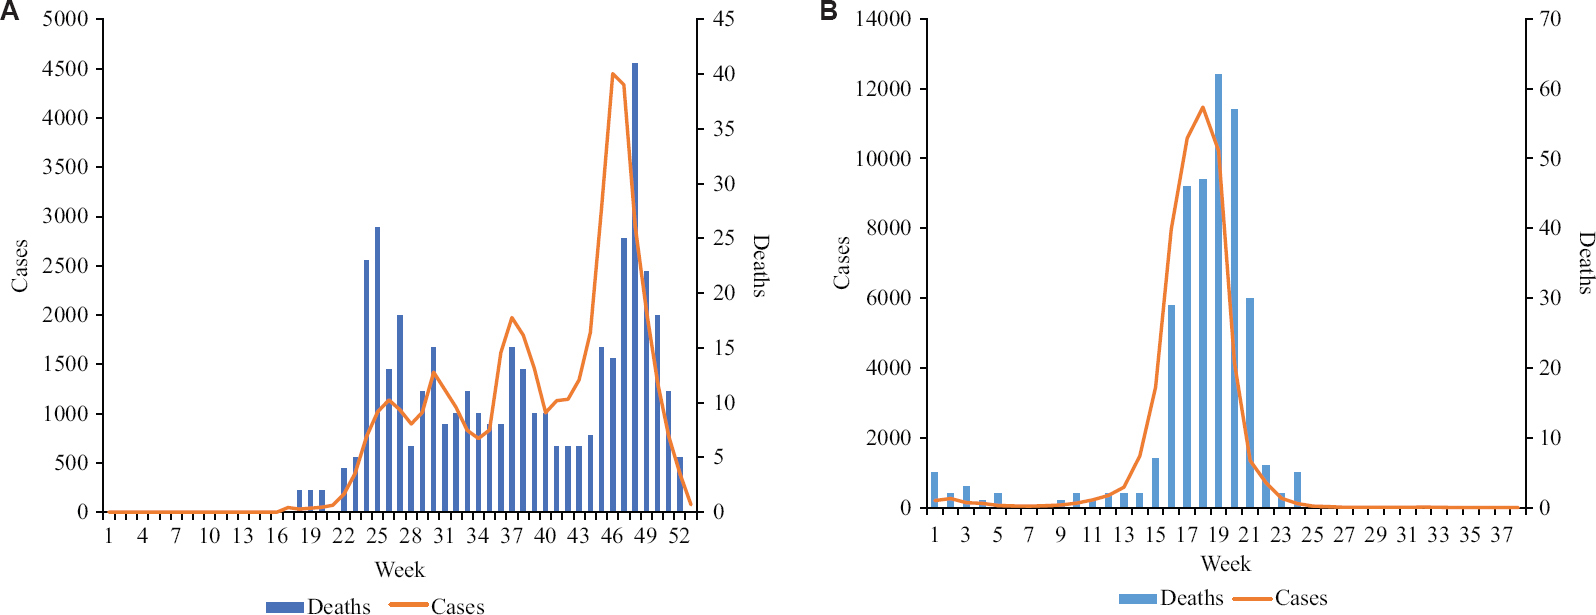
- (A and B) Weekly reported cases in Faridabad district: 2020 and 2021.
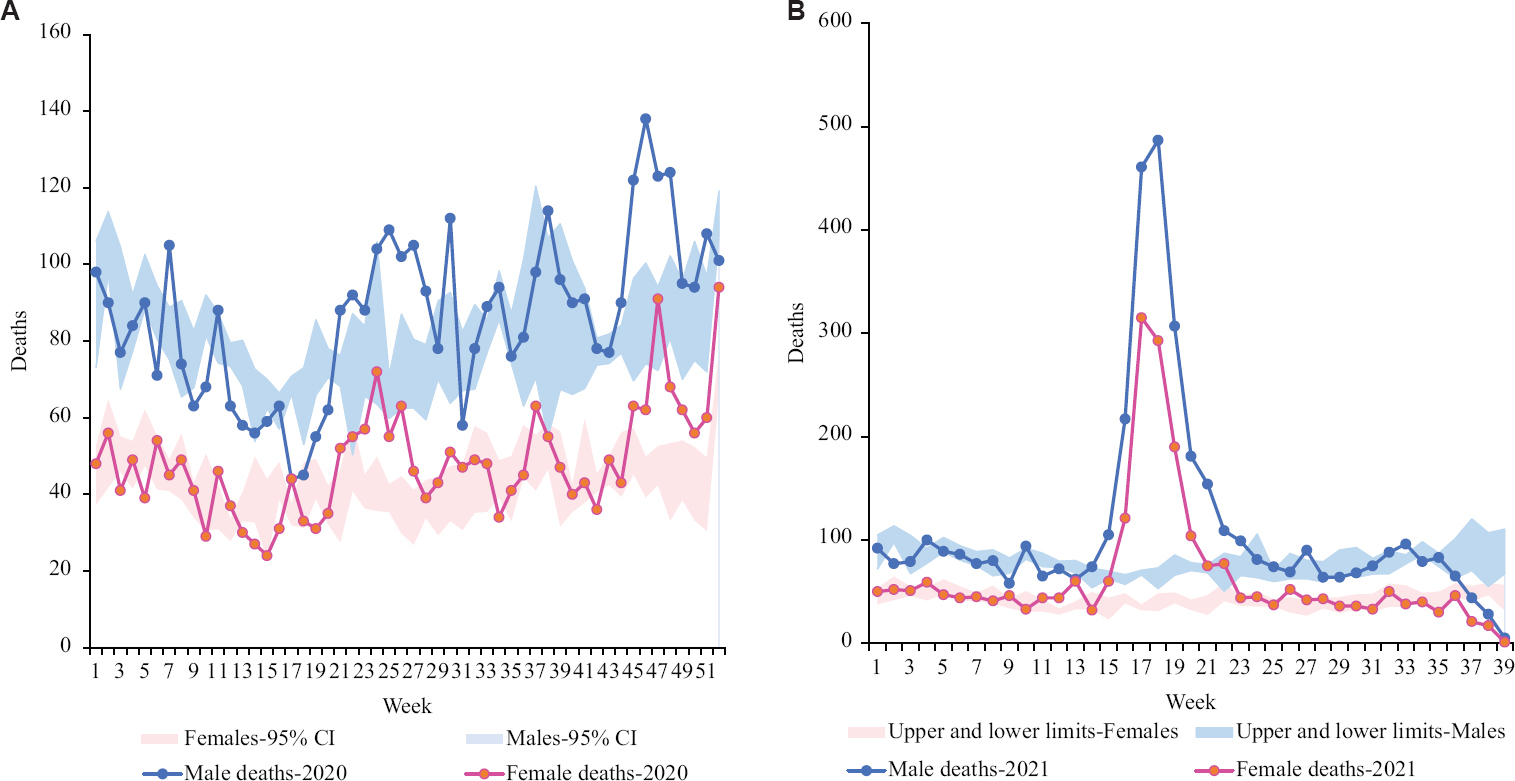
- (A and B) Distribution of deaths in Ballabgarh and Badkhal in 2020 and 2021 by sex.
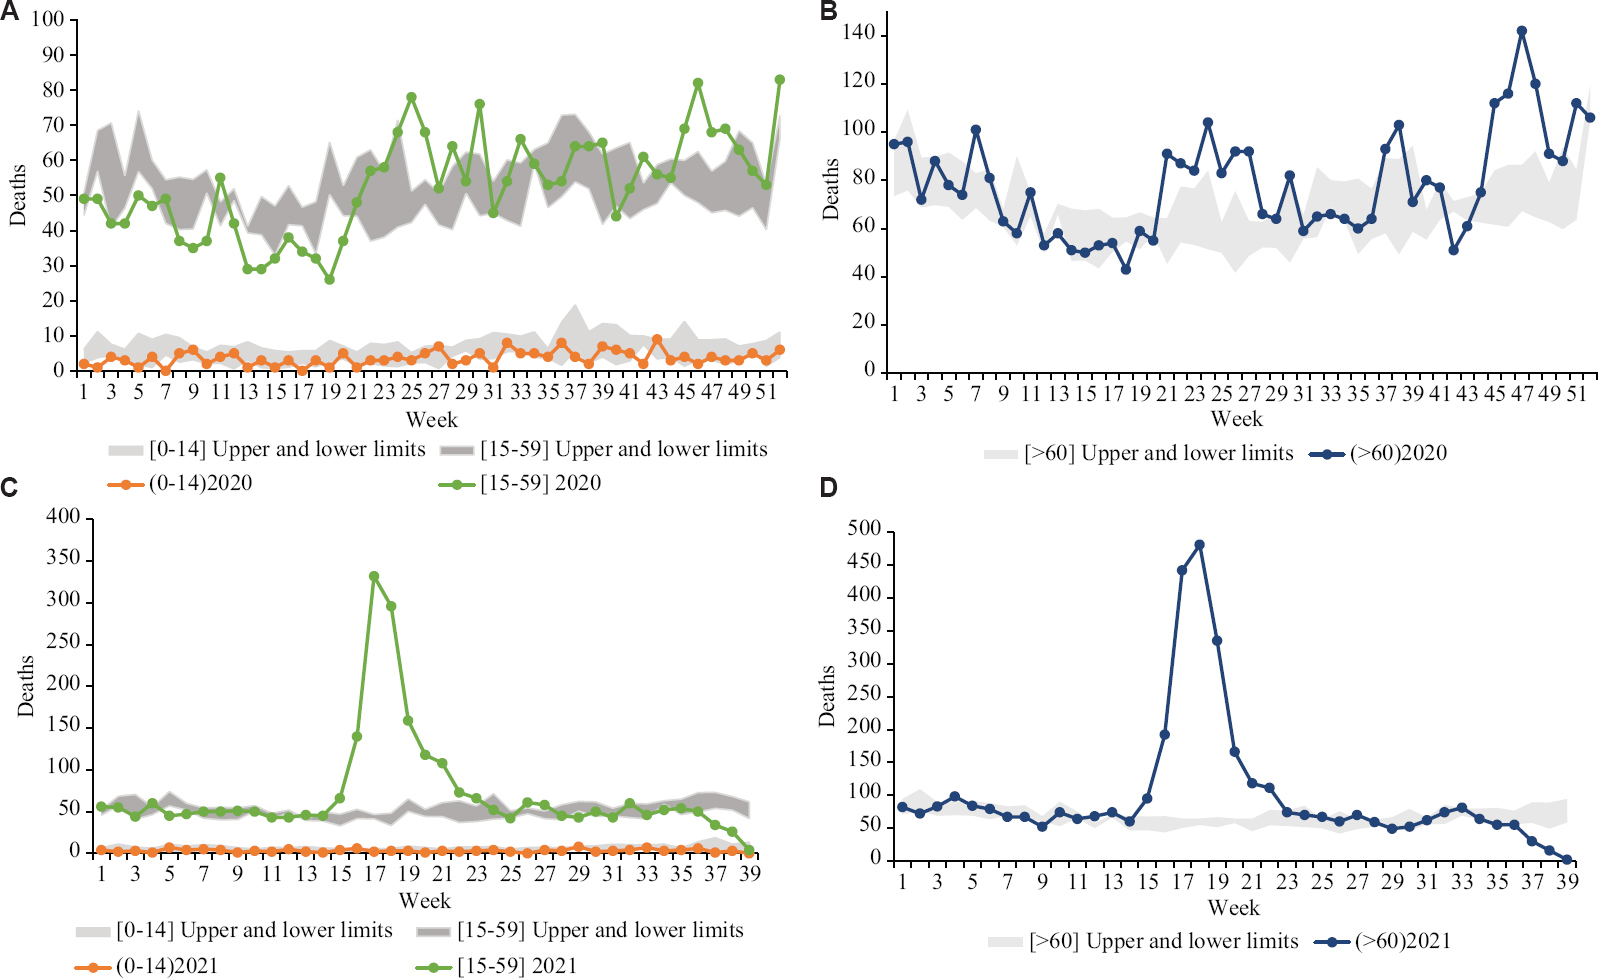
- (A-D) Distribution of deaths in Ballabgarh and Badkhal in 2020 and 2021 by various age groups.
Estimates of excess mortality derived by each of the three approaches for age group and sex are shown in Table II. All three approaches gave overlapping estimates except for the 0-14 yr age group. The range of estimates by linear regression was wider than others while that of the historical average was the narrowest. The estimates were highest for the age group >60 yr and higher for men as compared to women though the ranges were overlapping. The forecasting method showed a small excess death estimate range for the 0-14 yr age group, while the other two methods indicated no excess mortality in this age group. Smaller overall number of deaths in this group and an outlier number in 2016 impacted the mean deaths which could have affected the estimates. Assuming that deaths were uniformly distributed in the district, Badkhal and Ballabgarh Registrar’s office would account for 58 per cent (6446/11141) deaths in Faridabad district, or 233 of the 402 COVID-19 deaths in 2020 and 182 of the 314 COVID-19 deaths till September 30, 2021 from District Faridabad would be registered in these two tehsils. This gave us a ratio of estimated excess deaths, directly or indirectly attributable to COVID-19, to officially reported COVID-19 deaths between 1.8-4 for 2020 and 10.9-13.9 for 2021.
| Estimated excess deaths-2020: Above threshold (upper 95% CI and mean) | |||||||
|---|---|---|---|---|---|---|---|
| Approaches | 0-14 yr | 15-59 yr | ≥60 yr | Men | Women | Total | Excess to reported ratio* |
| Historical average | 0-9 | 146-285 | 424-727 | 289-553 | 209-383 | 485-875 | 1.8-2.9 |
| Forecasting | 21-106 | 117-363 | 416-806 | 317-686 | 182-463 | 595-1114 | 2.7-3.9 |
| Linear regression | 0-71 | 15-278 | 69-673 | 93-622 | 41-355 | 151-977 | 0.6-4.2 |
| Estimated excess deaths-2021 (till September 30): Above threshold (upper 95% CI and mean) | |||||||
| Historical average | 1-6 | 891-990 | 1467-1633 | 1463-1587 | 907-1019 | 2368-2534 | 13-13.9 |
| Forecasting | 10-61 | 804-987 | 1328-1564 | 1290-1547 | 826-1018 | 2170-2487 | 11.9-13.6 |
| Linear regression | 0-50 | 678-966 | 1278-1489 | 1307-1538 | 656-909 | 1977-2438 | 10.9-13.4 |
*Using an estimated 233 and 182 COVID-19 deaths in 2020 and 2021 reported in the two tehsils. CI, confidence interval
The agreement between lay-reported and physician-assigned CoD showed moderate agreement for tuberculosis (κ=0.481; SE=0.039, P<0.001) and external injuries (κ=0.453; SE=0.041, P<0.001) (Table III). There was poor agreement on all other major CoD categories. The high proportion of garbage codes (cardiac arrest or a mechanism of death like heart failure or sepsis) were recorded in the CRS. None of the 585 sampled deaths from 2020 had COVID-19 recorded as an underlying CoD.
| Cause of death categories | Proportionate mortality (n=585), % | κ (SE, P) |
|---|---|---|
| CVDs (I20-I25, I60-I69) | 30.8 | 0.213 (0.038, <0.001) |
| Malignant neoplasm (C00-D48) | 18.5 | 0.374 (0.035, <0.001) |
| Chronic obstructive pulmonary disease (J40-J47) | 4.3 | 0.138 (0.039, <0.001) |
| Other NCDs (K70-K77, N17-N19) | 12.1 | 0.305 (0.036, <0.001) |
| Tuberculosis (A15-A19) | 5.5 | 0.481 (0.039, <0.001) |
| Pneumonia (J18) | 1.5 | −0.011 (0.40, 0.611) |
| Other infectious disease (A00-B99 except A15-A19) | 3.8 | −0.012 (0.030, 0.654) |
| External causes: Injuries (V01-X85) | 2.9 | 0.453 (0.041, <0.001) |
ICD codes compared between those assigned by physician coders after verbal autopsies and those recorded in CRS database in a subset of 585 deaths between 30-69 yr age group. CVDs, cardiovascular diseases; NCDs, non-communicable diseases; SE, standard error
Discussion
There is consensus that the best estimate of the COVID-19 death toll can be assessed through the excess mortality approach20. Our assessment of the appropriateness of CRS data from a district in India for excess mortality estimation for COVID-19 covering both the first and the second wave showed that the number of deaths registered increased in 2020/21, the three commonly used approaches used for excess mortality estimation provided overlapping estimates and the data were not appropriate for cause-specific excess mortality estimation.
Pandemic-associated lockdowns and mobility restrictions did not seem to have affected the historically high death registration completeness in Ballabgarh and Badkhal tehsils2. Our independent verification further validated this finding. As compared to the mean of the previous four years, about 450 additional deaths were registered in 2020 and the timeliness of death registration improved. Excess mortality estimates arrived at using three approaches overlapped thus indicating the robustness of the methods used. Pandemic-induced changes in registration coverage, if any, would affect the excess mortality estimates for all three approaches. Although a deficiency in registration could be made up by excess deaths, it is believed that this is unlikely in our study and, if present, would have resulted in further underestimation of excess deaths.
There is a wide variation in estimated all-cause excess mortality globally depending on the severity of the pandemic. A population-level analysis conducted in England and Wales up to November 20, 2020 estimated 15 per cent excess mortality21. Total mortality was higher by 9.9 per cent between March and November 2020 in Israel22. Brazil reported 10.7 per cent excess mortality between January to June 20204. In the United States, which has reported the highest number of COVID-19 deaths worldwide, an excess mortality of 22.9 per cent was reported between March 2020 and January 202123. On the other end of the spectrum, a mere 0.03-0.72 per cent excess mortality was observed across prefectures in Japan24, while New Zealand did not report any excess deaths in 20204. Our relatively lower excess death estimate was consistent with lower mortality rates reported from India in 2020. A 3-6 times higher mortality in 2021 was corroborated by anecdotal evidence. Consistent with the global trend we also reported higher excess mortality in the elderly (≥60 yr) age group16,21,22. Although COVID-19 affects both sexes equally, there are reports of more men than women dying from COVID-19 globally25,26. However, mortality risk for COVID-19 has been reported to be higher for women than men in India27.
The Institute for Health Metrics and Evaluation estimated the ratio of total COVID-19 deaths to reported COVID-19 deaths as 2.96 for India and later increased it to 5-25 for 2021 deaths28. An ecological analysis of 22 countries has estimated that deaths attributed to COVID-19 are underestimated by 35 per cent4. Another study tracking excess mortality figures across 89 countries reported a figure of 1.56 as a global undercount ratio of COVID-19 deaths29. Our estimate of the ratio of total excess deaths to officially reported COVID-19 deaths was between 1.8-4 for 2020 and 10.9-13.9 for 2021. This ratio is dependent on the access to testing as also the completeness of death registration. Our findings suggested that excess mortality figures as estimated from this study were reasonable. It is to be emphasized here that these excess deaths include those directly as well as indirectly attributable to COVID-19. Officially reported COVID-19 deaths are those directly attributable to COVID-19, the deceased either tested positive for COVID-19 or in which a physician certified that the underlying CoD was COVID-19 related. Problems in reporting COVID-19 deaths will be faced in deaths occurring out-of-hospital and indirect COVID-19 deaths such as cardiac or cancer deaths which occurred due to a lack of access to care.
The most important challenge in excess death estimation common to all methods is the availability of a baseline or expected deaths against which to compare the observed deaths7. When estimating excess deaths, it is recommended that the total for the most disaggregated analyses are obtained and summed. The forecasting option should be resorted to when there are less than four years of historical data. Other approaches including Poisson distribution to model for excess deaths have been used by researchers, and these are likely to give similar results23,24,29,30.
This exploratory study had several limitations. Being limited to only two blocks (tehsils) of one district, it should not be used as an estimate for the country as pandemic intensity and underreporting of deaths would vary widely between States as well as urban and rural areas. Due to the smaller number of recorded deaths per week, we used month as the unit of estimation. Any excess mortality estimate is ultimately dependent for the accuracy on stable population dynamics. Lack of data on possible migration in and out of the district and of recent population denominators and age distribution of the district was the additional limitation.
In conclusion, our study indicated the usefulness of the CRS mortality data for estimating all-cause excess mortality due to COVID-19 in India. This approach may be considered for the estimation of excess deaths due to COVID-19 at the district, State or national level, subject to the availability of data.
Acknowledgment:
Municipal Corporation of Faridabad is acknowledged for providing data access.
Financial support & sponsorship: None.
Conflicts of Interest: None.
References
- World Health Organization. WHO COVID-19 hompage. Available from: https://covid19.who.int/region/searo/country/in
- Office of the Registrar General, India. Ministry of Home Affairs, Government of India. Vital Statistics Division. Vital statistics of India based on the civil registration system 2019. Available from: https://crsorgi.gov.in/web/uploads/download/CRS%202019%20report.pdf
- Office of the Registrar General, India. Ministry of Home Affairs, Government of India. Vital Statistics Division. Report on medical certification of cause of death 2018. Available from: https://censusindia.gov.in/2011-documents/ MCCD_Report-2018.pdf
- Underestimation of COVID-19 mortality during the pandemic. ERJ Open Res. 2021;7:00766-2020.
- [Google Scholar]
- Reuters. Official COVID-19 death toll probably underestimates true total. Available from: https://www.reuters.com/article/health-coronairus-who-deaths-int-idUSKBN26J2PX
- World Health Organization. Revealing the toll of COVID-19: A technical package for rapid mortality surveillance and epidemic response. Available from: https://www.who.int/publications/i/item/revealing-the-toll-of-covid-19
- Global mortality impact of the 1957-1959 influenza pandemic. J Infect Dis. 2016;213:738-45.
- [Google Scholar]
- Evaluation of data sources and approaches for estimation of influenza-associated mortality in India. Influenza Other Respir Viruses. 2018;12:72-80.
- [Google Scholar]
- The civil registration system is a potentially viable data source for reliable subnational mortality measurement in India. BMJ Glob Health. 2020;5:e002586.
- [Google Scholar]
- Study on health infrastructure in NCR, Vol 1. New Delhi: Mott MacDonald; 2015.
- Directorate of Census Operations Haryana. District census handbook Faridabad; 2011. Available from: https://censusindia.gov.in/2011census/dchb/DCHB_A/06/0620_PAR T_A_DCHB_FARIDABAD.pdf
- Office of the Registrar General, India. SRS bulletin, volume 53 No. 1; 2020. Available from: https://censusindia.gov.in/vital_statistics/SRS_Bulletins/SRS%20Bulletin_2018.pdf
- COVID19INDIA. Haryana. Available from: https://www.covid19india.org/state/HR
- Director General Health Services, Haryana. Sero-prevalence of anti-SARS-CoV-2 IgG antibodies in Haryana, India: A population based cross-sectional study (2nd round); 2020. Available from: http://nhmharyana.gov.in/WriteReadData/userfiles/file/CoronaVirus/Final%20COVID-19%20Sero%20Survey%20in%20Haryana%20Round-II%20Booklet%2028-10-2020.pdf
- Athanasopoulos G. Chapter 7.7 forecasting with ETS models. In: Forecasting principles and practice (2nd ed). Melbourne, Australia: OTexts; 2018.
- Patterns of COVID-19 related excess mortality in the municipalities of Northern Italy during the first wave of the pandemic. Health Place. 2021;67:102508.
- [Google Scholar]
- Adult mortality surveillance by routine health workers using a short verbal autopsy tool in rural north India. J Epidemiol Community Health. 2012;66:501-6.
- [Google Scholar]
- Mortality in India established through verbal autopsies (MINErVA):Strengthening national mortality surveillance system in India. J Glob Health. 2020;10:020431.
- [Google Scholar]
- Excess mortality: The gold standard in measuring the impact of COVID-19 worldwide? J R Soc Med. 2020;113:329-34.
- [Google Scholar]
- Estimating the burden of the COVID-19 pandemic on mortality, life expectancy and lifespan inequality in England and Wales:A population-level analysis. J Epidemiol Community Health. 2021;75:735-40.
- [Google Scholar]
- Excess mortality during the COVID-19 pandemic in Israel, March-November 2020: When, where, and for whom? Isr J Health Policy Res. 2021;10:17.
- [Google Scholar]
- Excess deaths from COVID-19 and other causes in the US, March 1, 2020, to January 2,2021. JAMA. 2021;325:1786-9.
- [Google Scholar]
- Excess all-cause deaths during coronavirus disease pandemic, Japan, January-May 2020. Emerg Infect Dis. 2021;27:789-95.
- [Google Scholar]
- Male sex identified by global COVID-19 meta-analysis as a risk factor for death and ITU admission. Nat Commun. 20206317;11
- [Google Scholar]
- Equal risk, unequal burden? Gender differentials in COVID-19 mortality in India. J Glob Health Sci. 2020;2:e17.
- [Google Scholar]
- 2021. Estimation of total mortality due to COVID-19. Available from:http://www.healthdata.org/special-analysis/estimation-excess -mortality-due-covid-19-and-scalars-reported-covid-19-deat hs
- Tracking excess mortality across countries during the COVID-19 pandemic with the World Mortality Dataset. Elife. 2021;10:e69336.
- [Google Scholar]
- COVID-19 and excess all-cause mortality in the US and 18 comparison countries. JAMA. 2020;324:2100-2.
- [Google Scholar]


