
Translate this page into:
Exploration of population ecological factors related to the spatial heterogeneity of dengue fever cases diagnosed through a national network of laboratories in India, 2017
For correspondence: Dr Vasna Joshua, Indian Council of Medical Research-National Institute of Epidemiology, Second Main Road, Tamil Nadu Housing Board, Ayapakkam, Near Ambattur, Chennai 600 077, Tamil Nadu, India e-mail: vasnajoshua@yahoo.com
-
Received: ,
This is an open access journal, and articles are distributed under the terms of the Creative Commons Attribution-NonCommercial-ShareAlike 4.0 License, which allows others to remix, tweak, and build upon the work non-commercially, as long as appropriate credit is given and the new creations are licensed under the identical terms.
This article was originally published by Wolters Kluwer - Medknow and was migrated to Scientific Scholar after the change of Publisher.
Abstract
Background & objectives:
Dengue virus (DENV) transmission is known to be influenced by the environmental conditions. During 2017, the Viral Research and Diagnostic Laboratories (VRDLs) tested 78,744 suspected dengue fever (DF) patients, of whom, 21,260 were laboratory confirmed. The objectives of the study were to evaluate the hypothesis that spatial heterogeneity existed for DF patients and to identify significant determinants of DENV transmission in various districts across the Indian States during 2017.
Methods:
Laboratory confirmed DF cases were analysed from 402 districts spread across the Indian States. The determinants for DF transmission included in the model were population density, proportion of population living in rural areas, proportion of forest cover area to the total geographical area, proportion of persons not able to read and write and who were aged greater than seven years; the climatic variables considered were minimum, maximum and average temperature, precipitation and cumulative rainfall. The spatial heterogeneity was assessed using spatial regression analysis.
Results:
DF cases showed strong spatial dependency, with Moran's I=4.44 (P<0.001). The robust measure for spatial lag (6.55; P=0.01) was found to be the best model fit for the data set. Minimum temperature and cumulative rainfall were significant predictors.
Interpretation & conclusions:
A significant increase in the number of dengue cases has occurred when the minimum temperature was 23.0-25.8°C and the cumulative rainfall 118.14-611.64 mm across the Indian districts. Further in-depth investigations incorporating more number of demographic, ecological and socio-economic factors would be needed for robust conclusions.
Keywords
Dengue
ecological factors
humidity
India
spatial regression
temperature
transmission

Dengue disease is an important public health problem in India. The incidence of dengue has increased 30-fold in the last 50 yr with increasing geographic expansion to new places and in the current decade, from urban to rural settings1. In the early 20th century, dengue was endemic in a few southern (Maharashtra, Karnataka, Tamil Nadu and Puducherry) and northern States (Delhi, Rajasthan, Haryana, Punjab and Chandigarh). It has spread to many other States in India, including the Union Territories2.
The transmission of dengue virus (DENV) is influenced by the environmental conditions; short-term changes in weather, particularly temperature, precipitation and humidity are correlated with dengue incidence3. The intensity and pattern of occurrence of dengue are dependent on interrelated human, vector, environment and virus-related factors456. These factors have been considered as drivers of the spatial patterns of transmission7. Social factors such as educational status of the household members and demographics have been found to be negatively correlated with increased dengue burden8. It has been reported that DENV evolution first started with Aedes albopictus in the forests of Southeast Asia, and later as Ae. aegyti and its transmission was more in forest cover areas910. Further, weather variables predicted the intensity and timing of outbreaks (OB), which included minimum, maximum and mean temperature; relative humidity; wind velocity and precipitation11. Considering the rising incidence of DENV infection in India, this study was conducted to find out environmental factors associated with the DENV transmission. The main objectives of this study were to evaluate the hypothesis that spatial heterogeneity existed in distribution of dengue fever (DF) cases and to identify significant determinants of DF transmission in different districts in India. This study was undertaken at 51 Viral Research and Diagnostic Laboratories (VRDLs) in 26 States across the country established under the Department of Health Research and Indian Council of Medical Research (DHR/ICMR), Government of India, New Delhi, India.
Material & Methods
The study was conducted after obtaining the ethical clearance from the Institutional Ethics Committee of the ICMR-National Institute of Epidemiology, Chennai, India. During 2017, 51 VRDLs (41 medical college level, 5 State level and 5 regional level) were functional. Besides the 26 States where these VRDLs were located, these laboratories also provided diagnosis to suspected DF patients from five neighbouring States. Thus, 402 districts from 31 Indian States were included in developing the model.
Data source: During 2017, the Viral Research and Diagnostic Laboratory Network (VRDLN) investigated 78,744 suspected DF patients for NS1 antigen and/or IgM antibodies, of whom, 21,260 (27%) were found to be positive. It was also observed that the median time from the onset of symptom to the presentation was five days [Inter quartile range (IQR) of 3-7 days]. Information about time (date of onset of illness and date of seeking care), place (village, sub district/ tehsil and district) and person (age and sex) collected from each suspected DF patient was extracted and used for developing the model.
Geocoding: Four hundred and two districts were converted into point features that contained location (latitude and longitude) and spatial geometry using ArcGIS software (Environmental Systems Research Institute, ArcGIS Desktop: Release 10, 2010)12. Since the data pertained to only 402 districts, using the point shape file and the software GeoDa version 1.8.14 software13, the Thiessen polygons were formed by drawing boundaries according to the distribution of the available data points for 2017, with one polygon per district (Fig. 1) covering the entire/maximum area of VRDLN data availability.
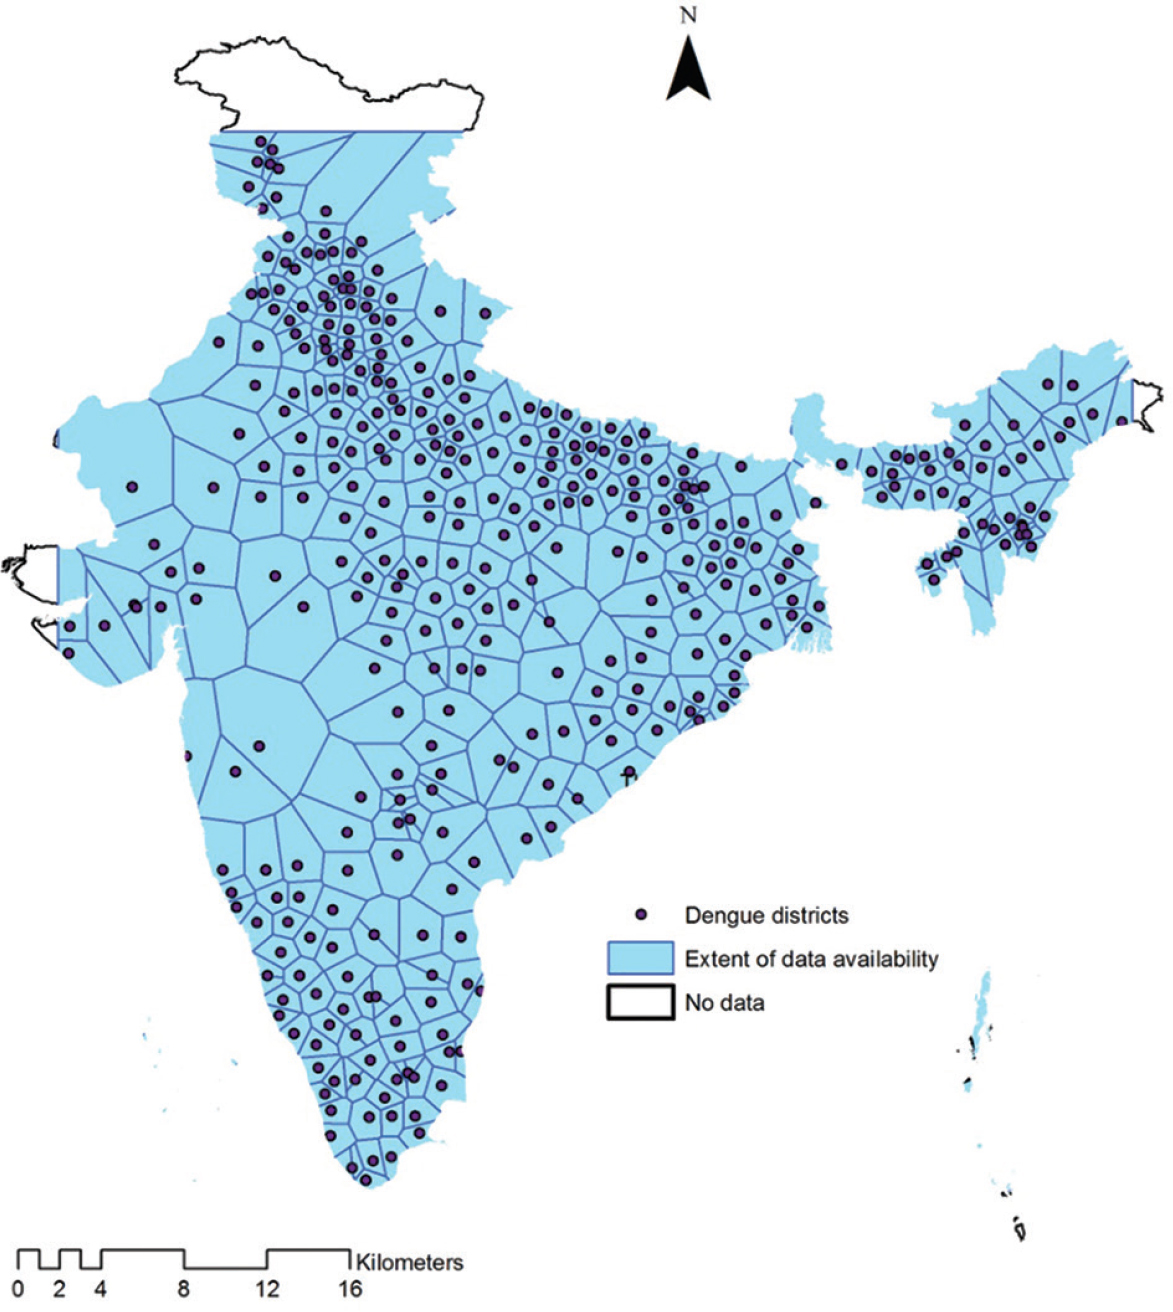
- Thiessen polygons for suspected dengue fever reported by the Virus Research and Diagnostic Laboratories in 402 districts across Indian States, 2017.
Covariate selection was based on review of literature for socio-demographic risk factors associated with DF and essentially with the available data. The determinants included in the model were population density (POPDENS) (i.e., number of inhabitants/ km2); proportion of population who lived in rural areas (RURAL), proportion of forest cover area to the total geographical area (FCA); proportion of persons who were not able to read and write and who were aged greater than seven years (ILLIT). The data for the above determinants were obtained from ‘India population 2017 portal’14. The four climatic variables considered were minimum temperature (MIN), maximum temperature (MAX), average temperature (AVG) and precipitation (PRECIP). These were downloaded from AccuWeather website15 for the respective time point and districts. The cumulative rainfall (CRAIN) was obtained from India Meteorological Department website16/local government website dashboards17. Since dengue positivity was higher during the months of August to November, with 18,265 (79%) patients occurring during this period (Fig. 2), average values for the four climatic variables for the months of August to November 2017 were considered for analysis. The summary statistics of the variables are shown in Table I.
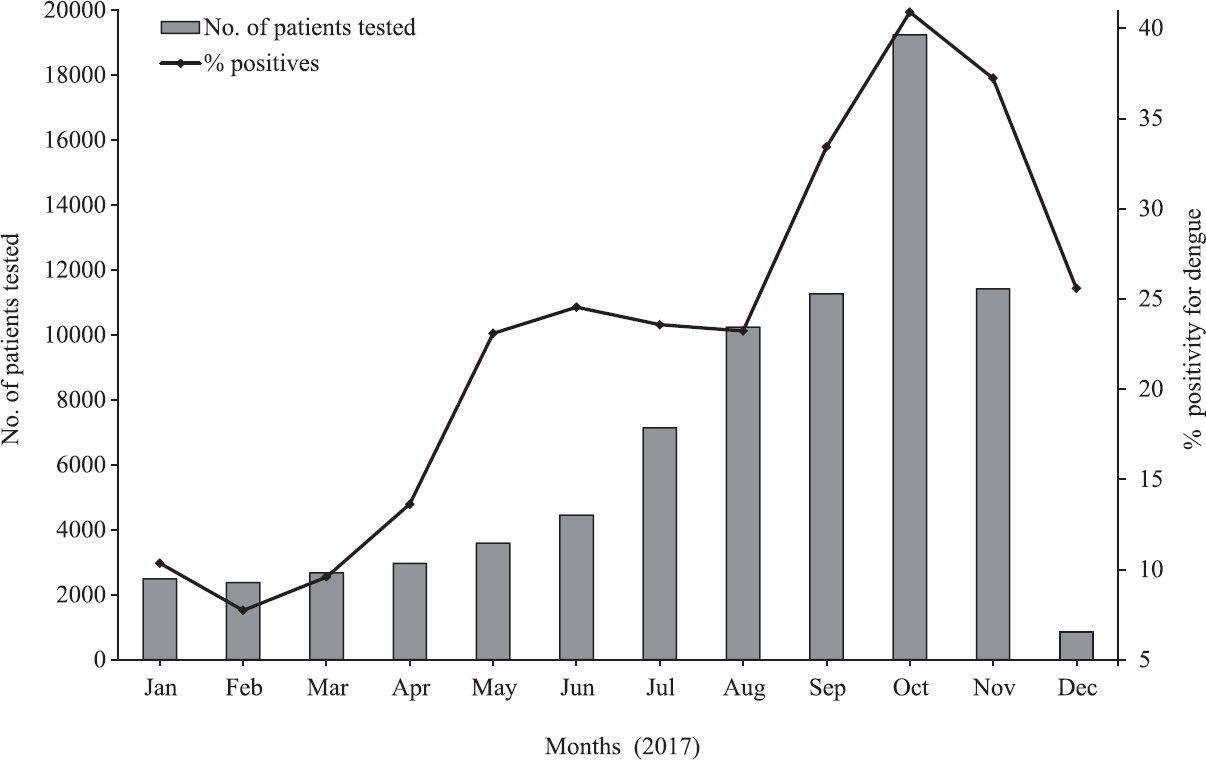
- Number of patients tested for dengue virus per month and percentage of positive tests.
| Variable under study | Definition | Mean | SD | Minimum | Maximum |
|---|---|---|---|---|---|
| Dengue cases (DENG) | Proportion (%) of laboratory confirmed cases among the suspected cases | 0.2032 | 0.2380 | 0.00 | 1.00 |
| Population density (POPDEN) | Number of inhabitants per square kilometer | 809.78 | 1806.75 | 13.00 | 19652.00 |
| Rural population (RURAL) | Proportion (%) of population live in rural areas | 70.79 | 22.50 | 0.00 | 98.44 |
| Forest cover area (FCA) | Proportion (%) of forest coverarea to the total geographical area | 25.67 | 92.65 | 0.02 | 1823.20 |
| Illiterate (ILLIT) | Proportion (%) of persons not able to read and write aged >seven years | 26.99 | 9.85 | 3.74 | 59.14 |
| Weather factors | |||||
| Monthly average minimum temperature* (MIN) | Mean of daily minimum temperature for a given month (°C) | 21.61 | 3.56 | 1.75 | 25.75 |
| Monthly average maximum temperature* (MAX) | Mean of daily maximum temperature for a given month (°C) | 31.65 | 2.68 | 17.50 | 36.50 |
| Monthly average temperature* (AVG) | Mean of daily temperature for a given month (°C) | 26.63 | 3.00 | 9.75 | 30.00 |
| Monthly cumulative rainfall* (CRAIN) | Monthly cumulative rainfall (mm) | 49.51 | 59.75 | 1.57 | 611.64 |
| Precipitation* (PRECIP) | The amount of precipitation in a month (mm) | 131.44 | 74.80 | 10.75 | 391.25 |
Statistical analysis: The software tool GeoDa13 was used for exploratory spatial data analysis including data manipulation, mapping and spatial regression analysis. The spatial neighbours were obtained using the Thiessen polygons and rook's weight of 1st order. Using the software, ordinary least square (OLS) regression and spatial regression models were constructed considering district-wise proportion of dengue cases (DENG) as dependent variable and POPDEN, RURAL, ILLIT, FCA, MIN, MAX, AVG, CRAIN and PRECIP as independent variables.
As a first step, the OLS model and its fit under classical Best Linear Unbiased Estimator assumptions was examined (the random errors have a mean of zero, constant variance and follows normal distribution). The step-wise technique was used to select a minimal adequate model with the smallest Akaike's information criterion (AIC)18 value, with P=0.10 and 0.05 as the entry and removal criteria, respectively. The error variance could well be affected by the spatial dependence in the data set. The spatial independency of residuals was evaluated using spatial autocorrelation coefficient, Moran's I, which was expressed as:
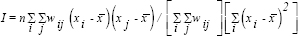
Where n was the total number of districts in the study; i and j represented different districts; xi was the residual of i and x̄ was the mean of residuals; wij was a measure of spatial weights of i and j19.
The values of Moran's I would be approximately between +1 (positive autocorrelation) and −1 (negative autocorrelation), and the expected value in the absence of autocorrelation was (−1)/(n−1). Positive spatial autocorrelation meant similar values tended to occur in adjacent areas, while negative autocorrelation implied nearby locations tended to have dissimilar values. If no spatial autocorrelation was found, then the spatial arrangement would be completely at random19.
The relationship between proportion of dengue cases (DENG) by district and set of determinants were explored using the spatial regression approach. Two distinct spatial regression models, i.e., spatial lag model and spatial error models were examined13. The spatial lag model is appropriate when the value of an event in one region is directly influenced by the values of the same event in its neighbouring regions. Spatial error model is appropriate when the concern being to adjust for the bias occurring from spatial autocorrelation or spatial dependency. A diagnostic test for spatial lag and error models, namely, Lagrange's multiplier (LM) test for both the models was applied. Further a modified LM test (i.e., Robust LM test) for both spatial lag and error model was attempted if both the models were significant. Finally, the best model fit was with the higher values of R2 values (significant P value), higher Log likelihood and the lower AIC value. Spatial regression diagnostics were examined using Jarque-Bera test (a goodness of fit test to check for normality of errors), Breusch-Pagan test (test for heteroskedasticity which measures the normality of the error terms) and Lagrange Multiplier (a diagnostic test for spatial lag and error models)13.
The AIC is the measure of relative goodness of fit of a statistical model. In the general case, AIC=2k–2ln (L); where k denotes the number of parameters in the statistical model, and L, the maximized value of the likelihood function for the estimated model. Given a set of models for the data, the preferred model is the one with the minimum AIC value.
Results
Of the nine determinants, only four determinants viz., minimum temperature, maximum temperature, precipitation and cumulative rainfall were found suitable for the model fit. The OLS model explained 53 per cent of variation in the dataset (Table II). It was also observed that the correlation coefficients between the proportion of dengue cases within district (DENG) and with the four determinants were significantly high (P<0.05).
| Variable under study | Coefficient | OLS model | Coefficient | Spatial lag model | Coefficient | Spatial error model | |||
|---|---|---|---|---|---|---|---|---|---|
| SE | P | SE | P | SE | P | ||||
| Constant | 0.277 | 0.188 | 0.141 | 0.110 | 0.183 | 0.546 | 0.263 | 0.204 | 0.192 |
| Average minimum temperature (MIN) | 0.024* | 0.007 | 0.005 | 0.024* | 0.006 | 0.004 | 0.024* | 0.007 | 0.004 |
| Average maximum temperature (MAX) | −0.020 | 0.009 | 0.068 | −0.01 | 0.009 | 0.284 | −0.021* | 0.010 | 0.047 |
| Cumulative rainfall (CRAIN) | 0.001 | 0.001 | 0.052 | 0.001* | 0.001 | 0.049 | 0.001* | 0.001 | 0.04 |
| Jarque-Bera test | 2.76 | - | 0.251 | - | - | - | - | - | - |
| Breusch-Pagan test | 27.47 | - | 0.053 | - | - | - | - | - | - |
| Moran’s I | 4.44* | - | <0.001 | - | - | - | - | - | - |
| Adjusted R2 | 0.53 | - | - | 0.68 | - | - | 0.68 | - | - |
| Lag coefficient (ρ/λ) | - | - | - | 0.29 | - | <0.001 | 0.30 | - | <0.001 |
| Log likelihood | 20.21 | - | - | 28.50 | - | - | 27.96 | - | - |
| Akaike info criterion | −32.41 | - | - | −47.00 | - | - | −47.02 | - | - |
| Lagrange multiplier | - | - | - | 20.86* | - | <0.001 | 17.20* | - | <0.001 |
| Robust lagrange’s multiplier | - | - | - | 6.55* | - | 0.01 | 2.89 | - | 0.09 |
| Number of observations | 402 | - | - | 402 | - | - | 402 | - | - |
*Significant coefficients. OLS, ordinary least square; SE, standard error
Other diagnostics of the model were also examined. The Jarque-Bera test score (2.763; P=0.251) indicated normality of the error term and the low probability of the Breusch-Pagan test (27.47; P=0.053) and non-significant points showed the non-existence of heteroskedasticity. A significant Moran's I value of 4.44 (P<0.001) indicated a strong positive spatial autocorrelation of the residuals (Table II). It was also observed that the OLS model overestimated the coefficients; hence, the spatial lag and error models were considered better for capturing the spatial effect in the model.
The LM test for both the models showed (Table II) that the test statistics was significant for both LM Spatial lag model (20.86; <0.001) and LM Spatial error model (17.20; <0.001). Both the models explained 68 per cent of the variation in the data set with an increased percentage of 15 per cent variation than the OLS model. Coefficients of the terms capturing spatial effects, viz., Ρ in spatial lag model (Ρ=029; P<0.001) and λ in spatial error model (λ=0.30; P<0.001) were also significant. The positive value of λ and P indicated substantial spatial dependence in dengue cases across the neighbouring districts. The Robust LM of spatial lag model (6.55; P=0.01) was significant, whereas the Robust LM error model (2.89; P=0.09) was insignificant, which meant that in the presence of error-dependent variable, the spatial lag dependency disappeared. As a result, the general model fit improved for Robust LM spatial lag model, as indicated with the higher values of R2 (0.68), significant P=0.01, higher Log likelihood value of 28.5 and lower AIC value of −47.0. Hence, the spatial lag model was considered to be the best model fit rather than OLS and spatial error model. The determinants, minimum temperature and cumulative rainfall turned out to be significant predictors for the spatial lag model.
These analyses indicated that DF cases had a strong spatial clustering and were significantly higher in districts with higher minimum temperature and higher cumulative rainfall across the various districts studied.
Discussion
Our analyses indicated that DF cases diagnosed through the VRDLs were spatially clustered across the districts in India. The significant Moran's I value showed that dengue cases occurred simultaneously in the same district or adjacent districts in India during 2017. This may also be due to the fact that spatial clustering of any disease is inevitable since human population generally live in spatial clusters rather than random distribution in space20.
Exploring the 21,260 serologically positive dengue cases in the study area and their location ecological factors, it was observed from the data (data not shown) that significantly increased number of cases occurred with a minimum temperature ranging between 23.0 and 25.8°C (χ2=11.92; P<0.001) and the cumulative rainfall of 118.14-611.64 mm (χ2=10.09; P<0.001) in the districts.
Many studies have examined the relationship between climatic factors and dengue at different geographic locations. High rainfall has been reported to be associated with dengue cases in Mexico21, Puerto Rico22, Taiwan23, Barbados24, Indonesia25, Thailand26, Trinidad27 and Venezuela28. Another study has shown that temperatures in the range of 22 to 31°C has provided a suitable environment for breeding and abundance of Aedes mosquito species and thereby increasing the risk of dengue cases29. A study from Lahore showed that minimum temperature had a significant positive effect whereas maximum temperature and wind showed a significant negative effect30. In a study conducted in Bhopal, India most dengue cases occurred in the period followed by peak rainfall, when mean minimum temperature had started falling, while mean maximum temperatures were still high31.
The present study has supported the fact that high minimum temperature and increased cumulative rainfall have been conducive for the propagation of dengue virus transmission and led to a significantly increased dengue cases across the various districts in India. The maximum temperature in the present study reached to a maximum of 36.5°C. It has been shown that presumably high temperatures that exceed the optimum may lead to a lower transmission probability of dengue virus than expected under a constant temperature model32. The precipitation in the study area ranged between 11 and 391 mm in a month. Heavy precipitation events may sometimes wash away the breeding sites of dengue7. These might be the reasons for non-significance of the dengue cases in the study area.
Our analysis had certain limitations. First, the analysis was based on the data collected from patients seeking care at the medical college hospitals and reported by the health authorities covered under VRDLN and might not include all the cases of DF spread over the entire country. Places where VRDLs are located are likely to have higher proportion of patients than the neighbouring districts or districts within neighbouring States. Second, relative humidity was found to be strongly associated with mosquito proliferation in several studies3334. However, data about relative humidity were available for only 82 districts for 2017. In these 82 districts, relative humidity and rainfall were highly correlated (correlation coefficient=0.71, P<0.05). Therefore rainfall data were included in the model. The data analysis was based on climate change variables for the four high positivity dengue months (August to December 2017) for the 402 districts; hence it might not represent the entire country. The patient's information was geocoded using the address reported by the patient during the time of investigation and there might be a little shift from their exact location of residence. The study facts pertained to the ecological conditions for the year 2017. Further in-depth investigation by including more number of demographic, ecological and socio-economic factors in the analysis and for a longer period would be more precise for robust conclusions.
Acknowledgment
Authors thank the principal investigators, scientists and staff from Resource Centre, Virus Diagnostic Laboratory (VDL), ICMR-National Institute of Virology, Pune. Authors also thank all consultants of Virus Research and Diagnostic Laboratory Network.
Financial support & sponsorship: Authors acknowledge the Indian Council of Medical Research, New Delhi, for financial support
Conflicts of Interest: None.
References
- 2009. Dengue: Guidelines for diagnosis, treatment, prevention and control. Geneva: WHO; Available from: http://www.ncbi.nlm.nih.gov/books/ NBK143159/
- Dengue. Available from: https://www.cdc.gov/dengue/entomologyecology/climate. html,
- Aedes aegypti density and the risk of dengue virus transmission. In: Takken W, Scott TW, eds. Ecological aspects for application of genetically modified mosquitoes. The Netherlands: FRONTIS, Dordrecht; 2003. p. :187-206.
- [Google Scholar]
- Review of the factors modulating dengue transmission. Epidemiol Rev. 1995;17:321-35.
- [Google Scholar]
- Socioeconomic and environmental determinants of dengue transmission in an urban setting: An ecological study in Nouméa, New Caledonia. PLoS Negl Trop Dis. 2017;11:e0005471.
- [Google Scholar]
- >The social and spatial ecology of dengue presence and burden during an outbreak in Guayaquil, Ecuador, 2012. Int J Environ Res Public Health. 2018;15 pii: E827
- [Google Scholar]
- New Moves in the World's fight against dengue, with an eye on India. 2017. The Wire. Available from: https://thewirein/health/dengue-fever-wolbachia-aedes-aegypti-serotypes-vaccine
- [Google Scholar]
- Studies of the ecology of dengue in Malaysia: A preliminary report. J Med Entomol. 1965;2:203-8.
- [Google Scholar]
- Climate and dengue transmission: Evidence and implications. Environ Health Perspect. 2013;121:1264-72.
- [Google Scholar]
- ArcGIS desktop: Release 10. Redlands, CA, USA: ESRI; 2010.
- 2017. Available from: http://indiapopulation2017in
- Available from: https://www. accuweather.com/en/in/india-weather
- Available from: https:// tradingeconomics.com/india/precipitation
- Handbook of methods of applied statistics. Vol 1. Hoboken, NJ, USA: John Wiley & Sons; 1967.
- An introductory guide to disease mapping. Hoboken, NJ, USA: John Wiley & Son; 2001. p. :1-75.
- Climate-based descriptive models of dengue fever: the 2002 epidemic in Colima, Mexico. J Environ Health. 2006;68:40-4, 55.
- [Google Scholar]
- Local and global effects of climate on dengue transmission in Puerto Rico. PLoS Negl Trop Dis. 2009;3:e382.
- [Google Scholar]
- Lagged temperature effect with mosquito transmission potential explains dengue variability in southern Taiwan: insights from a statistical analysis. Sci Total Environ. 2010;408:4069-75.
- [Google Scholar]
- Climatological variables and the incidence of Dengue fever in Barbados. Int J Environ Health Res. 2004;14:429-41.
- [Google Scholar]
- Epidemic dengue transmission in southern Sumatra, Indonesia. Trans R Soc Trop Med Hyg. 2001;95:257-65.
- [Google Scholar]
- An observation on correlation between rainfall and the prevalence of clinical cases of dengue in Thailand. J Vector Borne Dis. 2006;43:73-6.
- [Google Scholar]
- Climate, mosquito indices and the epidemiology of dengue fever in Trinidad (2002-2004) Ann Trop Med Parasitol. 2007;101:69-77.
- [Google Scholar]
- Eco-epidemiological factors associated with hyperendemic dengue haemorrhagic fever in Maracay City, Venezuela WHO Regional Office for South-East Asia. 2002. Available from: https:// apps.who.int/iris/bitstream/handle/10665/163735/dbv26p84. pdf?sequence=1&isAllowed=y
- [Google Scholar]
- Current status of dengue and chikungunya in India. WHO South East Asia J Public Health. 2014;3:22-6.
- [Google Scholar]
- Using PCA poisson and negative binomial model to study the climatic factor and dengue fever outbreak in Lahore. J Basic Appl Sci. 2015;11:8-16.
- [Google Scholar]
- A study of spatial and meteorological determinants of dengue outbreak in Bhopal City in 2014. J Vector Borne Dis. 2016;53:225-33.
- [Google Scholar]
- Impact of daily temperature fluctuations on dengue virus transmission by Aedes aegypti. Proc Natl Acad Sci U S A. 2011;108:7460-5.
- [Google Scholar]
- The ocurrence of dengue and weather changes in Brazil: a systematic review. Rev Bras Epidemiol. 2013;16:240-56.
- [Google Scholar]
- Statistical modeling reveals the effect of absolute humidity on dengue in Singapore. PLoS Negl Trop Dis. 2014;8:e2805.
- [Google Scholar]


