
Translate this page into:
Evaluation of new non-invasive & conventional invasive methods of haemoglobin estimation in blood donors
For correspondence: Dr Suchet Sachdev, Department of Transfusion Medicine, Postgraduate Institute of Medical Education & Research, Sector 12, Chandigarh 160 012, India e-mail: suchetsachdev@yahoo.com
-
Received: ,
This is an open access journal, and articles are distributed under the terms of the Creative Commons Attribution-NonCommercial-ShareAlike 4.0 License, which allows others to remix, tweak, and build upon the work non-commercially, as long as appropriate credit is given and the new creations are licensed under the identical terms.
This article was originally published by Wolters Kluwer - Medknow and was migrated to Scientific Scholar after the change of Publisher.
Abstract
Background & objectives:
The non-invasive method of haemoglobin (Hb) estimation has unique advantages of exemption of finger prick and associated pain, over invasive methods. This study was done to compare invasive and non-invasive methods of Hb estimation in blood donors keeping haematology analyzer (HA) as a reference method.
Methods:
The blood donors selected or deferred on the basis of CuSO4 method (Hb ≥12.5 g/dl), were included in the study. Hb values of the donors were estimated by HemoCue and then by OrSense methods. An immediate post-donation venous sample was drawn for analysis on HA.
Results:
The mean Hb value was 13.98±1.27 g/dl on HA, 14.87±1.03 g/dl on OrSense and 15.03±1.31 g/dl on HemoCue. CuSO4, HemoCue and OrSense demonstrated sensitivities of 18.7, 18.7 and 13.1 per cent, positive predictive values (PPV) of 64.5, 83.3 and 60.9 per cent and specificities of 98.9, 99.6 and 99.1 per cent, respectively. The intra-class correlation coefficient for OrSense was 0.726 while that for HemoCue was 0.851. Bland-Altman plots demonstrated 2SD difference of >2.0 g/dl in Hb estimations between HA and HemoCue/OrSense.
Interpretation & conclusions:
The non-invasive modality may provide the near-ideal pre-donation Hb screening platform if an improvement can be done in the sensitivity and PPV of the non-invasive method keeping in view its unique advantages.
Keywords
Copper sulphate
haemoglobin
HemoCue
invasive methods
non-invasive methods

Blood transfusion service is an integral part of the healthcare system throughout the world. Pre-donation check of haemoglobin (Hb) is a part of the standard operating procedure (SOP) for the blood donor selection. The conventional invasive technology to screen capillary Hb levels in blood donors is the semi-quantitative gravimetric copper sulphate (CuSO4) method12. For estimation of Hb levels, the invasive quantitative point-of-care testing (POCT) such as HemoCue 301+ (HemoCue AB, Ängelholm, Sweden) is based on the principle of photometry and the non-invasive NBM200 (OrSense, Nes Ziona, Israel) is based on the principle of occlusion spectroscopy34. The non-invasive method has unique advantages of exemption of finger prick, the associated pain and breach in innate immunity barrier, possible exposure to medical staff and biomedical waste generation. Besides, unacceptable accuracy of the gravimetric semi-quantitative CuSO4 method is being slowly replaced with more accurate POCT devices that provide quantitative Hb values with very short turn-around time. The validation of a new methodology is an important part of quality management system in blood transfusion services and must be done in the regional donor population.
Therefore, the present study was conducted to compare the invasive with the non-invasive methods of Hb estimation in blood donors in terms of classification functions [sensitivity, specificity, positive predictive value (PPV) and negative predictive value (NPV), reliability, accuracy and concordance] and to assess the effect of independent donor variables of test results keeping the haematology analyzer (HA) as a reference method of Hb estimation.
Material & Methods
This cross-sectional study was conducted in the department of Transfusion Medicine, Postgraduate Institute of Medical Education & Research (PGIMER), Chandigarh, India, from June to September 2014 after obtaining clearance from the Institutional Ethics Committee. Consecutive blood donor who provided written informed consent were enrolled in the study (voluntary non-random).
The sample size for the study was calculated using the online software of Survey System (Creative Research Systems, USA). Taking the population into account, with expected margin of error of three per cent and 95 per cent confidence level, the sample size of the study was calculated to be 1100. The post hoc power of the study was found to be >95 per cent.
The study included blood donors selected or deferred in accordance with the Drugs and Cosmetics Act of 1940 and the Rules therein of 1945, Ministry of Health and Family Welfare (MoHFW), Government of India (GoI) as amended from time to time5.
The blood donors were selected or deferred on the basis of CuSO4 method of Hb screening (Hb ≥12.5 g/dl) for the purpose of blood donation. For the study purpose, Hb values of the consenting participants (selected as well as deferred donors) were estimated by HemoCue and then by OrSense (on both side thumbs alternatively). A post-donation venous sample was drawn for analysis on HA from selected blood donors, based on the assumption that the time period of a blood donation was not sufficient enough to bring a change in the Hb value of the donor. In deferred donors, a venous sample was drawn only for the study purpose. Batch estimation of Hb levels of these samples was performed, within two hours from the time of sample collection, on the HA, the reference method (ORION 60, Ocean Medical Technology, New Delhi). Every day, manual external quality control was conducted with the reference control viz. Liquichek™ Hematology-16 Control (Bio-Rad Laboratories, USA). The working solution of CuSO4 (specific gravity: 1.053 for a cut-off Hb ≥12.5 g/dl) was prepared from the stock solution and was released for use after quality control. HemoCue was calibrated by the service representative from the manufacturer. The participant's details such as age, gender, weight, pulse rate and blood pressure were recorded on the worksheet from the blood donor history questionnaire and consent form of the department adapted from the template drafted by the National Blood Transfusion Council, MoHFW, GoI6.
Statistical analysis: The statistical analyses were done by SPSS version 20.0 (IBM Corp., Chicago, USA) and Microsoft Excel 2010 (Microsoft Corp., WA, USA). Normality of data distribution was assessed by plotting box-plot charts. Data were presented as mean±standard deviation (SD). Mean variation was reflected by the bias which is the difference between the test and reference method. Classification functions (sensitivity, specificity, PPV, NPV and accuracy) of the test methods were assessed with reference to the HA. The donors were categorized into the following four groups viz. true positive (TP) donors who were truly deferred by screening methods (Hb <12.5 g/dl on both screening test and HA); false positive (FP) donors who were falsely deferred by screening methods (Hb <12.5 g/dl on screening test, but >12.5 g/dl on HA); true negative (TN) donors who were truly accepted by screening methods (Hb >12.5 g/dl on both screening test and HA); false negative (FN) donors who were falsely accepted by screening methods (Hb >12.5 g/dl on screening test, but <12.5 g/dl on HA). Reliability of the test methods was assessed by the intra-class correlation coefficient (ICC) (interpretation: <0: poor; 0.01-0.20: slight agreement; 0.21-0.40: fair agreement; 0.41-0.60: moderate agreement; 0.61-0.80: substantial agreement; and 0.81-1.00: almost perfect agreement)3. Bland-Altman analysis was performed to assess the concordance between the measurements obtained by the test and the reference methods. The limits of agreement (LoA) were calculated as mean difference ±2SD. Multivariable linear regression analysis was used to determine the effect of a set of variables independently on the bias. Receiver operating characteristic (ROC) curve was plotted for comparing the sensitivities of different Hb screening methods. All tests were two-sided with the level of significance fixed at 0.05.
Results
A total of 1100 participants were included; 18 were excluded due to technical errors in blood samples. Hb values of the remaining 1082 participants comprising 1051 selected and 31 deferred blood donors (Fig. 1)were taken into account for analysis. The study population consisted of 1071 males (99.16%) and 11 females (0.84%) (M:F ratio of 97:1); between 18 and 63 yr (30.17±7.97 yr) and weighing 47-117 kg (71.83±12.03 kg).
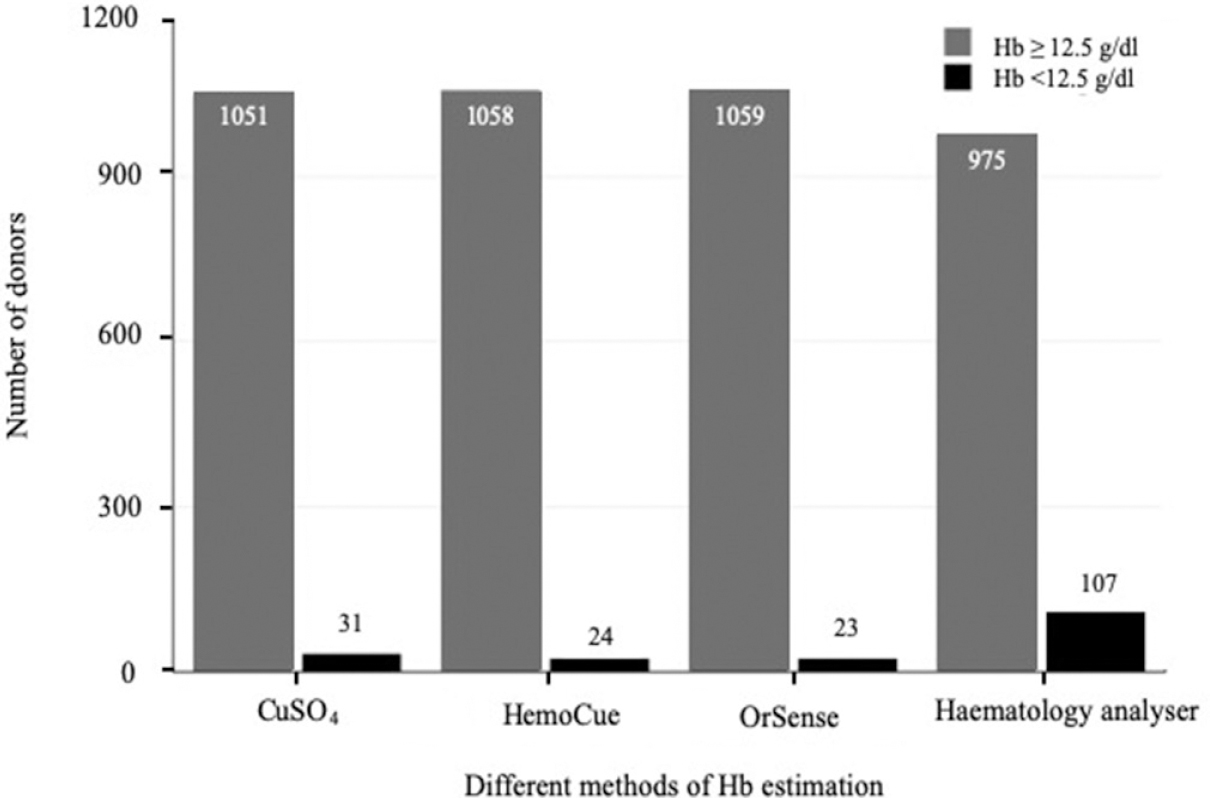
- Comparative column chart showing the stratification of the donors based on haemoglobin values obtained by the different methods.
Distribution of haemoglobin (Hb) data values: The Hb values obtained with HA and HemoCue showed normal distribution, while those with OrSense showed a negatively skewed distribution (Fig. 2).
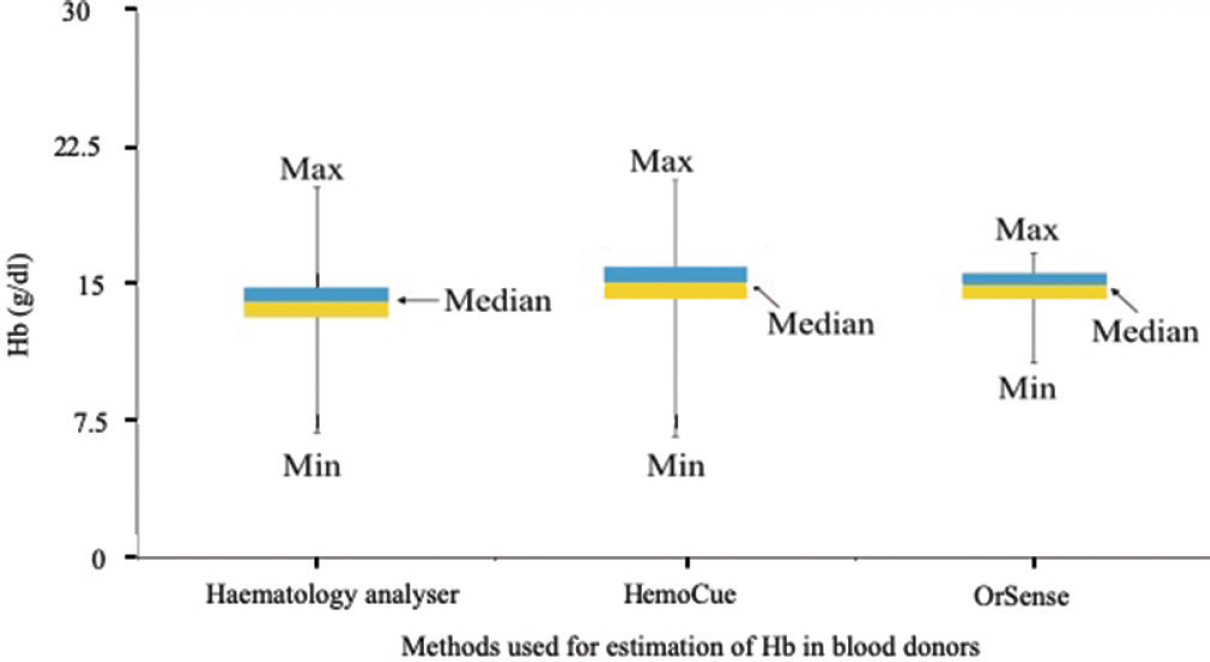
- Comparative Box-Whisker plot showing the distribution of the haemoglobin values as obtained by the haematology analyzer, the HemoCue and the OrSense.
Mean haemoglobin values and bias: The mean Hb values on HA, OrSense and HemoCue and their respective mean deviations are depicted in Table I. The bias associated with OrSense was 0.89 g/dl [95% confidence interval (CI), −2.99, −1.21], whereas it was 1.05 g/dl (95% CI, −2.87, −0.77) with HemoCue (Table I).
| Method | Haemoglobin (g/dl) mean±SD (range) | Bias (g/dl) | Mean deviation (g/dl) | ICC |
|---|---|---|---|---|
| HemoCue | 15.03±1.31 (6.6-20.7) | −1.05 | 0.82 | 0.851 |
| OrSense | 14.87±1.03 (10.65-16.7) | −0.89 | 1.00 | 0.726 |
| Haematology analyzer | 13.98±1.27 (6.8-20.3) | - | 0.96 | - |
ICC, intra-class correlation coefficient; SD, standard deviation
Classification functions of test methods: The Hb values were stratified based on cut-off Hb value of ≥12.5 g/dl and are represented in a column chart (Fig. 1). The HA categorized 975 (90.11%) donors with Hb ≥12.5 g/dl and 107 (9.89%) donors with Hb <12.5 g/dl. The study participants were categorized as truly deferred, falsely accepted, truly accepted or falsely deferred based on the true value of Hb obtained on the HA (Table II).
| Haematology analyzer | Donors with Hb <12.5 g/dl 107 (9.89%) |
Donors with Hb ≥12.5 g/dl 975 (90.11%) |
||
|---|---|---|---|---|
| Methods | Truly deferred donors (TP) | Falsely accepted donors (FN) | Truly accepted donors (TN) | Falsely deferred donors (FP) |
| CuSO4 (%) | 20 (1.84) | 87 (8.04) | 964 (89.10) | 11 (1.02) |
| HemoCue (%) | 20 (1.84) | 87 (8.04) | 971 (89.75) | 4 (0.37) |
| OrSense (%) | 14 (1.30) | 93 (8.60) | 966 (89.30) | 9 (0.80) |
TP, true positive; FN, false negative; TN, true negative; FP, false positive
The Hb values were further arbitrarily stratified as Hb of <8, 8-9.99, 10-11.99, 12-12.49, 12.5-16 and >16 g/dl based on HA to assess performance of test methods. All five participants with Hb <10 g/dl were correctly deferred by the CuSO4, HemoCue and OrSense methods. Of the 48 participants with Hb between 10.0 and 12.0 g/dl, 35 (72.91%) were falsely accepted by CuSO4, whereas 36 (75%) and 39 (81.25%) were falsely accepted by HemoCue and OrSense, respectively. Among the 54 participants with Hb between 12.0 and 12.49 g/dl, 52 (96.29%) donors were falsely accepted by CuSO4, whereas 51 (94.44%) and 54 (100%) were falsely accepted by HemoCue and OrSense, respectively. Of the 926 participants with Hb between 12.5 and 16.0 g/dl, 11 (1.18%) donors were falsely deferred by CuSO4, whereas four (0.43%) and nine (0.97%) were falsely deferred by HemoCue and OrSense, respectively. The remaining 49 participants with Hb >16 g/dl were correctly accepted by the CuSO4, HemoCue and OrSense methods.
CuSO4, HemoCue and OrSense demonstrated sensitivities of 18.7, 18.7 and 13.1 per cent and specificities of 98.9, 99.6 and 99.1 per cent, respectively. The PPVs were 64.5, 83.3 and 60.9 per cent; the NPVs were 91.7, 91.8 and 91.2 per cent and the accuracies were 90.9, 91.6 and 90.6 per cent, respectively.
Reliability of test methods: The ICC for OrSense was 0.726 (CI: 0.691, 0.756; P<0.001), demonstrating a substantial agreement, while that for the HemoCue was 0.851 (CI: 0.832, 0.867; P<0.001), demonstrating an almost perfect agreement Table I.
Concordance of test methods: Bland-Altman plots demonstrated a 2SD difference of >2.0 g/dl in Hb estimations between HA and HemoCue/OrSense. The deviation of the Hb values varied widely with HemoCue (0.774- −2.878 g/dl), as well as with OrSense (1.216- −2.999 g/dl) (Fig. 3A & B).
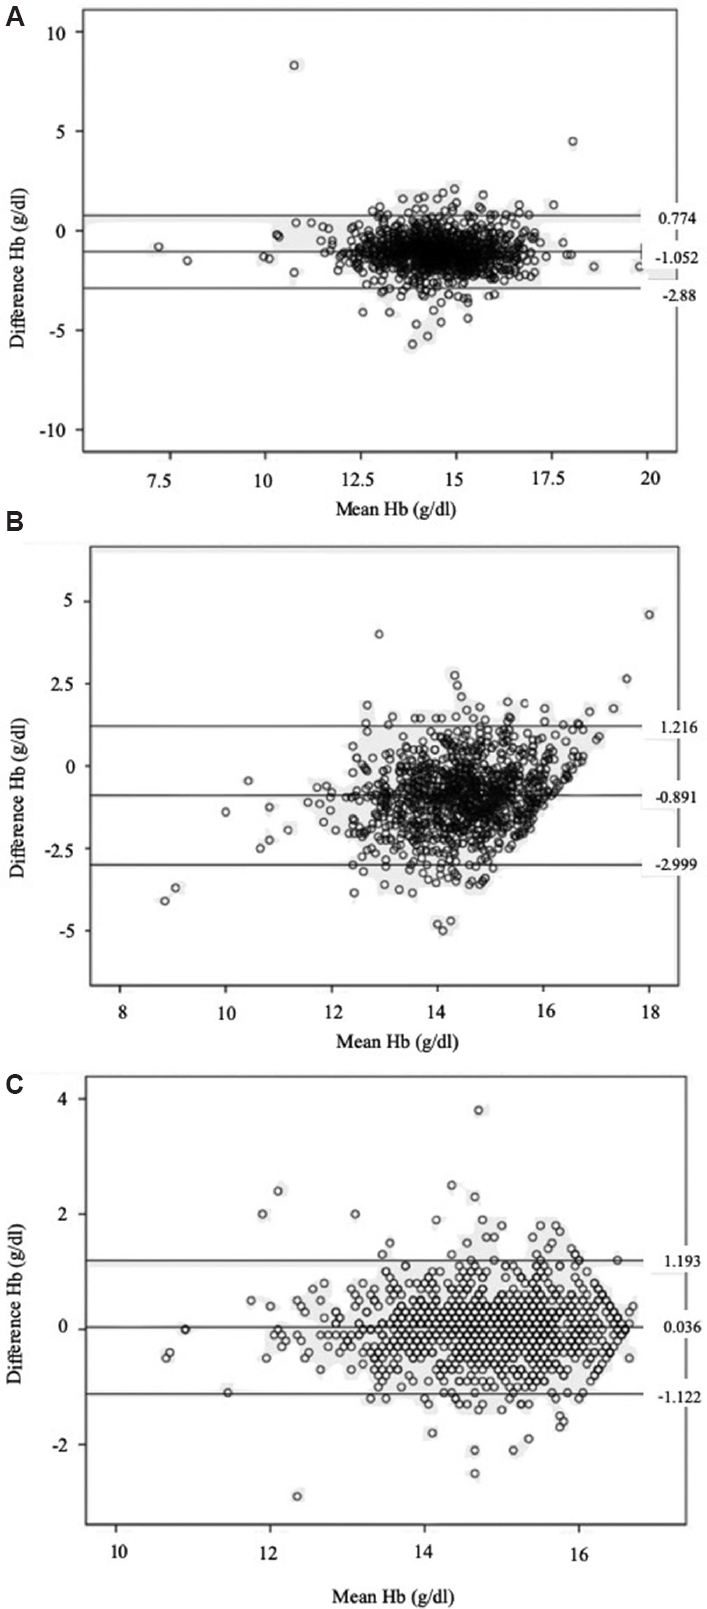
- Bland-Altman plot of concordance for the different screening methods. (A) HemoCue and the haematology analyzer; (B) OrSense and the haematology analyzer; (C) OrSense (right) and the OrSense (left).
Scatter plots of comparison of test methods: Scatter plots demonstrated a positive association between the two methods i.e. the values of Hb estimated by the HemoCue and the OrSense increased with the increase in the true value of Hb value (Fig. 4).
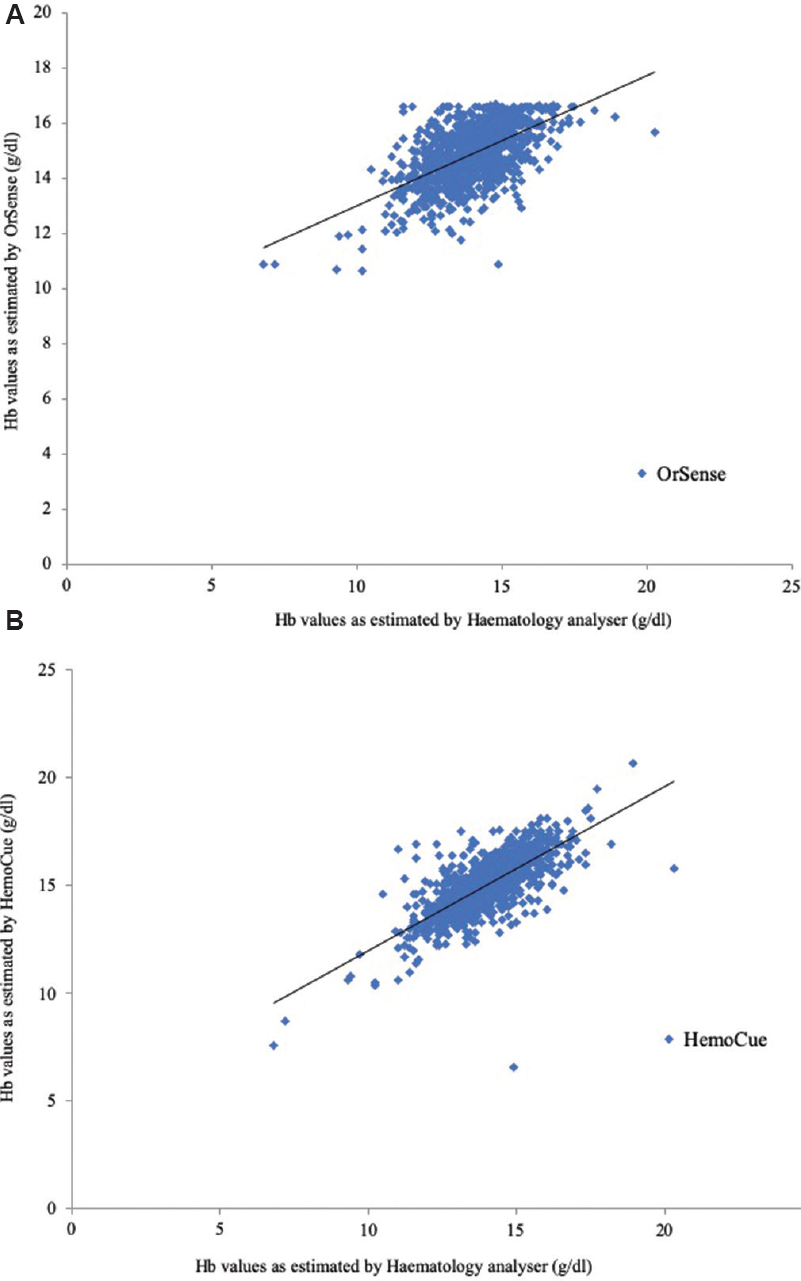
- Scatter plot showing comparison between the haemoglobin values estimated by (A) OrSense with respect to haematology analyzer, and (B) HemoCue with respect to haematology analyzer.
Effects of independent variables on haemoglobin estimation: Multivariable linear regression analysis showed that age, weight and pulse rate were associated with the bias for the HemoCue whereas gender and systolic blood pressure were associated with the bias for the OrSense. True value of Hb was associated with the bias observed with both HemoCue and OrSense (Table III).
| Independent variable | HemoCue Effect on bias (95% CI) |
P | OrSense Effect on bias (95% CI) |
P |
|---|---|---|---|---|
| Age | −0.17 (−0.023, −0.010) | <0.001 | −0.004 (−0.010, 0.003) | 0.240 |
| Gender | −0.26 (−0.786, 0.265) | 0.331 | −0.943 (−1.445, −0.440) | <0.001 |
| Weight | 0.005 (0.001, 0.010) | 0.020 | 0.001 (−0.004, 0.005) | 0.719 |
| Pulse rate | −0.009 (−0.015, −0.002) | 0.012 | 0.004 (−0.002, 0.010) | 0.217 |
| SBP | −0.001 (−0.007, 0.005) | 0.800 | −0.010 (−0.015, −0.004) | 0.001 |
| DBP | 0.005 (−0.002, 0.012) | 0.194 | 0.005 (−0.002, 0.012) | 0.133 |
| True value of Hb | 0.748 (0.706, 0.790) | <0.001 | 0.456 (0.416, 0.497) | <0.001 |
SBP, systolic blood pressure; DBP, diastolic blood pressure; Hb, haemoglobin; CI, confidence interval
Receiver operating characteristic (ROC) curves: The comparison of sensitivity and specificity for the screening methods of Hb estimation was done by plotting the ROC curves which showed higher sensitivity of the HemoCue as compared to the OrSense. The area under the curve (AUC) for the HemoCue was 0.890 (CI: 0.851, 0.930) and that for the OrSense was 0.808 (CI: 0.763, 0.854) (Fig. 5A).
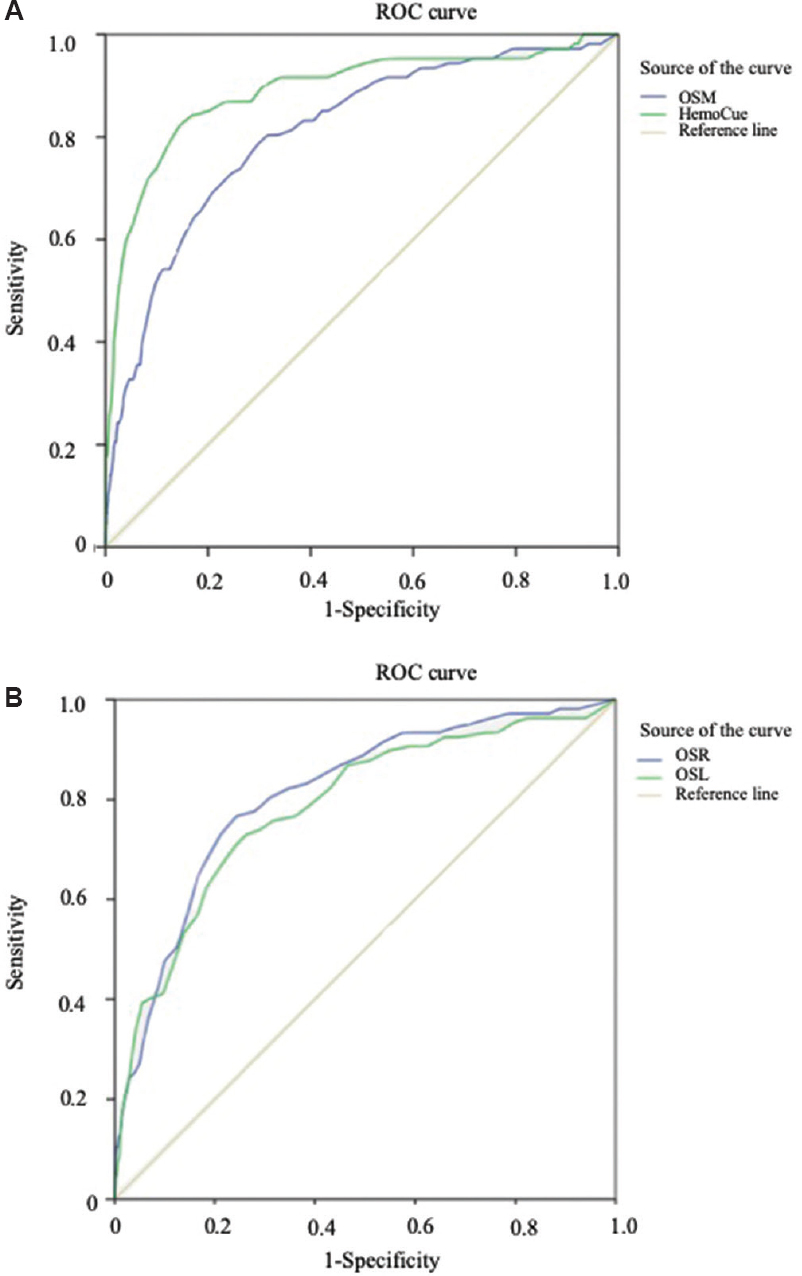
- Comparative receiver operating characteristic (ROC) curve for screening methods (A) OrSense (mean) (OSM) and HemoCue; (B) OrSense (left) (OSL) and OrSense (right) (OSR).
Concordance of haemoglobin values obtained with OrSense: The bias between the two sets of Hb values as obtained from either of the thumbs was 0.035±0.6 g/dl. The Bland-Altman plot corroborated with the interpretation that the deviation in the Hb values, as estimated by OrSense, was not affected by the chosen thumb side (Fig. 3C). The ROC curves showed similar sensitivities irrespective of the side of the thumb used for the Hb estimation in the study. The AUC for the OrSense (right) was 0.811 (CI: 0.768, 0.855) and that for the OrSense (left) method was 0.786 (CI: 0.737, 0.835) (Fig. 5B).
Discussion
Data were normally distributed for Hb values on HA and HemoCue. OrSense demonstrated a left-skewed deviation (negative skewness) i.e. it would overestimate Hb in donors with low true Hb values (<10 g/dl) and underestimate Hb in donors with high Hb values (>16 g/dl). Kim et al3 have reported a left-skewed deviation with OrSense and slight right skewness with HemoCue; however, model of HemoCue (201+ or 301+) was not specified in their study. The mean deviations of Hb with the test devices and the reference method were within the acceptable error of ±1 g/dl as per the standards laid down by the International Council for Standardization in Haematology7.
Bias observed with HemoCue of 1.05 g/dl in the present study was comparable to 1.19 g/dl reported by Bhaskaram et al8 from India. Other studies reported bias for HemoCue ranging from 0.21 to 0.83 g/dl38910111213. OrSense demonstrated a bias of 0.89 g/dl which was higher compared to 0.66 g/dl reported by Singh et al12 from India. However, the other studies reported a much lower bias with OrSense ranging from 0.10 to 0.29 g/dl310111415.
CuSO4 falsely accepted 87 of 1082 (8%) donors for the blood donation in the present study, which compared well with the five per cent reported by Malukani et al16. The false acceptance with HemoCue was 87 (8%), similar to that (6%) reported by Patel et al17. However, the false acceptance with OrSense was 93 (8.6%) which was higher than 1.5 and 2.5 per cent reported by Malukani et al16 and Ardin et al14 respectively. CuSO4 falsely deferred 11 of 1082 (1%) donors, which was in contrast to 29 per cent reported by Sawant et al18; this variation could be due to reasons ranging from preparation, quality control to storage and the technical competence and working diligence that could vary from person to person. These reasons have been of concern during the use of the semi-quantitative methodology. HemoCue falsely deferred four donors (0.37%), which was lower than 3.3 per cent reported by Patel et al17. However, OrSense falsely deferred nine (0.8%) which was lower in comparison to three and 5.8 per cent reported by Malukani et al16 and Ardin et al14, respectively.
The sensitivity of test methods was similar for CuSO4 (18.7%) and HemoCue (18.7%) but slightly lower for OrSense (13.1%). Other studies reported sensitivity for HemoCue ranging from 18.6 to 99.4 per cent and from 38.6 to 98 per cent for OrSense3101213181920. The specificity of test methods was similar for CuSO4 (98.87%), OrSense (99.07%) and HemoCue (99.58%). The reported specificity for HemoCue ranges from 45 to 99.8 per cent and from 79.5 to 99.1 per cent for OrSense in other studies3101213181920 (Table IV).
| Method | Study | Sample size | Sensitivity (%) | Specificity (%) | PPV (%) | NPV (%) | Accuracy (%) |
|---|---|---|---|---|---|---|---|
| HemoCue | Present study | 1082 | 18.7 | 99.6 | 83.3 | 91.8 | 91.6 |
| Sawant et al18 | 400 | 99 | 45 | 43 | 99 | - | |
| Kim et al3 | 506 | 42.7 | 98.6 | - | - | - | |
| Zhou et al13 | 69 | 94.9 | 76.7 | 84.1 | 92.0 | - | |
| Belardinelli et al10 | 445 | 99 | 99.5 | - | - | - | |
| Tondon et al19 | 1014 | 99.4 | 84.4 | - | - | - | |
| Ziemann et al20 | 9209 | 18.6 | 99.8 | 98.9 | 57.9 | 98.7 | |
| OrSense | Present study | 1082 | 13.1 | 99.1 | 60.9 | 91.2 | 90.6 |
| Kim et al3 | 506 | 38.6 | 93.6 | - | - | - | |
| Singh et al12 | 485 | 71.7 | 79.5 | 30.2 | 95.8 | - | |
| Belardinelli et al10 | 445 | 98 | 97 | - | - | - |
PPV, positive predictive value; NPV, negative predictive value
The PPV of the screening test is important while deciding on the method of choice for Hb estimation in blood donors where focus is towards both blood donor safety and avoidance of unnecessary deferral of potential blood donors. The PPV of test methods was comparable for CuSO4 and OrSense but significantly higher for HemoCue. The reported PPV ranges from 43 to 98.9 per cent for HemoCue and 24.8 to 30.2 per cent for OrSense in other studies12131820. As compared to other studies, HemoCue, being the screening test with highest PPV, may be the best available option in the invasive modalities. However, the non-invasive method viz. OrSense, with little less sensitivity and comparable specificity, when compared to HemoCue may be a viable alternative for donor screening with the advantage of exemption of both finger prick and biomedical waste generation.
NPV is important for donor safety. The NPV of test methods was comparable for CuSO4, HemoCue and OrSense. The reported NPV for HemoCue ranges from 57.9 to 99 per cent and for OrSense from 94.3 to 95.8 per cent in other studies12131820. As compared to other studies, the OrSense demonstrated an NPV which was as good as the CuSO4 and the HemoCue in the present study. The accuracy of each of the test methods was comparable. Ziemann et al20 have reported accuracy for HemoCue of 98.7 per cent.
Age, weight, pulse rate and true value of Hb were found to be associated with the bias for the Hb estimation by the HemoCue method, whereas gender, systolic blood pressure and true values of Hb were associated with the bias with OrSense. Gayat et al15 have reported that gender, heart rate, temperature, perfusion index and true value of Hb affect the bias associated with the OrSense. This difference in observation may be attributed to the ethnic differences and differences in the characteristics of the study population as well12.
The study had certain limitation as it was conducted in a centrally air-conditioned set-up with minimal variation in ambient temperature and humidity. Hence, the effects of the change in ambient temperature, humidity and dust in outdoor blood collection setups, on the measurements of Hb by these methods could not be assessed. The perfusion index which affects the Hb estimation by the OrSense was not taken into account in this study15. Whole blood donation is known to lower a donor's Hb level by approximately 0.5 g/dl immediately afterwards was not taken into account while estimating the Hb values by the HA14. The small number of female donors enrolled in the study was a limitation for assessing the effect of gender on the bias associated with the Hb measurements.
In conclusion, the present finding showed that non-invasive modality could provide the near-ideal pre-donation Hb screening platform only if improvement in sensitivity and PPV was possible keeping in view the unique advantage of exemption of both finger prick and biomedical waste generation.
Acknowledgment
Authors thank Drs Anuradha Kalra and Anita Pramod for their support in donor screening and mobilization while conducting the study.
Financial support & sponsorship: None.
Conflicts of Interest: None.
References
- Measurement of specific gravities of whole blood and plasma by standard copper sulfate solutions. J Biol Chem. 1950;183:305-30.
- [Google Scholar]
- Comparison of the accuracy of noninvasive hemoglobin sensor (NBM-200) and portable hemoglobinometer (HemoCue) with an automated hematology analyzer (LH500) in blood donor screening. Ann Lab Med. 2013;33:261-7.
- [Google Scholar]
- The impact of noninvasive, capillary, and venous hemoglobin screening on donor deferrals and the hemoglobin content of red blood cells concentrates: A prospective study. Transfusion. 2015;55:2847-54.
- [Google Scholar]
- The Drugs and Cosmetics Act 1940 and the Drugs and Cosmetics Rules 1945. Part XIIB. Ministry of Health & Family Welfare, Government of India 1945:268-88.
- [Google Scholar]
- 2007. Voluntary blood donation programme-an operational guideline. New Delhi: Ministry of Health & Family Welfare, Government of India; Available from: http://naco.gov.in/sites/default/files/voluntary%20blood%20donation.pdf
- The assignment of values to fresh blood used for calibrating automated blood cell counters. Clin Lab Haematol. 1988;10:203-12.
- [Google Scholar]
- Estimation of hemoglobin in blood donors: A comparative study using hemocue and cell counter. Transfus Apher Sci. 2010;43:155-7.
- [Google Scholar]
- Noninvasive methods for haemoglobin screening in prospective blood donors. Vox Sang. 2013;105:116-20.
- [Google Scholar]
- Accuracy of determining hemoglobin level using occlusion spectroscopy in patients with severe gastrointestinal bleeding. Anesthesiology. 2013;118:640-8.
- [Google Scholar]
- Evaluation of various methods of point-of-care testing of haemoglobin concentration in blood donors. Blood Transfus. 2015;13:233-9.
- [Google Scholar]
- Evaluation of a portable hemoglobin photometer in pregnant women in a high altitude area: A pilot study. BMC Public Health. 2009;9:228.
- [Google Scholar]
- Comparison of three noninvasive methods for hemoglobin screening of blood donors. Transfusion. 2015;55:379-87.
- [Google Scholar]
- Non-invasive measurement of hemoglobin: Assessment of two different point-of-care technologies. PLoS One. 2012;7:e30065.
- [Google Scholar]
- Study of newer invasive and non-invasive methods of haemoglobin estimation in blood donor screening – A study on 200 donors. IJCRR. 2014;6:26-30.
- [Google Scholar]
- Capillary versus venous haemoglobin determination in the assessment of healthy blood donors. Vox Sang. 2013;104:317-23.
- [Google Scholar]
- Evaluation of hemoglobin of blood donors deferred by the copper sulphate method for hemoglobin estimation. Transfus Apher Sci. 2007;36:143-8.
- [Google Scholar]
- Quality evaluation of four hemoglobin screening methods in a blood donor setting along with their comparative cost analysis in an Indian scenario. Asian J Transfus Sci. 2009;3:66-9.
- [Google Scholar]
- Reliability of capillary hemoglobin screening under routine conditions. Transfusion. 2011;51:2714-9.
- [Google Scholar]


