
Translate this page into:
Estimation of State and district-specific disability adjusted life years (DALYs) due to tuberculosis for Kerala, India, 2017-2020
For correspondence: Dr Zinia T. Nujum, School of Public Health, Kerala University of Health Sciences, Government Medical College, Thiruvanthapuram Campus-695 011, Kerala, India. e-mail: drzinia@gmail.com
-
Received: ,
Abstract
Background & objectives
Tuberculosis (TB) control programmes routinely use indicators like incidence and mortality. A single indicator, like disability-adjusted life years (DALYs) may yield a more comprehensive burden estimate. This study attempted to estimate the state and district-specific TB burden in Kerala.
Methods
The sole data source for these computations was the Ni-kshay, notification register for 2017 to 2020, Kerala. Age of the patient and outcome are available in the register. Notified incident TB/1000, the median age of onset of TB, case fatality due to TB, and the median age of mortality were computed using SPSS software. DALYs was calculated using the DALYs package of the R program, using these input parameters. Disability weight was taken as 0.333. The absolute and relative DALY/100,000 population was estimated along with the 95% confidence interval (CI).
Results
Relative DALYs was highest in 2019 at 1482/100,000 and lowest at 1124/100,000 in the year 2020 during the period 2017 to 2020. The districts, which had the highest incidence were not the same as those with the highest DALYs. Ernakulam and Thrissur districts had the highest burden and Idukki had the least burden.
Interpretation & conclusions
DALYs estimates for Kerala showed an increasing trend before 2020, which could be due to the increased efforts to detect TB as part of the elimination drive. The study points towards the need for using DALYs as a measure for prioritizing districts for resource allocation.
Keywords
Disability-adjusted life years
disease burden
India
Kerala
Ni-kshay
tuberculosis

Tuberculosis (TB) is an infectious disease predominantly caused by Mycobacterium tuberculosis. Eight countries accounted for two-thirds of the global total: India (27%), Indonesia (10%), China (7.1%), the Philippines (7%), Pakistan (5.7%), Nigeria (4.5%), Bangladesh (3.6%) and DR Congo (3%)1. India’s TB incidence for 2021 was estimated at 210 per 100,000 population1.
India also accounted for 36 per cent of the global TB-related deaths among human immunodeficiency virus (HIV)-negative people1. India’s TB prevalence of microbiologically confirmed TB among people more than 15 yr has been estimated at 316 per 100,000 population2.
The World Health Organization (WHO) targeted a reduction in the annual incidence of TB by four per cent between 2015 and 2020 and a reduction in annual mortality by seven per cent. However, globally the achievements have been only two and three per cent, respectively1,3. Between 1990 and 2019 age-standardized incidence and mortality rates of TB in India declined from 390 to 223 and from 121 to 36 per 100,000 population, respectively4.
India plans to end TB by 2025, five yr ahead of the Sustainable Development Goals (SGD) goal5.With the indicators of declining TB transmission like low Annual risk of TB infection (ARTI), low childhood TB, and some districts having low case notifications of around 250-500 cases/million, the State of Kerala also started elimination efforts. It is important to generate regional data on the trend in the burden of TB to see the pace at which we are progressing toward elimination.
TB control programmes routinely use indicators like incidence, prevalence, and mortality independently. Disability due to TB is generally not accounted for in the estimation of burden due to TB. Mental health disorders, respiratory impairment, musculoskeletal impairment, hearing impairment visual impairment, renal impairment, and neurological impairments are widely reported due to TB6. A single indicator, like disability-adjusted life years (DALYs) may yield a more comprehensive estimate of burden. It is a time-based measure that combines years of life lost due to premature mortality (YLLs) and years of life lost due to time lived in states of less than full health or years of healthy life lost due to disability (YLDs)7. Our prior experience with dengue shows the need for using a combined index for prioritizing resource allocation and action, since there may be differences in incidence and mortality across places, and those with high incidence may not be the same as those with high mortality. Prioritization of elimination efforts may be challenging if we look at different indices. The recent publication by Indian Council of Medical Research (ICMR) is an endeavour to generate DALYs specific to states for diseases8. However, it only mentions the state-specific DALYs due to lower respiratory infections. DALYs specific to TB for the States has not been looked at. As per author’s knowledge, no attempts have been made (to the best of our knowledge) to estimate district-specific DALYs for TB. Insights from health management information system (HMIS) data show huge inter-state and inter-district variations in indicators like the notification rate of TB9. So it is important to assess the burden at the State and district level from a policy perspective. We attempted to estimate the burden of TB for the State and the districts of Kerala using disability-adjusted life years (DALYs) from 2017 to 2020. It may be used to identify the districts that need to be prioritized for TB control/elimination efforts. The trends in DALYs across the years will also enable us to understand whether there are declining trends in disease burden.
This study was conducted to estimate the State and district-specific burden of TB in Kerala using DALYs from 2017 to 2020, understand the trends, and rank districts to prioritize action.
Material & Methods
The study was conducted at the department of Community Medicine, Government Medical College, Kollam, Kerala, after obtaining the ethical approval from the Institutional Ethics Commitee.
Study area
Kerala is a small State with an area of 38, 863 sq. km. and a population of 33.38 million. With 14 districts, 152 blocks, and 1364 villages, the State has a higher population density compared to the entire country.
Source of data
The secondary data required was obtained from Ni-kshay. Age, gender, and outcome of TB patients stratified by district were obtained from the TB notification registers for 2017 to 2020. Ni-kshay is a real-time case-based digital management information system of the National TB Elimination Programme. The system has been developed jointly by the Central TB Division of the Ministry of Health and Family Welfare and the National Informatics Centre (NIC) and the Government of India launched it in June 201210. Data from the 14 districts and Kerala State were obtained from the State TB Office for the years 2017 to 2020.
Parameters
Input parameters namely notified incident TB/1000, the median age of onset of TB, case fatality due to TB, and the median age of mortality were computed from the data obtained from Ni-kshay, notification register for the corresponding years using Statistical Package for Social Sciences (SPSS) (IBM Corp., NY, USA) software. Incident TB notification rate and mortality rates were calculated using the corresponding year population as the denominator. The projected population of the corresponding year of Kerala was taken from the census 2011 website. The age structure of 2011 was applied to this to set the population structure in R Program. Life expectancy of the Kerala population11 was substituted for the standard Global Burden of Disease (GBD 2010) life expectancy in the software. The 2011 percentages of the population of districts were applied to the projected population of Kerala for the years 2017 to 2020 to obtain the population of districts. Age structures also were obtained similarly using the percentages in each age-sex group in 2011.
Calculation of DALYs and assumptions for calculation of DALYs
DALYs was calculated using the DALYs package of R program12,13. The surveillance system gap was found to be very minimal in Kerala, with nearly all diagnosed TB cases getting notified in the Ni-kshay. It is assumed that incident TB notification is a proxy of TB Incidence.
The proportion of TB patients treated was taken as 100 per cent, so this could be the lowest estimate of DALYs. Duration of treatment was taken as six months (6/12 -0.5 yr).
Disability weight was taken from GBD 2019 as 0.33314,15, which was the most frequently used value. Age weighting was given and the discount rate was taken as three per cent. Absolute and relative DALY/100,000 population was estimated along with the 95% Confidence Interval (CI).
Results
There was an increase in the relative DALYs in Kerala from 2017 to 2019. The DALYs due to TB in Kerala was lowest at 1124 in 2020 and highest at 1482 in 2019 during the period 2017 to 2020 (Table I). The contribution of years lived due to the disability was 96-98 percent of the total DALYs (Table I and Fig. 1).
| Year | 2017 | 2018 | 2019 | 2020 |
|---|---|---|---|---|
| Population (n) | 34867000 | 35049000 | 35231000 | 35413000 |
| TB cases (n) | 23149 | 24689 | 25617 | 20837 |
| Incidence/1000 population | 0.6639 | 0.70441 | 0.7271 | 0.5884 |
| Deaths (n) | 813 | 1218 | 1965 | 1426 |
| Median age of onset (yr) | 48 | 48 | 47 | 50 |
| Mortality rate/1000 population | 0.023317 | 0.03475 | 0.05577 | 0.04027 |
| Median age of mortality (yr) | 62 | 63 | 60.3 | 63 |
| Absolute DALYs (95%CI) |
452327 (447184-457529) |
485387 (480072-490686) |
522203 (515482-528931) |
398053 (392897-403096) |
| %YLD | 98 | 98 | 96 | 97 |
| %YLL | 2 | 2 | 4 | 3 |
| Relative DALY/100,000 | 1297 | 1385 | 1482 | 1124 |
YLD, years lived with disability; YLL, years of life lost due to premature mortality; DALYs, disability-adjusted life years; CI, confidence intervals; TB, tuberculosis
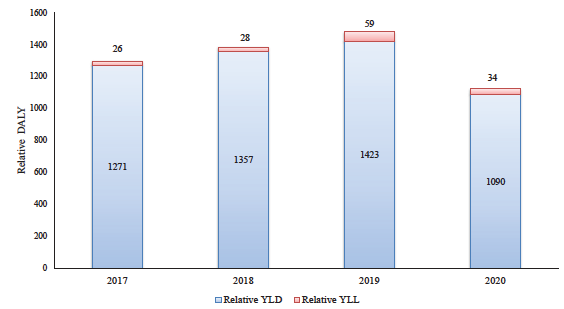
- Years of life lived with disability (YLD), Years of life (YLL) lost due to Tuberculosis in Kerala from 2017 to 2020. DALYs, disability-adjusted life years.
Among the districts, Thrissur, Kollam, Kasaragod, and Idukki showed a steady decline in DALYs from 2017 to 2019. Idukki had the least DALYs since 2018 consistently. Thiruvananthapuram, Kozhikode, Kannur, and Kottayam showed an increase in DALYs from 2017 to 2019. Kottayam, a district that had the least DALYs in 2017 has become the district with the highest DALYs in 2020 (Table II).
| District | Year | DALYs | 95% CI | RD | DALYs rank |
|---|---|---|---|---|---|
| Thrissur | 2017 | 68962 | 66884-71066 | 2123.12 | 1 |
| 2018 | 56905 | 54975-58849 | 1742.83 | 4 | |
| 2019 | 55433 | 53544-57335 | 1688.98 | 6 | |
| 2020 | 43036 | 41404-44708 | 1304.51 | 4 | |
| Wayanad | 2017 | 14140 | 13059-15198 | 1658.18 | 2 |
| 2018 | 16315 | 15178-17466 | 1903.32 | 1 | |
| 2019 | 12977 | 12011-13931 | 1506.08 | 8 | |
| 2020 | 10351 | 9433-11269 | 1195.14 | 7 | |
| Ernakulam | 2017 | 54813 | 52949-56655 | 1600.29 | 3 |
| 2018 | 51510 | 49652-53381 | 1496.05 | 8 | |
| 2019 | 65668 | 63686-67676 | 1897.4 | 1 | |
| 2020 | 50479 | 48692-52234 | 1451.03 | 3 | |
| Kollam | 2017 | 43888 | 42213-45570 | 1598.12 | 4 |
| 2018 | 38054 | 36476-39638 | 1378.49 | 9 | |
| 2019 | 32257 | 30784-33736 | 1162.46 | 11 | |
| 2020 | 25433 | 23770-27096 | 911.83 | 10 | |
| Kasaragod | 2017 | 18959 | 17824-20107 | 1393.72 | 5 |
| 2018 | 16142 | 15083-17212 | 1180.48 | 10 | |
| 2019 | 14161 | 13149-15178 | 1030.25 | 13 | |
| 2020 | 10587 | 9733-11456 | 766.27 | 12 | |
| Palakkad | 2017 | 40126 | 39064-42388 | 1366.95 | 6 |
| 2018 | 51667 | 49431-53959 | 1750.97 | 3 | |
| 2019 | 41656 | 39997-43344 | 1404.41 | 9 | |
| 2020 | 28578 | 27212-29959 | 959.56 | 9 | |
| Thiruvananthapuram | 2017 | 46148 | 44388-47922 | 1336.14 | 7 |
| 2018 | 55712 | 53826-57564 | 1604.68 | 6 | |
| 2019 | 63633 | 61651-65616 | 1823.36 | 3 | |
| 2020 | 42613 | 41012-44208 | 1214.77 | 6 | |
| Kozhikode | 2017 | 39681 | 38051-41341 | 1229.87 | 8 |
| 2018 | 52153 | 50292-54007 | 1608.04 | 5 | |
| 2019 | 59200 | 57216-61183 | 1815.89 | 4 | |
| 2020 | 53782 | 51914-55662 | 1641.21 | 2 | |
| Idukki | 2017 | 12498 | 11576-13422 | 1080.65 | 9 |
| 2018 | 10219 | 9384-11052 | 879.01 | 14 | |
| 2019 | 7663 | 6962-8372 | 655.74 | 14 | |
| 2020 | 6661 | 6003-7321 | 567.07 | 14 | |
| Alappuzha | 2017 | 23132 | 22756-23508 | 1043.88 | 10 |
| 2018 | 20363 | 19268-21446 | 914.15 | 13 | |
| 2019 | 33749 | 22535-24969 | 1507.26 | 7 | |
| 2020 | 16108 | 15361-168847 | 715.7 | 13 | |
| Kannur | 2017 | 25841 | 23710-27965 | 979.73 | 11 |
| 2018 | 30874 | 29348-32345 | 1164.48 | 11 | |
| 2019 | 35880 | 34289-37448 | 1346.3 | 10 | |
| 2020 | 32729 | 31211-34225 | 1221.75 | 5 | |
| Kottayam | 2017 | 19566 | 18413-20703 | 946.55 | 12 |
| 2018 | 36426 | 34873-37956 | 1753.04 | 2 | |
| 2019 | 38148 | 36570-39709 | 1826.43 | 2 | |
| 2020 | 35210 | 33795-36609 | 1677.1 | 1 | |
| Malappuram | 2017 | 32864 | 31339-34428 | 765.5 | 13 |
| 2018 | 45627 | 43787-47500 | 1057.28 | 12 | |
| 2019 | 45953 | 44150-47750 | 1059.33 | 12 | |
| 2020 | 33825 | 32268-35377 | 775.74 | 11 | |
| Pathanamthitta | 2017 | 9343 | 8531-10139 | 748.33 | 14 |
| 2018 | 19271 | 18158-20384 | 1535.51 | 7 | |
| 2019 | 21604 | 20418-22820 | 1712.51 | 5 | |
| 2020 | 15020 | 14028-15998 | 1184.48 | 8 |
RD, relative DALYs
The districts with the highest reported cases were not the same as those with the highest DALYs. During 2017, the highest notification of incident TB was seen in Thrissur, followed by Ernakulam and Kollam. However, Wayanad and Ernakulam had the highest burden in terms of relative DALYs after Thrissur. Kollam also recorded the highest TB death rate in 2017 but it had only the fourth-highest DALYs (Fig. 2 and Supplementary Tables I–IV).

- Burden of TB in different districts of Kerala over the years; (A) 2017, (B) 2018, (C) 2019 and (D) 2020. I/incidence, incident TB notification; M/mortality, reported TB mortality rate; RD, relative DALYs.
In 2018, Wayanad in terms of incident TB notification ranked only seven, but it ranked first in mortality. The median age of onset was 35 yr, which was much lower than other districts. The median age of mortality was 54 yr, which was also lower than other districts. Hence in terms of DALYs ranking, Wayanad has the highest burden compared to other districts. A similar phenomenon was seen in 2019 and 2020 also.
To make a conclusion on the burden of TB in districts, the DALYs ranks for the years 2017 to 2020 were added and the effective DALYs rank was calculated. The district with the lowest sum would be the one with the highest burden considering all these years. Ernakulam and Thrissur districts had the highest burden and ranked first; Idukki had the least burden (Table III). The relative DALY/lakh population in the district across these years is shown in a choropleth map (Supplementary Figure).
| District | 2017 | 2018 | 2019 | 2020 | Sum of ranks | Effective DALYs rank |
|---|---|---|---|---|---|---|
| Ernakulam | 3 | 8 | 1 | 3 | 15 | 1 |
| Thrissur | 1 | 4 | 6 | 4 | 15 | 1 |
| Kottayam | 12 | 2 | 2 | 1 | 17 | 2 |
| Wayanad | 2 | 1 | 8 | 7 | 18 | 3 |
| Kozhikode | 8 | 5 | 4 | 2 | 19 | 4 |
| Thiruvananthapuram | 7 | 6 | 3 | 6 | 22 | 5 |
| Palakkad | 6 | 3 | 9 | 9 | 27 | 6 |
| Pathanamthitta | 13 | 7 | 5 | 8 | 33 | 7 |
| Kollam | 4 | 9 | 11 | 10 | 34 | 8 |
| Kannur | 11 | 11 | 10 | 5 | 37 | 9 |
| Kasaragod | 5 | 10 | 13 | 12 | 40 | 10 |
| Alappuzha | 10 | 13 | 7 | 13 | 43 | 11 |
| Malappuram | 14 | 12 | 12 | 11 | 49 | 12 |
| Idukki | 9 | 14 | 14 | 14 | 51 | 13 |
Discussion
DALYs estimates for TB have increased from 2017 to 2019. This could be due to an increase in case finding and closing the gap in the surveillance system through active efforts at TB detection in the State in the context of TB elimination, which started in 2017. In 2020 DALYs is seen to be lower than that in other years. This could be due to the influence of the COVID pandemic in TB-related activities. COVID has adversely affected our march towards TB elimination. There is a reported five per cent annual shortfall in case notifications in 2020 compared with 20191. But it is also noted that the TB case fatality has increased slightly from 2017 to 2019 in Kerala. Other studies show that mortality and incidence of TB decreased across all age groups for both males and females over the period 1990–20194. It could be because of the efforts in capturing all TB cases including deaths and also because TB has mostly affected the elderly community and the risk of mortality is higher in this age group.
The total DALYs in India in 2016 was 1316 million and the contribution of TB was 3.2 per cent, which is 3166/100,000. It declined compared to 1990 when the total DALY was 8640 million and the contribution of TB was five per cent (relative DALYs 4948/100,000)8. The maximum relative DALYs due to TB in Kerala from 2017 to 2020 is 1482/100,000. This is only half the burden compared to Indian figures (1482/3166). According to estimates from the GBD studies, TB contributed to 6.5 per cent of the total DALYs due to communicable diseases in all ages, and this increased to 17 per cent of DALYs in the population aged 65 yr or older in 201716.
In the GBD studies, TB-related burden in Korea from 2014 to 2017 was estimated to be 111, 107, 104, and 105 DALYs/100,000 populations, respectively17. Compared to this the burden due to TB in Kerala is 10 times higher. In Korea, the DALYs clearly showed a declining trend17. In our study, the DALY from 2017 to 2019 showed an increasing trend. There is clear evidence that there has been an increasing notification in India since 2017-2018, which indicates the efforts put in the TB programme8. DALYs sin our study is calculated based on officially reported cases. We acknowledge this as a major limitation of the study. There could be cases that are undiagnosed or not reported to the programme. However, such proportions might be very minimal in Kerala18,19.
In Korea from 2014 to 2017, the DALYs calculated for drug-sensitive TB was 56, 49, 46, and 40, respectively, and DALYs per 100,000 people with MDR-TB were three, two, two and two, respectively20. We have not calculated DALY separately for drug-sensitive and drug-resistant TB. Researchers have also attempted to model DALY for future years, which was not done in this study17. TB-related DALYs are greatly underestimated by overlooking post-TB disability21. The disability weights used in this study also have not incorporated post-TB sequel. However, as per author’s knowledge this is the first attempt to generate the State and district-specific TB DALYs.
There is a need for capacity building for DALYs estimation so that programme officials have the information and can interpret them. The estimation of DALYs due to TB provides an alternative and more accurate approach for programme implementers and policymakers to understand TB burden, compare across administrative units, and monitor its trends while reviewing programme performance and progress towards targets. The global monitoring indicators for TB can also be carved better uniformly in this direction. More studies using DALYs are required to find the burden of drug-sensitive and drug-resistant TB, incorporating the weights for post-TB sequel and modelling for future predictions.
We have not attempted to classify the burden by type of TB, type of disabilities and age-specific DALYs, which are areas for future research. Limitations of DALYs estimates in general, like the subjectivity of disability weights, more value given to life at younger ages, lack of consideration of the severity of disease, and reliance of estimates on the quality of data source, also apply to this study22,23.
Overall, DALYs estimates calculated based on official surveillance system data for Kerala show an increasing trend before 2020, which could be due to the increased efforts to detect TB as part of the elimination drive. In 2020, the burden is found to be lower and it could be because of COVID. However, the burden due to TB in the state is much lesser compared to India. The districts that reported higher rates of cases were not the same as those found to have higher DALYs. The use of DALYs gives a more comprehensive assessment of the burden of TB, which is different from the assessment using incidence and mortality alone. Prioritization of districts for resource allocation may be done more accurately by using DALYs. It may also be considered in the Government of India’s sub-national certification of TB-free status for districts and states.
Financial support & sponsorship
This project was funded by the NTEP, South Zone II Operational Research, India.
Conflicts of Interest
None.
Use of Artificial Intelligence (AI)-Assisted Technology for manuscript preparation
The authors confirm that no AI-assisted technology was used to assist in the writing of the manuscript, and no images were manipulated using AI.
References
- Global Tuberculosis report 2023. Geneva: World Health Organization; Available from : https://iris.who.int/bitstream/handle/10665/373828/ 9789240083851-eng.pdf?sequence=1, accessed on August 9, 2024.
- National TB Prevalence Survey in India (2019-2021). Available from: https://tbcindia.gov.in/showfile.php?lid=3659, accessed on April16, 2024.
- Global tuberculosis report 2020 - reflections on the global TB burden, treatment and prevention efforts. Int J Infect Dis. 2021;113:S7-12.
- [Google Scholar]
- Trends in incidence and mortality of tuberculosis in India over past three decades: a joinpoint and age–period–cohort analysis. BMC Pulm Med. 2021;21:375.
- [Google Scholar]
- National Strategic Plan for TB Elimination (2017-2025). Government of India. Available from: https://tbcindia.gov.in/WriteReadData/NSP%20Draft%2020.02.2017 %201.pdf, accessed on January 10, 2023.
- Tuberculosis related disability: A systematic review and meta-analysis. BMC Med. 2021;19:203.
- [Google Scholar]
- WHO methods and data sources for global burden of disease estimates 2000-2019. Available from: https://cdn.who.int/media/docs/default-source/gho-documents/global-health-estimates/ghe2019_daly-methods.pdf?sfvrsn=31b25009_7, accessed on November 29, 2022.
- India: Health of the Nation’s States-The India State-Level Disease Burden Initiative. New Delhi: ICMR, PHFI, and IHME; 2017.
- Trends and sub-national disparities in TB notifications in India: Insights from HMIS data. Indian J Tuberc. 2022;69:141-50.
- [Google Scholar]
- Ministry of Home Affairs, Government of India. Census Digital Library and Sample Registration System Publications. Available from: http://censusindia.gov.in/2011-common/censusdataonline.html, accessed on June 15, 2017.
- Ministry of Home Affairs, Government of India. SAMPLE REGISTRATION SYSTEM (SRS)-ABRIDGED LIFE TABLES 2014-2018. Available from: https://new.census.gov. in/nada/index.php/catalog/42517, accessed on January 1, 2024.
- ‘NIKSHAY’ – harnessing Information technology for delivery of enhanced TB care. Available from: https://ntiindia.kar.nic.in/ ntibulletin/NTI%20BULLETIN%202006-2011/NTI%20Bulletin %2048_1_4_2012/NTI%20Bulletin%20-%20Vol%2048_files/PDF/4.%20NIKSHAY.pdf, accessed on November 29, 2022
- DALY: The DALY Calculator - Graphical User Interface for Probabilistic DALY calculation in R. R package version 1.5.0. Available from: https://cran.r-project.org/package=DALY, accessed on April 28, 2024.
- Lifetime burden of disease due to incident tuberculosis: A global reappraisal including post-tuberculosis sequelae. Lancet Glob Health. 2021;9:e1679-e1687.
- [Google Scholar]
- Institute for Health Metrics and Evaluation; Seattle, USA: 2020. Global Burden of Disease Study 2019 (GBD 2019) Disability Weights. Available from: http://ghdx.healthdata.org/record/ihme-data/gbd-2019-disability-weights, accessed on April 28, 2024.
- Global, regional, and national disability-adjusted life-years (DALYs) for 359 diseases and injuries and healthy life expectancy (HALE) for 195 countries and territories, 1990–2017: A systematic analysis for the Global Burden of Disease Study 2017. Lancet. 2018;392:1859-922.
- [Google Scholar]
- Estimating Disability-Adjusted Life Years due to Tuberculosis in Korea through to the Year 2040. Int J Environ Res Public Health. 2020;17:5960.
- [Google Scholar]
- Moving towards TB elimination: A call for action. Presentation at: Kerala Health Conference: Making the SDG a Reality. February 17-March 4, 2021; Thiruvananthapuram, Kerala. Available from: https://www.youtube.com/watch?v=C4Yr_FTMdgQ&t=3452s, accessed on October 1, 2022.
- Subnational TB claims verification group. Estimation of tuberculosis incidence at the subnational level using three methods to monitor progress towards ending TB in India, 2015-2020. BMJ Open. 2022;12:e060197.
- [Google Scholar]
- Comparison of disability-adjusted life years (DALYs) and economic burden on people with drug-susceptible tuberculosis and multidrug-resistant tuberculosis in Korea. Front Public Health. 2022;10:848370.
- [Google Scholar]
- TB morbidity estimates overlook the contribution of post-TB disability: Evidence from urban Malawi. BMJ Glob Health. 2022;7:e007643.
- [Google Scholar]
- The global burden of disease: A comprehensive assessment of mortality and disability from diseases, injuries, and risk factors in 1990 and projected to 2020. Available from : https://iris.who.int/bitstream/handle/10665/41864/0965546608_eng.pdf?sequence=1&isAllowed=y, accessed on August 9, 2024.
- Common values in assessing health outcomes from disease and injury: Disability weights measurement study for the global burden of disease study 2010. Lancet. 2012;380:2129-43.
- [Google Scholar]


