
Translate this page into:
Different gene expression profiles in subcutaneous & visceral adipose tissues from Mexican patients with obesity
For correspondence: Dr Noemí Cárdenas-Rodríguez, Laboratory of Neurosciences, National Institute of Pediatrics, 04530 Mexico City, Mexico e-mail: noemicr2001@yahoo.com.mx
-
Received: ,
This is an open access journal, and articles are distributed under the terms of the Creative Commons Attribution-NonCommercial-ShareAlike 4.0 License, which allows others to remix, tweak, and build upon the work non-commercially, as long as appropriate credit is given and the new creations are licensed under the identical terms.
This article was originally published by Wolters Kluwer - Medknow and was migrated to Scientific Scholar after the change of Publisher.
Abstract
Background & objectives:
Obesity is a health problem that requires substantial efforts to understand the physiopathology of its various types and to determine therapeutic strategies for its treatment. The objective of this study was to characterize differences in the global gene expression profiles of subcutaneous adipose tissue (SAT) and visceral adipose tissue (VAT) between control patients (normal weight) and patients with obesity (IMC≥30) using microarrays.
Methods:
Employing RNA isolated from SAT and VAT samples obtained from eight control and eight class I, II and III patients with obesity, the gene expression profiles were compared between SAT and VAT using microarrays and the findings were validated via real-time quantitative polymerase chain reaction.
Results:
A total of 327 and 488 genes were found to be differentially expressed in SAT and VAT, respectively (P≤0.05). Upregulation of PPAP2C, CYP4A11 and CYP17A1 genes was seen in the VAT of obese individuals.
Interpretation & conclusions:
SAT and VAT exhibited significant differences in terms of the expression of specific genes. These genes might be related to obesity. These findings may be used to improve the clinical diagnosis of obesity and could be a tool leading to the proposal of new therapeutic strategies for the treatment of obesity.
Keywords
Adipose tissue
gene expression
obesity
subcutaneous adipose tissue
visceral adipose tissue

The World Health Organization (WHO) has referred to obesity as a ‘global epidemic’ due to its increasing prevalence1. According to the 2012 National Health and Nutrition Survey2 of the Mexican population, the prevalence of being overweight or obese was 71.2 per cent in adults over the age of 20 yr and 34.4 per cent in children. The economic impact of treating this disease is of considerable concern, due to the increase in associated co-morbidities and mortality2. Adipose tissue is now recognized as an important tissue not only for energy storage but also due to its important endocrine functions, including the secretion of many factors, such as adipocytokines and adipokines3. Subcutaneous adipose tissue (SAT) and visceral adipose tissue (VAT) are the two main types of adipose tissue in adult humans. Numerous clinical studies45 have demonstrated that important differences exist with respect to endocrine production in different types of adipose tissue. The observation that the metabolism and secretion of lipids vary at different sites between SAT and VAT suggests site-specific functions45. It has been demonstrated that VAT exhibits a more pro-inflammatory and metabolically harmful profile than SAT6. VAT differs both morphologically and functionally from SAT, including via the variation in the function of insulin in the regulation of lipolysis.
Passaro et al7 evaluated gene expression through microarray analysis in gluteal and abdominal SAT in eight healthy controls identifying expression differences in several HOX genes between gluteal and abdominal depots. Gerhard et al8 determined the gene expression profiles of SAT and VAT in six patients with extreme obesity using microarrays. The authors identified differential expression in many genes related to DNA replication and repair, cell morphology and development8. Lee et al9 identified differential gene expression profile in subcutaneous abdominal fat biopsies from 19 obese individuals through microarray analysis. The upregulated and downregulated genes were classified as being associated with the following terms: inflammation and immune response, signalling, transcription regulation, cell cycle control, cell adhesion, transport carrier, structural protein/cytoskeleton organization, energy metabolism, response to stress, cell growth and apoptosis pathways9. Linder et al10 examined differential gene expression between seven obese males and 11 obese females through representational difference analysis of cDNA from SAT and VAT. The results revealed a sex-specific pattern of gene expression in pathways related to the immune response, lipid metabolism, protein biosynthesis, signal transduction, cell structure, carbohydrate and amino acid metabolism, mitochondrial genes and other genes with unknown functions10.
Because there is no specific evidence that genes or groups of genes show alterations and are involved in the development of this disease, and further considering the lack of any sufficiently advanced molecular biological studies on the specific functions and physiological roles of SAT and VAT or their differences in human obesity, this study was designed to examine the transcriptomes of SAT and VAT samples from obese patients and normal weight individuals with the aim of contributing to the current understanding of pathophysiology of obesity.
Material & Methods
The study protocol was approved by the Ethics Committee of the Military Central Hospital, Mexico City, Mexico (No. DINV-78798). The study was explained to all individuals before obtaining their written informed consent. Adult individuals of both sexes were classified as obese or lean according to their body mass index (BMI) following the WHO criteria1 (BMI of ≥30 or <24.9 kg/m2, respectively) and were recruited during the period from September 2015 to February 2017. The samples were obtained during inguinal hernia repair and laparoscopic cholecystectomy, performed in the department of Surgery at the Military Central Hospital, Mexico City, Mexico. The following inclusion criteria were applied: voluntary patients with age of 18-50 yr and absence of chronic diseases, including cancer, HIV infection and thyroid disorders. The exclusion criteria included pregnancy or treatment with drugs that may alter metabolism and compromise body weight. Briefly, after the administration of general anaesthesia, incisions (1/4″ to 1/2″) were made (one near the navel and the others lower on the abdomen). A laparoscope was inserted through one of the openings, and SAT samples were obtained. A mesh was positioned at the hernia and fastened in place with sutures. Finally, the instrument was removed, and the holes were closed with surgical tape. In the laparoscopic gallbladder removal procedure, briefly, several small incisions (<1″ long) were made (rather than one large longitudinal incision at the inferior aspect of the umbilicus), and the laparoscope was inserted and subsequently advanced through the subcutaneous fat (taking a sample) to the anterior rectus sheath. The dissection and extraction of the gallbladder were realized, and the incisions were closed.
Two different groups of patients with available electronic health records were included in these experiments: (i) a group of 16 patients (8 non-diabetic normal weight individuals and 8 patients with obesity) were used for the microarray experiments, and (ii) a confirmation group of 72 patients (35 non-diabetic normal weight individuals and 37 obese individuals, including the 16 patients in the microarray experiment) were used for validation of genes identified in the microarray analysis via real-time polymerase chain reaction (qPCR).
The range of BMI among the 35 individuals classified as non-diabetic normal weight was 18.5-24.9 kg/m2. The range of the BMI of the 37 obese individuals was 30-34.9 kg/m2, 12 of whom exhibited class II obesity (BMI=35-39.9 kg/m2), while six exhibited class III obesity (BMI≥40 kg/m2). The anthropometric and biochemical characteristics of the 16 individuals included in the microarray experiment group are summarized in Table I.
| Parameters | Normal weight (n=8) (6 females, 2 males) | Obese (n=8) [Grade I (n=6), Grade II (n=2)] All females |
|---|---|---|
| Age (yr) | 35.63±9.30 | 41.13±8.59 |
| Weight (kg) | 63.19±5.90 | 78.31±8.22* |
| BMI (kg/m2) | 23.52±1.34 | 33.03±3.15* |
| Glucose (mg/dl) | 118.88±21.34 | 126.57±39.29 |
| Cholesterol (mg/dl) | 166.75±22.29 | 169.943±22.29 |
| Triglycerides (mg/dl) | 157.25±37.67 | 160.71±21.53 |
| HDL (mg/dl) | 35.39±6.06 | 35.88±2.13 |
| LDL (mg/dl) | 124.37±22.38 | 128.78±20.80 |
| Creatinine (mg/dl) | 0.81±0.14 | 0.80±0.06 |
| Urea (mg/dl) | 26.63±9.55 | 21.50±3.21 |
| Uric acid (mg/dl) | 6.04±1.11 | 6.98±0.66 |
***P=0.001, compared to controls. HDL, high-density lipoprotein; LDL, low-density lipoprotein; BMI, body mass index
SAT and VAT samples were obtained from each patient. Isolation of total RNA was performed using the RNeasy Lipid Tissue Mini Kit (Qiagen, Hilden, Germany). RNA quality and integrity were assessed using QIAxcel and QIAxpert equipment (Qiagen).
For the microarray analysis, the synthesis of cDNA and subsequent fluorescent labelling of cRNA were performed with eight replicates in both the control (n=8) and obesity (n=8) groups, according to the manufacturer's protocol (Two-Color Microarray-Based Gene Expression Analysis/Low Input Quick Amp Labeling; Agilent Technologies, CA, USA)11. The arrays were scanned using a NimbleGen microarray scanner (Roche, Switzerland), and signal intensities in TIFF images were calculated using Feature Extraction software (FE, version 12.0; Agilent). All of the arrays were scanned and quantified using Imagen Feature Extraction software (www.agilent.com/en/product/mirna-microarray-platform/mirna-microarray-software/feature-extraction-softwar e-228496), and the associated biological pathways were determined with GeneSpring GX 13.0 software (Agilent). The data were deposited in the Gene Expression Omnibus (GEO accession no. GSE84599). Differentially expressed genes were selected using the filtering criteria of a change in expression of at least 2.0 fold and P≤0.05. The Benjamini-Hochberg12 algorithm was employed to compute false discovery rates.
For microarray confirmation, reverse transcription for qPCR was performed according to the manufacturer's protocol using a One-Step qPCR assay (One-Step qRT-PCR KAPA SYBR FAST® Kit, Kapa Biosystems, Merck, Darmstadt, Germany) and Rotor-Gene Q equipment (Qiagen) with primers specific to genes of interest (synthesized by Integrated DNA Technologies, Iowa, USA) (Table II). Relative gene expression levels were calculated using the 2-ΔΔCT relative quantification method13.
| Gene name | Gene symbol | Accession number | Primer sequence | Product length (bp) |
|---|---|---|---|---|
| Adiponectin | ADPN | NC_000003.12 | F 5’- CATCTCCTCCTCACTTCCATTC - 3’ R 5’ - GGCAGAGCTAATAGCAGTAGAACAG - 3’ |
158 |
| Mevalonate diphosphate decarboxylase | MVD | NC_000016.10 | F 5’- CGCCCATCTCTTACCTCAATG - 3’ R 5’ - ACACAGCAGCCACAAACTCAG - 3’ |
165 |
| Peroxisome proliferator- activated receptor gamma | PPARG | NC_000003.12 | F 5’- GCTGTCATTATTCTCAGTGGAGAC - 3’ R 5’ - GTCTGAGGTCTGTCATTTTCTGG - 3’ |
166 |
| Cytochrome P450 family 17, subfamily A, member 1 | CYP17A1 | NC_000010.11 | F 5’- CGATCAGAAGCTGGAGAAGATC - 3’ R 5’ - CCCCATTCTTGTAGGAGGTATT G - 3’ |
161 |
| Cytochrome P450 family 4, subfamily A, member 11 | CYP4A11 | NC_000001.11 | F 5’- TCCCATGGTTCCTACAGATTC - 3’ R 5’ - TCCAGCATCACTCGTACAGAG - 3’ |
167 |
| Cytochrome P450 family 1, subfamily B, member 1 | CYP1B1 | NC_000002.12 | F 5’- CTAGGCAAAGGTCCCAGTTC - 3’ R 5’ - CACCGACAGGAGTAGCAGG - 3’ |
158 |
| Patatin-like phospholipase domain-containing 3 | PNPLA3 | NC_000022.11 | F 5’ - TCATCTCCGGCAAAATAGGC - 3’ R 5’ - TGAAGGAAGGAGGGATAAGGC - 3’ |
153 |
| Acyl-CoA synthetase long-chain family member 3 | ACSL3 | NC_000002.12 | F 5’- CAGCTGTAACATTTGCCACC - 3’ R 5’ - GGTAGATGGTTTTGAAGACACG - 3’ |
147 |
| Succinate-CoA ligase alpha subunit | SUCLG1 | NC_000002.12 | F 5’ - GTACGAGTCAAGCACAAACTGC - 3’ R 5’ - GATCTGGACACAATGCCAATC - 3’ |
149 |
| Isocitrate dehydrogenase [NADP(+)] 2, mitochondrial | IDH2 | NC_000015.10 | F 5’- GTGGAGATGGATGGTGATGAG - 3’ R 5’ - CCAGTGCAGAGTCAATGGTG - 3’ |
157 |
| Glycerol-3-phosphate acyltransferase, mitochondrial | GPAM | NC_000010.11 | F 5’- AGAAATGGTTGCCACTGTCTC - 3’ R 5’ - TGAACTGGTAGAAACAGAAGCG - 3’ |
165 |
| Phospholipid phosphatase 2 | PLPP2 | NC_000019.10 | F 5’- ATTTTACTGCGGGGATGACTC - 3’ R 5’ - AAGTCCGAGCGAGAATAGAGC - 3’ |
159 |
| Beta-2-microglobulin | B2M | NC_000015.10 | F 5’ - CAACTTCAATGTCGGATGGATG - 3’ R 5’ - TCGCGCTACTCTTCTCTTTCTGG - 3’ |
152 |
| Actin, beta | ACTB | NC_000007.14 | F 5’ - CTGGCACCCAGCACAATG - 3’ R 5’ - GGGCCGGACTCGTCATAC - 3’ |
152 |
| Glyceraldehyde-3-phosphate dehydrogenase | GAPDH | NC_000012.12 | F 5’ - GAGCCAAAAGGGTCATCATCTC - 3’ R 5’ - CCTTCCACGATACCAAAGTTGTC - 3’ |
152 |
Statistical analysis: All statistical analyses were performed using commercially available GraphPad Prism version 6.0 (La Jolla, CA, USA) software and XLSTAT for Excel 2018 (Addinsoft, NY, USA). The data are expressed as the mean±SD. The Kolmogorov-Smirnov normality test was performed based on the null hypothesis that the distribution was normal. Differences between groups were tested using the unpaired Student's t test and ANOVA with Bonferroni post hoc analysis, and a correlation analysis was performed using the Pearson test.
Results
Gene expression levels in the SAT and VAT samples were analyzed using microarrays, as shown in Fig. 1. Two independent microarray analyses were performed employing Agilent arrays; the first was used to examine gene expression in SAT samples from 16 volunteers, divided into two groups: a control group (n=8) and a group with obesity (n=8); the second was employed to assess gene expression in VAT samples from the same groups. Microarray analysis demonstrated significant changes in the tissue transcriptomes, as shown in Tables III and IV. The analysis revealed decreased expression of 327 genes and increased expression of 488 genes in subcutaneous compared with those in visceral adipose tissue (P≤0.05). A ‘volcano plot’ showing the differential expression of all transcripts tested between VAT and SAT is provided in Fig. 2.
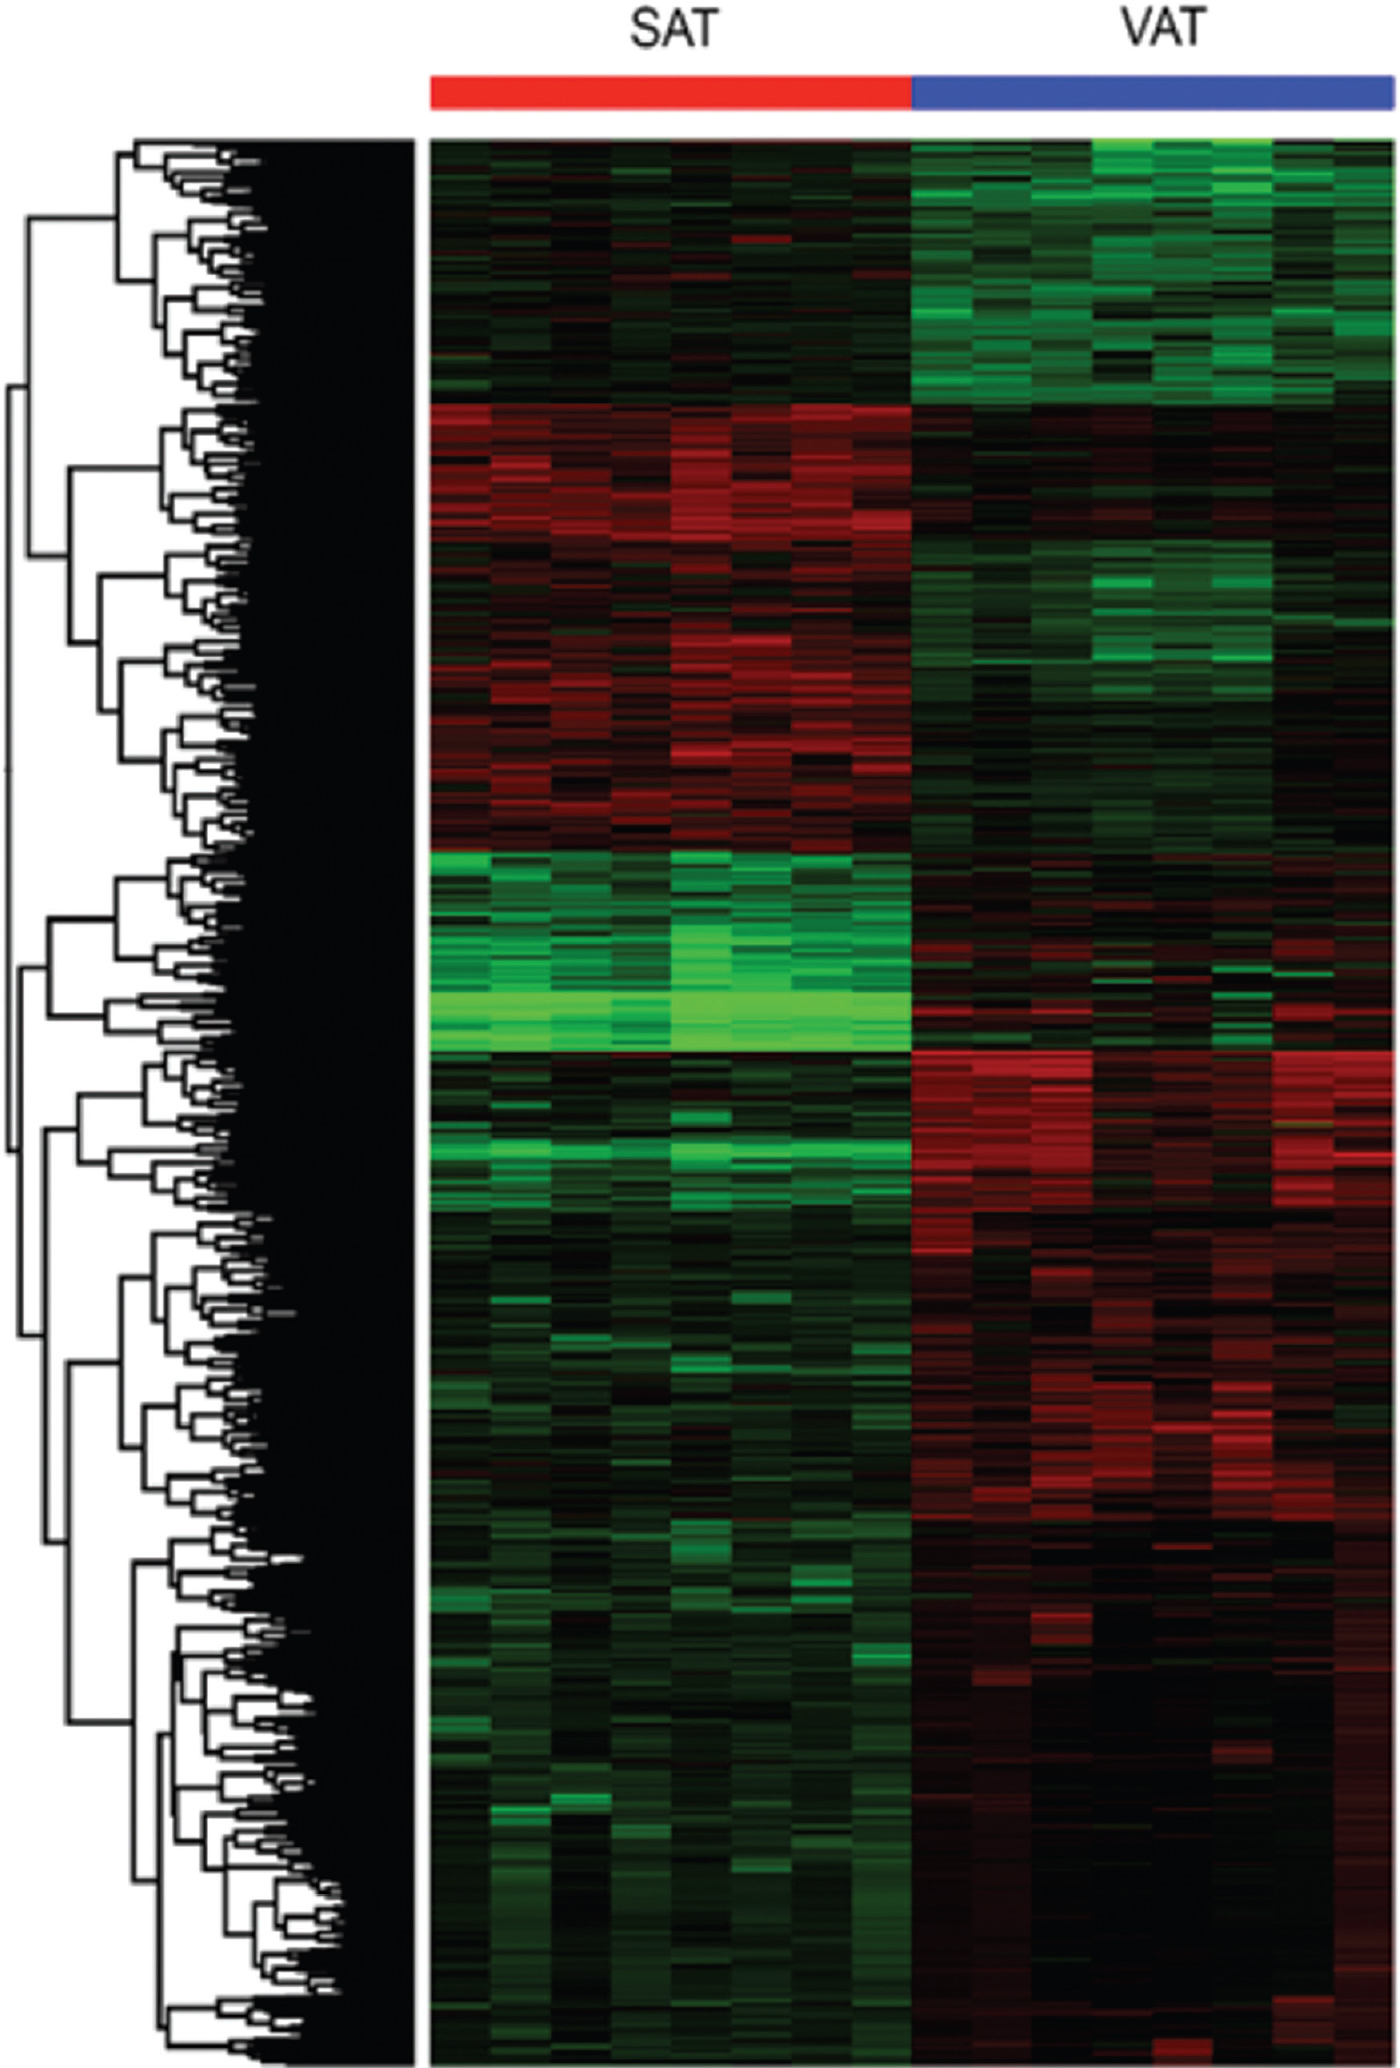
- Hierarchical cluster analysis of subcutaneous adipose tissue and visceral adipose tissue microarrays.
| Wiki pathway | Microarray | |||
|---|---|---|---|---|
| Upregulated | Downregulated | Symbol | Name | |
| Adipocyte-secreted products | 1 | 1 | ADPN | Adiponectin |
| RETN† | Resistin | |||
| Transcription factors | 2 | 5 | PPARG | Peroxisome proliferator-activated receptor gamma |
| PPARA† | Peroxisome proliferator-activated receptor alpha | |||
| SREBP2† | Transcription factor, regulation of lipid, fatty acid and steroid metabolism | |||
| IRS2 | Insulin receptor substrate 2 | |||
| CEBPB | CCAAT/enhancer-binding protein beta | |||
| MEF2A | Myocyte enhancer factor 2 | |||
| MEF2D | Myocyte-specific enhancer factor 2 | |||
| Cholesterol synthesis | 0 | 1 | MVD | Mevalonate diphosphate decarboxylase |
| Fatty acid beta oxidation | 0 | 2 | ACSL1 | Acyl-CoA synthetase long-chain family, member 1 |
| ACSL3 | Acyl-CoA synthetase long-chain family, member 3 | |||
| Glycolysis and gluconeogenesis | 1 | 3 | GAPDHS | Glyceraldehyde-3-phosphate dehydrogenase |
| PGK1 | Phosphoglycerate kinase 1 | |||
| HK1† | Hexokinase-1 | |||
| LDHC | Lactate dehydrogenase C | |||
| Inflammatory response | 2 | 0 | CD40 LG† | CD40 ligand |
| VTN† | Vitronectin | |||
| Insulin signalling | 1 | 6 | IRS | Glucose homeostasis, intracellular insulin signalling cascade |
| RAPGEF1† | Rap guanine nucleotide exchange factor 1 | |||
| MAP3K2 | Mitogen-activated protein kinase kinase kinase 2 | |||
| MAP3K6 | Mitogen-activated protein kinase kinase kinase 6 | |||
| MAP3K9 | Mitogen-activated protein kinase kinase kinase 9 | |||
| MAP3K14 | Mitogen-activated protein kinase kinase kinase 14 | |||
| AKT1 | Serine/threonine protein kinase | |||
| Leptin signalling | 1 | 1 | BAX† | Bcl-2-like protein |
| AKT1 | Serine/threonine protein | |||
| Peroxisome lipid metabolism | 0 | 1 | ABCD1 | ATP-binding cassette subfamily D, member 1 |
| Apoptosis | 1 | 3 | BAX† | Bcl-2-like protein |
| CDKN2A | Cyclin-dependent kinase inhibitor 2A | |||
| CASP 4 | Caspase 4 | |||
| CASP11 | Caspase 11 | |||
| Eicosanoid synthesis | 1 | 1 | ALOX5† | Arachidonate 5-lipoxygenase |
| PNPLA3 | Patatin-like phospholipase domain-containing protein 3 | |||
| Cytochromes P450 | 2 | 0 | CYP7A1† | Cytochrome P450 7A1 |
| CYP19A1† | Cytochrome P450 19A1 | |||
Differentially expressed genes were selected using the filtering criteria of a change of at least 2.0 fold and P≤0.05. †Upregulated genes
| Wiki pathway | Microarray | |||
|---|---|---|---|---|
| Upregulated | Downregulated | Symbol | Name | |
| Product secretion of adipocytes | 0 | 2 | ADPN | Adiponectin |
| RETN | Resistin | |||
| Transcription factors | 0 | 2 | PPARG | Peroxisome proliferator-activated receptor gamma |
| PPARGC1A | Peroxisome proliferator-activated receptor gamma coactivator 1-alpha | |||
| Cholesterol synthesis | 0 | 1 | MVD | Mevalonate diphosphate decarboxylase |
| Fatty acid beta oxidation | 0 | 3 | ACSL3 | Acyl-CoA synthetase long-chain family member 3 |
| CHKB | Choline kinase beta | |||
| HADHA | Hydroxyacyl-CoA dehydrogenase/3-ketoacyl-CoA | |||
| Glycolysis and gluconeogenesis | 1 | 0 | SLC2A5† | Solute carrier family 2, member 5 |
| Inflammatory response | 2 | 0 | CD40LG† | CD40 ligand |
| CD86† | Cluster of differentiation 86 | |||
| Insulin signalling | 4 | 6 | RAPGEF1† | Rap guanine nucleotide exchange factor 1 |
| EGR1† | Early growth response protein 1 | |||
| FOS† | Finkel-Biskis-Jinkins murine osteogenic sarcoma virus | |||
| SUCGL | Succinyl-CoA ligase | |||
| PTEN | Phosphatase and tensin homolog | |||
| MAP3K2 | Mitogen-activated protein kinase kinase kinase 2 | |||
| MAP3K4† | Mitogen-activated protein kinase kinase kinase 4 | |||
| MAP3K12 | Mitogen-activated protein kinase kinase kinase 12 | |||
| MAP3K13 | Mitogen-activated protein kinase kinase kinase 13 | |||
| MAP3K14 | Mitogen-activated protein kinase kinase kinase 14 | |||
| Leptin signalling | 2 | 1 | BAX† | Bcl-2-like protein |
| SRC† | Proto-oncogene tyrosine protein kinase | |||
| PDE3B | Phosphodiesterase | |||
| Peroxisome lipid metabolism | 0 | 4 | ABCD1 | ATP-binding cassette subfamily D, member 1 |
| IDH1 | Isocitrate dehydrogenase 1 | |||
| ACOX2 | Acyl-CoA oxidase | |||
| SLC27A2 | Solute carrier family 27 | |||
| Apoptosis | 3 | 1 | BAX† | Bcl-2-like protein |
| PRF1† | Pore-forming protein | |||
| CASP2† | Caspase 2 | |||
| CDKN2A | Cyclin-dependent kinase inhibitor 2A | |||
| Triglyceride synthesis | 1 | 1 | GPAM | Glycerol-3-phosphate acyltransferase, mitochondrial |
| PPAP2C† | Phosphatidic acid phosphatase type 2C | |||
| Eicosanoid synthesis | 0 | 1 | PNPLA3 | Patatin-like phospholipase domain-containing protein 3 |
| Carbohydrate metabolism | 3 | 0 | GALT† | Galactose-1-phosphate uridylyltransferase |
| G6PC3† | Glucose-6-phosphatase | |||
| SLC2A5† | Solute carrier family 2, member 5 | |||
| Nuclear receptors | 0 | 1 | PPARG | Peroxisome proliferator-activated receptor gamma |
| Oxidative stress | 2 | 0 | FOS† | Finkel-Biskis-Jinkins murine osteogenic sarcoma virus |
| NOX4† | NADPH oxidase 4 | |||
| Cytochromes P450 | 2 | 1 | CYP1B1 | Cytochrome P450 1B1 |
| CYP4A11† | Cytochrome P450 4A11 | |||
| CYP17A1† | Cytochrome P450 17A1 | |||
Differentially expressed genes were selected using the filtering criteria of a change of at least 2.0 fold and P≤0.05. †Upregulated genes
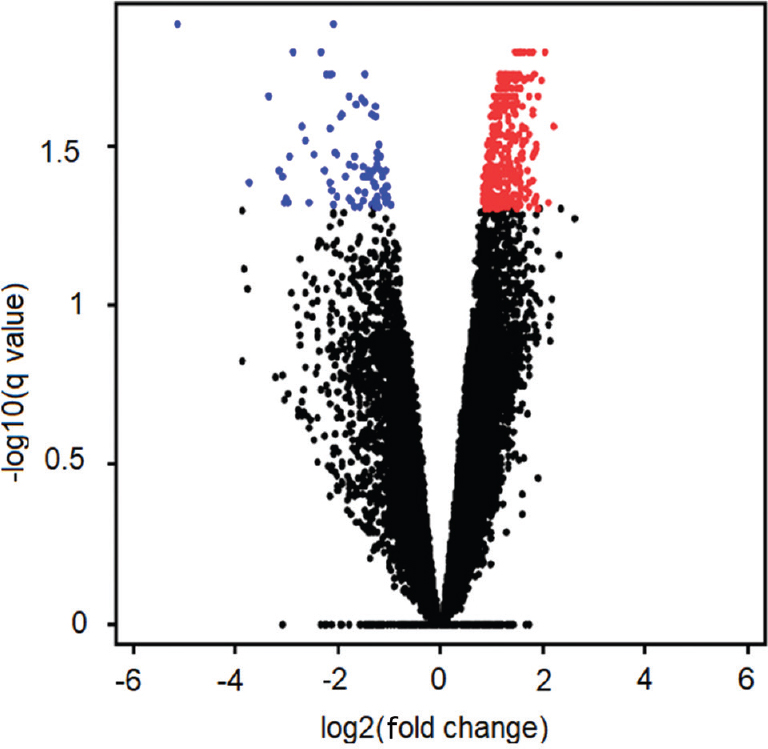
- Volcano plot of subcutaneous adipose tissue and visceral adipose tissue microarrays.
In the RT-PCR confirmation of gene expression, the expression levels of the adiponectin (ADPN) and peroxisome proliferator-activated receptor gamma (PPARG) genes were not affected by obesity in either tissue (SAT and VAT). Furthermore, the gene expression of mevalonate diphosphate decarboxylase (MVD) was decreased by obesity in SAT, while the levels of phosphatidic acid phosphatase type 2C (PPAP2C), cytochrome P450 4A11 (CYP4A11) and cytochrome P450 17A1 (CYP17A1) were significantly increased in VAT of obese patients. The gene expression level of ADPN was slightly increased in SAT in comparison with VAT in the obesity group. The isozyme levels of the long-chain fatty acid-coenzyme A ligase gene (ACSL3), succinyl-CoA ligase (SUCGL), isocitrate dehydrogenase 2 (IDH2), mitochondrial glycerol-3-phosphate acyltransferase (GPAM), patatin-like phospholipase domain-containing protein 3 (PNPLA3) and cytochrome P450 1B1 (CYP1B1) were significantly downregulated, whereas PPAP2C, CYP4A11 and CYP17A1 gene expression did not differ in the VAT of obese individuals (Figs 3 and 4).
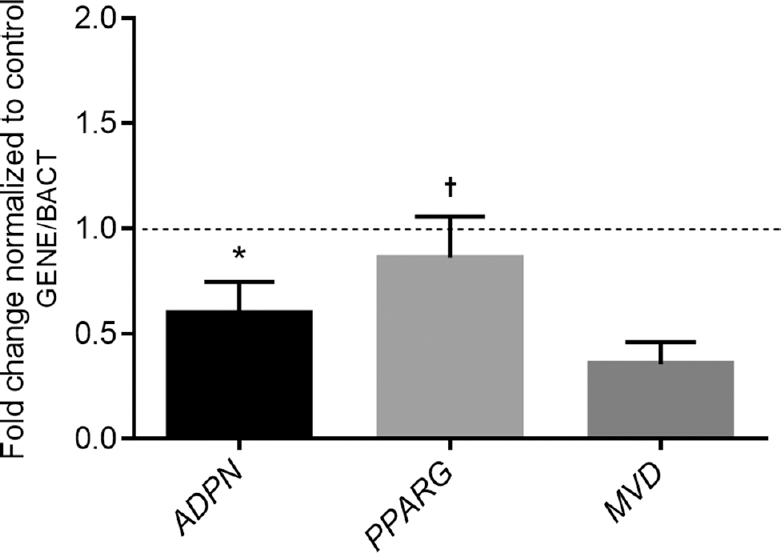
- Relative expression levels of selected studied genes in subcutaneous adipose tissue from obese individuals (n=37) and normal weight individuals (n=35). The data are expressed as fold changes relative to the control group or normal weight individuals (dashed line), taken as 100 per cent or 1.0. Differences between groups were assessed using ANOVA with Bonferroni post hoc analysis, *P<0.05 vs. MVD gene expression and †P<0.05 vs. ADPN and MVD gene expressions.
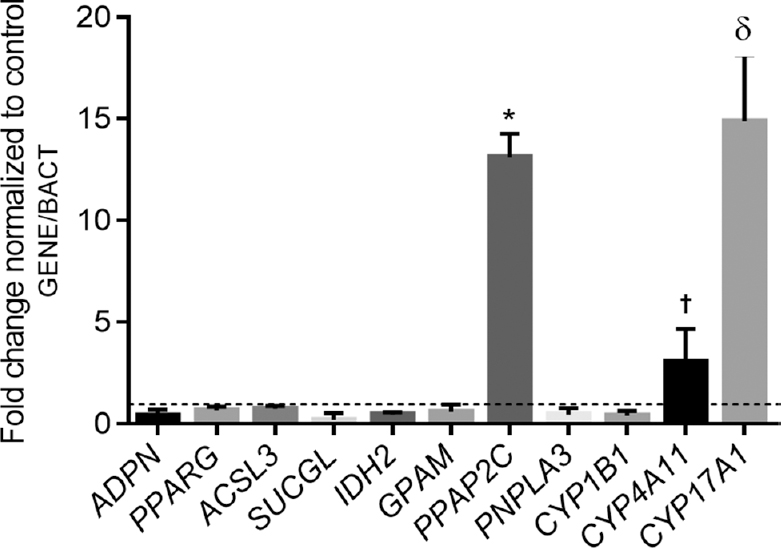
- Relative expression levels of selected studied genes in visceral adipose tissue from patients with obesity (n=37) and normal weight individuals (n=35). The data are expressed as fold changes relative to the control group or normal weight individuals (dashed line), taken as 100 per cent or 1.0, respectively. Differences between groups were assessed using ANOVA with Bonferroni post hoc analysis.*P<0.05 vs. ADPN, PPARG, ACSL3, IDH2, GPAM, PNPLA3 and CYP1B1 gene expressions,†P<0.05 vs. ADPN, PPARG, ACSL3, SUCGL, IDH2, GPAM, PPAP2C, PNPLA3 and CYP1B1 gene expressions and δP<0.05 vs. ADPN, PPARG, ACSL3, SUCGL, IDH2, GPAM, PPAP2C, PNPLA3, CYP1B1 and CYP4A11 gene expressions.
Discussion
Several genes involved in signalling pathways exhibited altered expression in samples of both types of adipose tissue from the obese patients. One of these genes was ADPN. Several insulin-resistant states, such as obesity and type 2 diabetes, as well as cardiovascular diseases have been found to be associated with low levels of plasma ADPN in human obesity14. Our results were in agreement with previous reports demonstrating reduced ADPN expression in adipose tissue1516. Another gene exhibiting altered expression in both SAT and VAT from obese individuals was PPARG. The PPARG signalling in metabolism regulation is considered a master regulator of adipogenesis17. Our results confirmed that downregulation of the PPARG gene induced downregulation of the ADPN gene and, thus, proliferation of adipocytes, lipoatrophy and alterations of insulin metabolism in the SAT and VAT of obese individuals in comparison with normal weight individuals18.
Our study also showed that MVD gene expression was significantly downregulated in the SAT of obese individuals. A recent study in a high-fat diet-induced obese mouse model demonstrated that MVD gene expression was downregulated in the mouse liver after the administration of a Polygala tenuifolia plant extract, which is used as anti-obesity therapy19. ACSL3 gene expression was significantly downregulated in the VAT of the obese individuals compared with that of the controls. Considering the evidence of the important role of ACSL3 in hepatic lipogenesis and its regulation, the ACSL3 gene and protein can be assumed to be essential for triglyceride metabolism in VAT, regulated by the PPAR gene, in addition to preventing the development of lipotoxicity in peripheral tissues and contributing to the modulation of steroidogenic genes in adipose tissue2021. SUCGL and IDH2 gene expression was also downregulated in the VAT of obese individuals. SUCGL deficiency in humans has only been related to mitochondrial hepatoencephalomyopathy, and expression of IDH2 has been related to the development of acute myeloid leukaemia and glioma of the central nervous system2223. Considering all of the physiological functions of these proteins, one can assume that these also play an important role in promoting metabolic changes in obesity in addition to their functions in VAT, as these are well known to induce alterations in the oxidative stress response, apoptotic processes and hypoxia levels in hypertrophic fat cells2425. Thus, further study is warranted.
Our study also showed that the GPAM gene was expressed at a lower level in the VAT from obese individuals. These results were consistent with those of a previous study26 showing that the total activity of the enzyme decreased as a function of adipocyte size in omental and subcutaneous fat. It is well known that adipocyte hypertrophy is prevalent in the VAT of obese individuals. Inhibition of GPAM has been proposed as a potential treatment for insulin resistance and type 2 diabetes27. The PNPLA3 gene was found to be downregulated in the VAT of obese patients, supporting previous findings that PNPLA3 expression was decreased in obese individuals28. In addition, differential expression of the PNPLA3 gene has been observed in the SAT of obese patients on the initiation of weight loss with a low-calorie diet and after maintaining a stable body weight, where increased expression of this gene corresponds to body weight maintenance29. The reductions in the expression levels of these genes might have contributed to the reduction of de novo lipogenesis in the obese individuals, thereby contributing to alterations in glucose metabolism. No studies examining the expression of PPAP2C in human adipose tissue have been published; however, previous studies have demonstrated that this enzyme presents a wide variety of important biological functions and that it potentially influences physiological processes such as cell proliferation, differentiation and survival, cell migration and apoptosis30. In addition, significantly increased expression of some CYP450 enzymes was detected in the VAT from obese individuals. An increase in the level of CYP4A11 was observed in the obese individuals in this study. This result was consistent with those of other experimental studies3132. Our results also demonstrated that the CYP17A1 gene was upregulated in the VAT of obese individuals, in agreement with a study by Tabur et al33. However, a significant decrease was seen in CYP1B1 gene expression in comparison with those of other CYPs. The downregulation of this CYP can likely be explained by its response to the endogenous activity of nuclear receptors; PPARG gene expression was also found to be reduced in VAT in the present study.
In the present study SAT and VAT depots exhibited distinct expression profiles. Differential gene expression of MVD, ACSL3, SUCGL, IDH2, PPAP2C, CYP4A11 and CYP1B1 in the SAT and VAT of obese individuals was shown. These novel findings could facilitate the identification of candidate genes and aid in the clinical diagnosis of obesity.
Financial support & sponsorship: This study was funded by A022 program-obesity project, SEDENA, Mexico City, Mexico and performed in partial fulfilment of the requirements for the post-doctoral training of the first author (MDR) supported by CONACYT fellowship 290847-IPN. Authors also acknowledge the support of 2017/C-003 project, National Institute of Pediatrics, Mexico City, Mexico.
Conflicts of Interest: None.
References
- Obesity: Preventing and managing the global epidemic. Report of a WHO consultation. WHO Technical Report Series. Vol 894. Geneva: WHO; 2000.
- Physical inactivity prevalence and trends among Mexican adults: Results from the national health and nutrition survey (ENSANUT) 2006 and 2012. BMC Public Health. 2013;13:1063.
- [Google Scholar]
- Signalling role of adipose tissue: Adipokines and inflammation in obesity. Biochem Soc Trans. 2005;33:1078-81.
- [Google Scholar]
- Gene expression in visceral and subcutaneous adipose tissues. Ann Med. 2001;33:547-55.
- [Google Scholar]
- Increased lipolysis and decreased leptin production by human omental as compared with subcutaneous preadipocytes. Diabetes. 2002;51:2029-36.
- [Google Scholar]
- Insulin sensitivity, insulin secretion, and abdominal fat: The insulin resistance atherosclerosis study (IRAS) family study. Diabetes. 2003;52:2490-6.
- [Google Scholar]
- Gene expression regional differences in human subcutaneous adipose tissue. BMC Genomics. 2017;18:202.
- [Google Scholar]
- Gene expression profiling in subcutaneous, visceral and epigastric adipose tissues of patients with extreme obesity. Int J Obes (Lond). 2014;38:371-8.
- [Google Scholar]
- Microarray profiling of isolated abdominal subcutaneous adipocytes from obese vs. non-obese Pima Indians: Increased expression of inflammation-related genes. Diabetologia. 2005;48:1776-83.
- [Google Scholar]
- Differentially expressed genes in visceral or subcutaneous adipose tissue of obese men and women. J Lipid Res. 2004;45:148-54.
- [Google Scholar]
- 2003. Agilent manuals. Santa Clara: Agilent Technologies; Available from: https://www.agilent.com/en/product/cgh-cgh-snp-microarray-platform/cgh-cgh-snp-microarrays/human-microarrays/sureprintg3-human-cgh-microarray-1x1m-228414#relatedproducts
- Controlling the false discovery rate: A practical and powerful approach to multiple testing. J R Stat Soc Series B. 1995;57:289-300.
- [Google Scholar]
- Analysis of relative gene expression data using real-time quantitative PCR and the 2(-delta delta C(T)) method. Methods. 2001;25:402-8.
- [Google Scholar]
- Adiponectin and resistin – New hormones of white adipose tissue. Med Sci Monit. 2003;9:RA55-61.
- [Google Scholar]
- Adiponectin levels differentiate metabolically healthy vs. unhealthy among obese and nonobese white individuals. J Clin Endocrinol Metab. 2015;100:4172-80.
- [Google Scholar]
- Serum adiponectin and leptin concentrations in relation to body fat distribution, hematological indices and lipid profile in humans. Int J Environ Res Public Health. 2015;12:11528-48.
- [Google Scholar]
- Forming functional fat: A growing understanding of adipocyte differentiation. Nat Rev Mol Cell Biol. 2011;12:722-34.
- [Google Scholar]
- Applications of metabolomics for understanding the action of peroxisome proliferator-activated receptors (PPARs) in diabetes, obesity and cancer. Genome Med. 2012;4:32.
- [Google Scholar]
- Polygala tenuifolia extract inhibits lipid accumulation in 3T3-L1 adipocytes and high-fat diet-induced obese mouse model and affects hepatic transcriptome and gut microbiota profiles. Food Nutr Res. 2017;61:1379861.
- [Google Scholar]
- Long-chain acyl-CoA synthetases and fatty acid channeling. Future Lipidol. 2007;2:465-76.
- [Google Scholar]
- Molecular cloning of the goose ACSL3 and ACSL5 coding domain sequences and their expression characteristics during goose fatty liver development. Mol Biol Rep. 2014;41:2045-53.
- [Google Scholar]
- Succinyl-CoA ligase deficiency: A mitochondrial hepatoencephalomyopathy. Pediatr Res. 2010;68:159-64.
- [Google Scholar]
- JAK2/IDH-mutant-driven myeloproliferative neoplasm is sensitive to combined targeted inhibition. J Clin Invest. 2018;128:789-804.
- [Google Scholar]
- Attenuated mitochondrial NADP+-dependent isocitrate dehydrogenase activity enhances EGCG-induced apoptosis. Biochimie. 2011;93:1808-15.
- [Google Scholar]
- The interplay between SUCLA2, SUCLG2, and mitochondrial DNA depletion. Biochim Biophys Acta. 2011;1812:625-9.
- [Google Scholar]
- Sex and depot differences in ex vivo adipose tissue fatty acid storage and glycerol-3-phosphate acyltransferase activity. Am J Physiol Endocrinol Metab. 2015;308:E830-46.
- [Google Scholar]
- Inhibition of glycerol-3-phosphate acyltransferase as a potential treatment for insulin resistance and type 2 diabetes. Curr Opin Investig Drugs. 2004;5:411-8.
- [Google Scholar]
- Adipose tissue gene expression analysis reveals changes in inflammatory, mitochondrial respiratory and lipid metabolic pathways in obese insulin-resistant subjects. BMC Med Genomics. 2012;5:9.
- [Google Scholar]
- Differential gene expression in adipose tissue from obese human subjects during weight loss and weight maintenance. Am J Clin Nutr. 2012;96:196-207.
- [Google Scholar]
- Regulation of cell survival by lipid phosphate phosphatases involves the modulation of intracellular phosphatidic acid and sphingosine 1-phosphate pools. Biochem J. 2005;391:25-32.
- [Google Scholar]
- Altered expression of hepatic CYP2E1 and CYP4A in obese, diabetic ob/ob mice, and fa/fa Zucker rats. Biochem Biophys Res Commun. 1999;255:300-6.
- [Google Scholar]
- Constitutive and inducible expression of hepatic CYP2E1 in leptin-deficient ob/ob mice. Biochem Biophys Res Commun. 2000;268:337-44.
- [Google Scholar]
- CYP gene expressions in obesity-associated metabolic syndrome. Obes Res Clin Pract. 2016;10:719-23.
- [Google Scholar]


