
Translate this page into:
Development & cross-validation of anthropometric predictive models to estimate the appendicular skeletal muscle mass in middle-aged women in Sri Lanka
For correspondence: Dr Nirmala Rathnayake, Department of Nursing, Faculty of Allied Health Sciences, University of Ruhuna, Galle, Sri Lanka e-mail: nirmala.priyanthi@gmail.com
-
Received: ,
This is an open access journal, and articles are distributed under the terms of the Creative Commons Attribution-NonCommercial-ShareAlike 4.0 License, which allows others to remix, tweak, and build upon the work non-commercially, as long as appropriate credit is given and the new creations are licensed under the identical terms.
This article was originally published by Wolters Kluwer - Medknow and was migrated to Scientific Scholar after the change of Publisher.
Abstract
Background & objectives:
Attempts have been made to estimate appendicular skeletal muscle mass (ASMM) using anthropometric indices and most of these are country specific. This study was designed to develop and cross-validate simple predictive models to estimate the ASMM based on anthropometry in a group of healthy middle-aged women in Sri Lanka.
Methods:
The study was conducted on a randomly selected group of community-dwelling women aged 30-60 years. ASMM (kg) quantified with dual-energy X-ray absorptiometry (DXA) (ASMMDXA) was used as the reference standard. Anthropometric measurements such as body weight (kg), height (m), limb circumferences (cm) and skinfold thickness (mm) which showed significant correlations with ASMMDXA, were used to develop the models. The models were developed using a group of 165 women (aged 30-60 yr) and were cross-validated using a separate sample of women (n=167) (mean age: 48.9±8.56 yr), selected randomly.
Results:
Nine anthropometry-based models were developed using weight, height, skinfold thicknesses, circumferences, body mass index, menopausal status (MS) and age as independent variables. Four models which were based on height, weight, triceps skinfold thickness (TSFT), age and MS met all the validation criteria with high correlations (ranged 0.89-0.92) and high predictive values explaining high variance (80-84%) with low standard error of estimate (1.10-1.24 kg).
Interpretation & conclusions:
The four models (ASMM 1-ASMM 4) developed based on height, weight, TSFT, age and MS showed a high accuracy in estimating the ASMM in middle-aged women.
Keywords
Anthropometry
appendicular skeletal muscle mass
cross-validation
development
middle-aged women
predictive models

Skeletal muscle mass (SMM) is a metabolically active body compartment in the human body, and plays a central role in a number of physiological processes1. Approximately 75 per cent of SMM is located in the appendicular region called as appendicular SMM (ASMM)2, and it is closely related to ambulation, mobility and performance of daily activities. The SMM in women decreases at a rate of one per cent per year after the third decade of age, with an accelerated decline after the fifth decade3. In women, changes in SMM are partly age related and partly related to ovarian failure following menopause4. As a result, they are prone to develop sarcopenia which leads to deleterious consequences such as impaired physical performance, physical disability and poor quality of life5.
Many technologies are used to measure SMM, of those magnetic resonance imaging (MRI) is considered the gold standard due to its high accuracy and lack of radiation exposure6. Dual-energy X-ray absorptiometry (DXA) also has a high measurement precision and relatively low radiation hazard7 than other imaging techniques such as computer tomography (CT). Despite the high accuracy, MRI, CT and DXA are not widely used to estimate SMM due to limitations inherent to these technologies.
Anthropometry offers practical alternative that is simple, valid and inexpensive for measuring SMM8, especially in resource-poor settings. Several formulae based on anthropometric indices have been developed to estimate ASMM. These formulae, however, have been validated mostly in the European populations, and their applicability to other populations or ethnic groups is uncertain. Country-specific prediction models are more likely to suit their own populations than models developed elsewhere9.
Hence, country-specific prediction models have been developed in China10, Japan7, India1112, USA13, Brazil14 and Australia15 using different anthropometric indices such as height, weight, body mass index (BMI), limb circumferences, waist circumference, limb lengths and skinfold thickness as unadjusted indices121415, adjusted indices for body fat mass, height or arm length1013 and in combination with handgrip strength7. Only one study could be traced related to SMM in Sri Lanka16. This is mainly due to the lack of appropriate technology to measure SMM and non-use of SMM in clinical applications. Therefore, in this study, an attempt was made to develop country-specific formulae, using indices of anthropometry, to estimate ASMM in middle-aged women in Sri Lanka.
Material & Methods
A community-based cross-sectional study was conducted in two stages in the community study area of the Faculty of Medicine, University of Ruhuna in Galle, Sri Lanka, over a period of one and a half years from June 2015 to January 2017. Ethical clearance for the study was obtained from the Ethical Review Committee, Faculty of Medicine, University of Ruhuna, Sri Lanka, and written informed consent was obtained from each participant before the commencement of the study.
Study participants: A group of healthy community-dwelling women aged 30-60 year were selected randomly from the study area. Of the 18 public health midwifery areas, two areas (Godakanda East and Kapuhempala) were selected randomly to recruit women for the development of new models (Stage 1; group A, n=165) and two other areas (Hapugala and Kahaduwawaththa) were selected randomly to recruit women for the validation of the models (Stage 2; group B, n=167). Women who were on pharmacologic doses of medications such as corticosteroids, thyroxin, hormonal contraceptives, hormone replacement therapy, vitamin D and calcium; those who were following dedicated dietary or exercise programmes; pregnant or lactating women were excluded from the study. Women with non-communicable diseases; polycystic ovarian syndrome; chronic inflammatory conditions; malabsorption and chronic diseases involving cardiovascular, nervous, respiratory or gastrointestinal systems were also excluded. Menopausal status (MS) (pre- and post-menopausal) was considered on self-stated menstrual history based on the classification of Stages of Reproductive Aging Workshop17.
The sample size for the study was calculated based on the BMI [mean and standard deviation (SD)] between pre- and post-menopausal women in a previous study18. The formula used for this calculation was as follows: N=(Zα/2+Zβ)2×(σ12+σ22)/(μ1−μ2)2, where Zα/2=95 per cent confidence interval=1.96, Zβ=80 per cent power=0.84 σ1 and σ2=standard deviations and μ1−μ2=effects size/difference between two means19. The minimum recommended number of pre- and post-menopausal women in each category was 155. However, 184 pre-menopausal and 166 post-menopausal women participated in the study. Due to incomplete data, 15 pre-menopausal and three post-menopausal women were excluded from the analysis.
Measured variables: Body weight (kg), height (m), circumferences (cm) and skinfold thickness (mm) at specific sites were measured adhering to the standard protocols1320. Body weight was measured to the nearest 0.1 kg using a digital weighing scale (NAGATA, Tainan, Taiwan) when wearing light clothes. The standing height was measured without footwear and recorded to the nearest 0.1 cm with a stadiometer (NAGATA, Tainan, Taiwan). BMI was calculated as weight in kilograms divided by height in metres squared (kg/m2). Limb circumferences at mid-upper arm, mid-thigh and medial calf on the right side were measured in triplicate. Skinfold thicknesses were measured in triplicate over the triceps, calf and thigh, using a skinfold calliper (Skinfold Caliper - Holtain Ltd., UK) to the nearest 1 mm in the right side. The precision errors (CV%) of anthropometric indices included in this study were determined by measuring 30 women twice in the same setting on the same day. The precision errors of measured anthropometric indices ranged from 1.30 to 5.66 per cent.
The limb circumferences (Climb) were corrected for subcutaneous adipose tissue thickness as described previously2122. The corrected muscle (including bone) circumferences (Cm) were calculated as Cm=Climb−πS (S: skinfold thickness). Cm was considered as corrected girth (CAG, corrected arm girth; CTG, corrected thigh girth and CCG, corrected calf girth). Further, as appendicular circumferences are uni-dimensional and muscle mass is three dimensional, Cm was squared and multiplied by height to convert to a three-dimensional measures2122.
DXA was used as the reference standard to quantify the ASMM. ASMMDXA (kg) was measured with a DXA Scanner (Hologic Discovery W, Hologic Inc., Discovery, Bedford, MA, USA) adhering to the manufacturer's recommendations. The accuracy and precision of measurements were ensured by scanning the full body phantom each scanning day and inspecting the calibration chart from beginning to the end of the study. SMM was analyzed by inbuilt software provided by the manufacturers, and ASMMDXA was determined by the sum of SMM of lower and upper limbs. The physical activity (PA) level was evaluated with the short version of the International Physical Activity Questionnaire (IPAQ)23 which was forward-backward translated into Sinhala language and pre-tested. Participants were asked to report the time duration spent for walking, moderate intensity activity and vigorous intensity activity during the week prior to the interview. The PA data were converted to minutes per week and expressed as a metabolic equivalent (MET-min/wk) according to the IPAQ guidelines for data processing23.
Statistical analysis: Data were analyzed using IBM SPSS v20.0 (SPSS Inc., Chicago, IL, USA). Normality of the data distribution was determined with Kolmogorov-Smirnov test with relevant plots. Descriptive statistics, including means (SD), median (interquartile range) or frequency (%), were used to describe the data. The group comparison of continuous data was performed with independent samples t test (after log transformation in PA data), and the group comparison of categorical data was performed with Chi-square test to evaluate the suitability for cross-validation.
Development of new models: Data from the 165 middle-aged women in group A were used for the development of new models. Pearson's correlation coefficients (r) were estimated between ASMMDXA and anthropometric variables to identify significant associations. Only the variables which showed strong significant associations with ASMM were considered for the development of models. The collinearity between the variables was verified by the variance inflation factor (VIF) and tolerance (T) values. Thus, VIF values <10 were considered as acceptable and tolerance values above 0.124. Based on the above results, regression analyses were performed using ASMMDXA as the dependent variable and weight, triceps skinfold thickness (TSFT) (the strongest correlation among skinfold thicknesses studied), mid-upper arm circumference (MUAC) (the strongest correlation among arm circumferences studied), BMI, in different steps while age and MS also as independent variables in step-wise method. The next step was performed including all the measured variables as the 7th step. After that, another two steps which included corrected girths and three-dimensional figures in combination with age, weight, height and MS were performed as 8th and 9th steps. In the development of models, the variables that were entered and excluded in each step are shown in Table I. Based on the selected variables by the regression models, mathematical equations were developed.
| Step | Variables included in the regression model | Variables excluded from the model |
|---|---|---|
| 1 | Age, TSFT, MUAC, weight | MUAC |
| 2 | Age, TSFT, MUAC, weight, height | MUAC, age |
| 3 | Age, TSFT, MUAC, weight, MS | MUAC |
| 4 | Age, TSFT, MUAC, weight, height, MS | MUAC, TFST, age |
| 5 | Age, TSFT, MUAC, BMI | TSFT |
| 6 | Age, TSFT, MUAC, BMI, MS | TFST, age |
| 7 | Age, TSFT, ThSFT, CaSFT, MUAC, ThC, CaC, weight, height, MS | TSFT, CaSFT, MUAC, ThC, CaC, MS |
| 8 | Age, weight, height, MS, CAG, CTG, CCG | Age, MS, CAG |
| 9 | Age, Weight, MS, CAG2 height, CTG2 height, CCG2 height | MS, CAG2 height |
TSFT, triceps skinfold thickness; ThSFT, thigh skinfold thickness; CaSFT, calf skinfold thickness; MUAC, mid-upper arm circumference; ThC, thigh circumference; CaC, calf circumference; BMI, body mass index, CAG, corrected arm girth, CTG, corrected thigh girth, CCG, corrected calf girth, CAG2 height/CTG2 height/CCG2 height, three-dimensional limb figures; MS, menopausal status
Cross-validation of newly developed models: For the cross-validation of the newly developed models, 167 study participants assigned to group B were studied. Scatter plots were drawn and correlations between the ASMMs predicted by the newly developed models and ASMMDXA were determined. The mean differences between ASMM measured and estimated with developed models were compared by the paired samples t test. If the ASMM measured and estimated with developed models were not significantly different, additionally, determination coefficient (R2) and standard error of estimate (SEE) were determined with linear regression model. To consider the models to be valid, the validation criteria described by Lohman25 and followed subsequently by Pereira et al14 were used, i.e., the models tested should not be significantly different from reference standard, SEE should be <3.5 and R2 should be >0.7. The models which satisfied the above criteria were further tested for repeatability with Bland and Altman plots26 and by assessing the single-measure intraclass correlation coefficient (ICC) with 95 per cent confidence interval.
To assess the adequacy of the sample, the power of the study was estimated by Post Hoc Compute Achieved Power Analysis using the G*Power software version 3.1.9.2 (Heinrich Heine Universität Düsseldorf, Germany)27.
Results
Anthropometric indices and basic characteristics of groups A and B are shown in Table II. There was no significant difference between the characteristics, age, MS, anthropometric indices, PA level and ASMMDXA of the two groups, indicating that two groups were similar to perform cross-validation. In group A, all anthropometric indices studied showed positive correlations with ASMMDXA (Table III). Strong correlations were observed between ASMMDXA and weight (r=0.87), MUAC (r=0.73), BMI (r=0.67), TSFT (r=0.56) and height (r=0.55). Even though the corrected limb girths and three-dimensional figures were calculated expecting better representation of limb muscle mass, the correlations between ASMMDXA and corrected girths or three-dimensional figures were low compared to the correlation between ASMMDXA and crude girth indices (Table III).
| Characteristic | Group A (n=165) Mean (SD) or median (IQR) or n (%) |
Group B (n=167) Mean (SD) or median (IQR) or n (%) |
|---|---|---|
| Age (yr) | 49.11 (8.21) | 48.9 (8.56) |
| Height (m) | 1.50 (0.06) | 1.51 (0.05) |
| Weight (kg) | 57.52 (10.62) | 57.32 (11.04) |
| BMI (kg/m2) | 25.36 (4.32) | 25.51 (2.84) |
| TSFT (mm) | 19.47 (6.09) | 19.31 (6.27) |
| ThSFT (mm) | 27.71 (9.90) | 26.92 (9.93) |
| CaSFT (mm) | 18.63 (8.41) | 17.80 (8.54) |
| MUAC (cm) | 31.15 (3.85) | 30.72 (3.77) |
| ThC (cm) | 49.07 (7.41) | 49.33 (7.51) |
| CaC (cm) | 34.40 (5.68) | 33.40 (4.24) |
| ASMMDXA (kg) | 15.39 (2.75) | 15.51 (2.84) |
| Walking PA score (MET-min/wk) | 346.50 (0.00-1386.00) | 346.50 (0.00-981.75) |
| Moderate PA score (MET-min/wk) | 5040.00 (5040.00-5040.00) | 5040.00 (5040.00-5040.00) |
| Vigorous PA score (MET-min/wk) | 1680.00 (560.00-3360.00) | 1680.00 (560.00-3360.00) |
| Total PA score (MET-min/wk) | 7546.00 (6293.00-9093.00) | 7067.00 (5880.00-9093.00) |
| Pre-menopausal women (%) | 84 (50.9) | 85 (50.9) |
| Post-menopausal women (%) | 81 (49.1) | 82 (49.1) |
The group comparison of continuous data was performed with independent samples t test (after log transformation in physical activity data). The group comparison of categorical data was performed with Chi-square test. No significant difference observed between the two groups. SD, standard deviation; IQR, interquartile range; TSFT, triceps skinfold thickness; ThSFT, thigh skinfold thickness; CaSFT, calf skinfold thickness; MUAC, mid-upper arm circumference; ThC, thigh circumference; CaC, calf circumference; BMI, body mass index; ASMMDXA, appendicular skeletal muscle mass measured with DXA; PA, physical activity
| Characteristics | Correlation with ASMMDXA (Pearson correlation**) |
|---|---|
| Height (m) | 0.55 |
| Weight (kg) | 0.87 |
| BMI (kg/m2) | 0.67 |
| TSFT (mm) | 0.56 |
| ThSFT (mm) | 0.38 |
| CaSFT (mm) | 0.43 |
| MUAC (cm) | 0.73 |
| ThC (cm) | 0.53 |
| CaC (cm) | 0.52 |
| CAG | 0.60 |
| CTG | 0.47 |
| CCG | 0.25 |
| CAG2 height | 0.68 |
| CTG2 height | 0.59 |
| CCG2 height | 0.25 |
**All the variables were significantly correlated at <0.01 level. BMI, body mass index; TSFT, triceps skinfold thickness; ThSFT, thigh skinfold thickness; CaSFT, calf skinfold thickness; MUAC, mid-upper arm circumference; ThC, thigh circumference; CaC, calf circumference; ASMMDXA, appendicular skeletal muscle mass measured with DXA; CAG, corrected arm girth; CTG, corrected thigh girth; CCG, corrected calf girth; CAG2 height/CTG2 height/CCG2 height, three-dimensional limb figures
The nine models developed to estimate the ASMM are given in Table IV. No significant collinearity was observed between independent variables (VIF <10 and tolerance values above 0.1) (data not shown). The results of the cross-validation (comparison between measured and estimated ASMM) are shown in Table V. The models which had non-significant mean difference between measured and estimated ASMMs were further tested for correlation and repeatability as shown in Table VI.
| Step | Model | Models equation | Correlation coefficient (r)* | Determination coefficient (R2) | SEE (kg) |
|---|---|---|---|---|---|
| 1 | ASMM 1 | 5.366+0.255 (weight)-0.064 (age)-0.078 (TSFT) | 0.90 | 0.80 | 1.21 |
| 2 | ASMM 2 | −7.405+0.204 (weight)+8.802 (height)-0.045 (age) | 0.91 | 0.82 | 1.14 |
| 3 | ASMM 3 | 4.917+0.254 (weight)-0.572 (MS)-0.075 (TSFT)-0.037 (age) | 0.90 | 0.81 | 1.20 |
| 4 | ASMM 4 | −8.394+0.205 (weight)+8.728 (height)-0.772 (MS) | 0.91 | 0.82 | 1.14 |
| 5 | ASMM 5 | 3.966+0.337 (MUAC)-0.075 (age)+0.182 (BMI) | 0.76 | 0.58 | 1.78 |
| 6 | ASMM 6 | 2.022+0.342 (MUAC)-1.271 (MS)+0.181 (BMI) | 0.77 | 0.58 | 1.77 |
| 7 | ASMM 7 | −2.205+0.244 (weight)+0.055 (height)-0.062 (ThSFT)-0.061 (age) | 0.95 | 0.89 | 1.04 |
| 8 | ASMM 8 | −9.585+0.171 (weight)+0.095 (height), 0.001 (CTG)+0.001 (CCG) | 0.92 | 0.85 | 1.08 |
| 9 | ASMM 9 | 4.183-0.036 (age)+0.176 (weight)+0.001 (CTG2 height)+0.001 (CCG2 height) | 0.90 | 0.82 | 1.16 |
*Correlations were significant at <0.001 level. Weight in kg, height in m, circumference in cm, skinfold thickness in mm. MS, menopausal status: 2, post-menopausal; 1, pre-menopausal; TSFT, triceps skinfold thickness; MUAC, mid-upper arm circumference; BMI, body mass index; CTG, corrected thigh girth; CCG, corrected calf girth; ThSFT, thigh skinfold thickness in mm; SEE, standard error of estimate
| Model | Mean±SD kg | Mean difference±SD | Range of mean difference | Significance (P) |
|---|---|---|---|---|
| ASMM 1 | 15.35±2.60 | 0.16±1.24 | −0.02-0.35 | 0.08 |
| ASMM 2 | 15.41±2.59 | 0.10±1.15 | −0.07-0.28 | 0.24 |
| ASMM 3 | 15.36±2.60 | 0.14±1.20 | −0.03-0.33 | 0.11 |
| ASMM 4 | 15.41±2.58 | 0.09±1.10 | −0.06-0.26 | 0.24 |
| ASMM 5 | 14.46±2.26 | 1.20±1.15 | 1.02-1.38 | <0.001 |
| ASMM 6 | 15.20±2.06 | 0.31±1.74 | 0.04-0.58 | 0.02 |
| ASMM 7 | 15.15±2.08 | 0.35±1.73 | 0.09-0.62 | 0.008 |
| ASMM 8 | 17.22±2.39 | 0.08±1.13 | −1.73-−1.37 | <0.001 |
| ASMM 9 | 18.76±3.91 | 0.70±2.02 | −1.69-−1.48 | <0.001 |
Mean comparison was performed with paired samples t test. SD, standard deviation; ASMM, appendicular skeletal muscle mass
| Model | Regression analysis | ICC | 95% confidence interval of ICC | ||
|---|---|---|---|---|---|
| Correlation coefficient (r)* | Determination coefficient (R2) | SEE (kg) | |||
| ASMM 1 | 0.89 | 0.80 | 1.24 | 0.84 | 0.86-0.92 |
| ASMM 2 | 0.91 | 0.83 | 1.16 | 0.90 | 0.87-0.93 |
| ASMM 3 | 0.90 | 0.82 | 1.20 | 0.90 | 0.87-0.92 |
| ASMM 4 | 0.92 | 0.84 | 1.10 | 0.91 | 0.89-0.93 |
*Correlations were significant at <0.001 level. SEE, standard error of estimate, ICC, intraclass correlation; ASMM, appendicularskeletal muscle mass
Of the nine models, only four models, including ASMM 1, ASMM 2, ASMM 3 and ASMM 4, met all the validation criteria; measured and estimated ASMMs were not significantly different (Table V) and had high correlations (r range from 0.89 to 0.92) and high coefficients of determination (80-84% variation of ASMMDXA) with low SEEs (1.10-1.24 kg) (Table VI).
An acceptable measurement agreement was observed for models ASMM 1-ASMM 4 when data were examined by the Bland and Altman plots (Figure).Further, ICC for validated models indicated strong measurement concordance (Table VI).
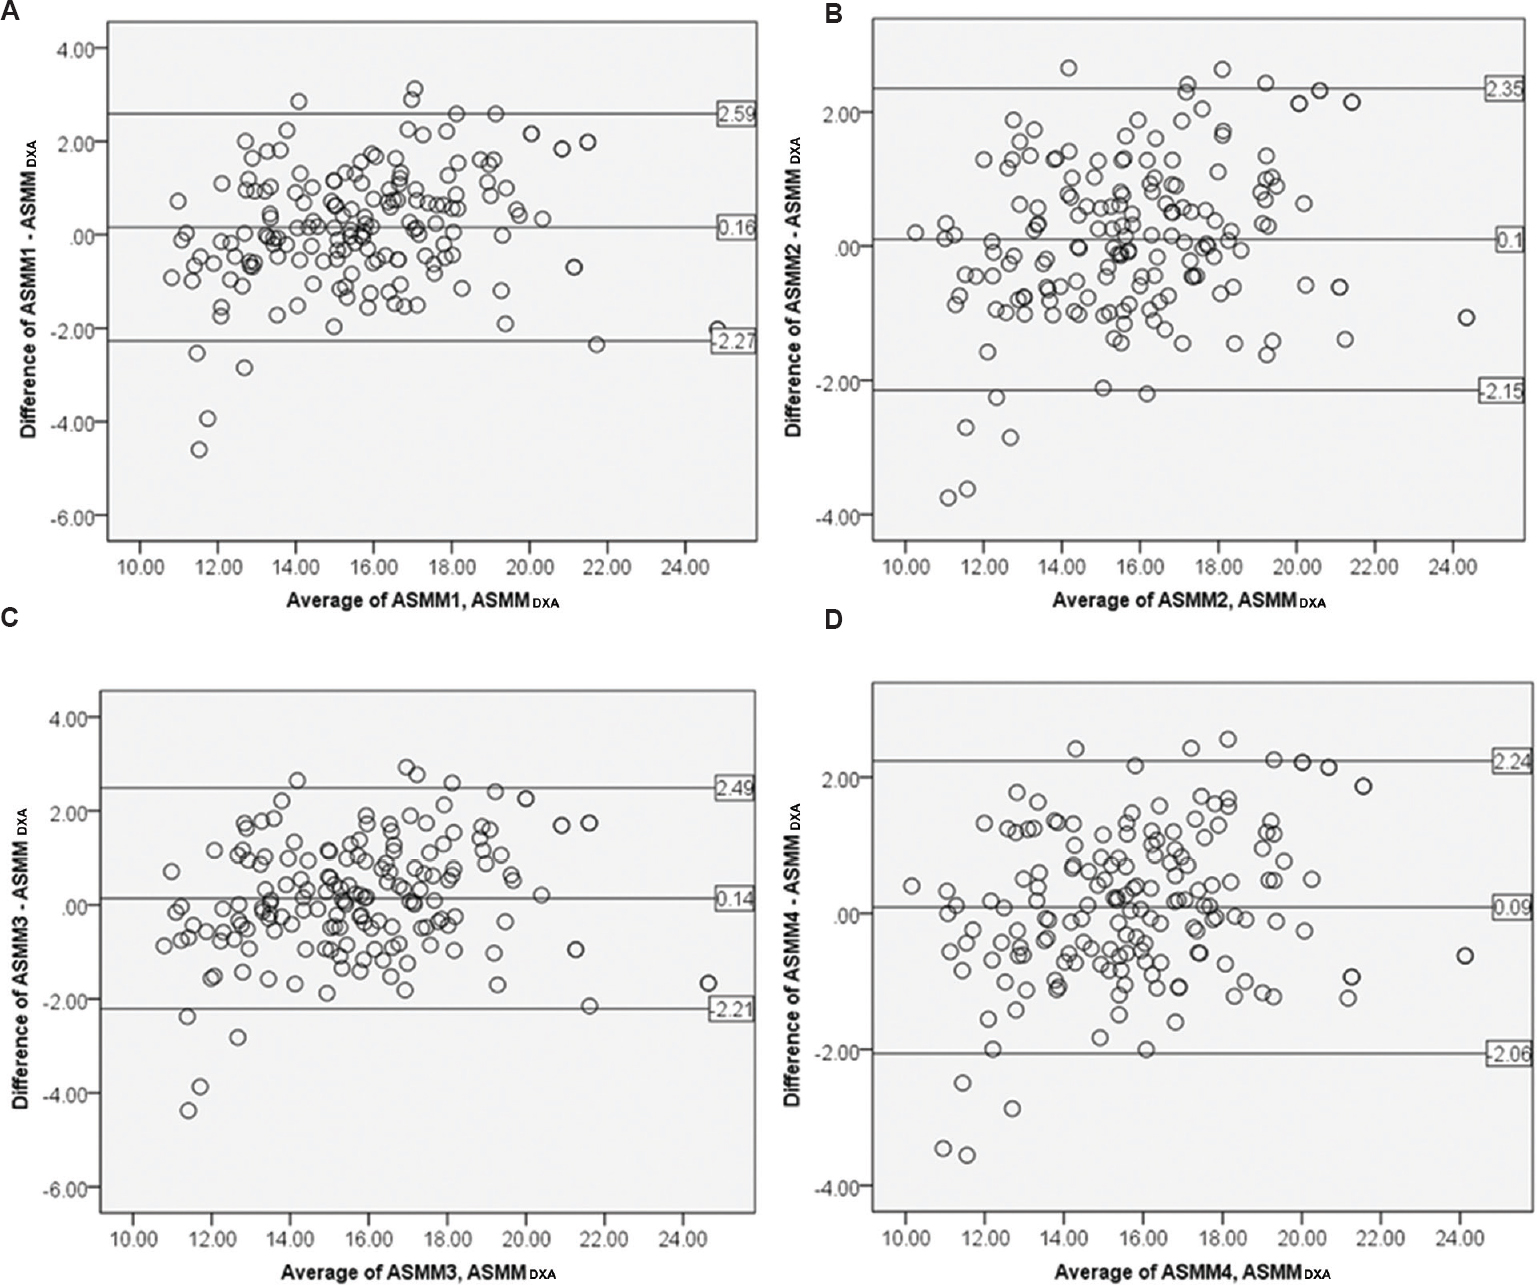
- Agreement between newly developed models and criterion method (ASMMDXA) (n=167). (A) ASMM 1, (B) ASMM 2, (C) ASMM 3, (D) ASMM 4. ASMMDXA, appendicular skeletal muscle mass measured with DXA.
The models derived in regression steps based on BMI in combination with TSFT and MUAC (ASMM 5 and ASMM 6), model based on all the measured limb circumferences and skinfold thicknesses (ASMM 7) and models based on corrected girths and three-dimensional figures (ASMM 8 and ASMM 9), however, did not meet the validation criteria (Table V). The post hoc power calculation test was conducted to calculate the sample power of valid anthropometry models by adopting an error probability of 5 per cent for the sample size used. The sample power (1-β error probability) was 1.00 for all four valid models (ASMM 1-ASMM 4).
Discussion
Of the nine anthropometric models developed to estimate ASMM among middle-aged women, only the four models which were based on height, weight, TSFT age and MS met all the validation criteria. Our results were consistent with previous studies from the USA13, China10, India12 and Japan7 where similar anthropometric measures were used to predict the ASMM. In these analyses, the complex equations which include the skinfold thickness and circumferences have shown improved prediction qualities101213. We, however, did not observe such improvement when skinfold thickness and limb circumferences were included in the models. Our results were more compatible with Chinese10 and Indian12 studies. The subtle differences seen between the studies could be due to many factors. This could partly be due to the differences in the reference standards used. Some have used MRI as the reference standard13 while others have used DXA1012. Variations in the composition of study samples such as ethnicity and age range of individuals13 could also have contributed to such disparities.
Even though studies have shown that BMI predicts the muscle mass28 and used it for ASMM prediction models1415, in our analysis, the models based on BMI failed to meet the validation criteria. Our observation might be due to the combining effect of menopause and age within the models. BMI, however, is a surrogate of body fat content and reflects global adiposity and its association with ASMM would not be strong. Weak association between BMI and ASMM compared to other anthropometric indices has also been reported in previous studies13 in support of the findings of the current study. Further, BMI has been identified as an index that assesses total muscularity, rather than the relative distribution of muscle mass within the total body29, and therefore, BMI is not a proper indicator of ASMM.
Previous studies have used limb girths corrected for local fat content and modified further to reflect the three-dimensional nature of the muscle mass1013. In our data, the uncorrected indices correlated better with ASMMDXA than the corrected limb girths or three-dimensional figures and models developed with corrected indices or three-dimensional figures did not meet validation criteria. This emphasizes the possibility of using models with simple anthropometric indices which can be easily measured, rather than using corrected indices as also highlighted by Wen et al10.
Furthermore, skinfold callipers are generally not used in clinical settings and skinfold thickness and circumferences are associated with high measurement errors and factors such as loss of muscle mass, increased fat mass and loss of skin elasticity can potentially influence the readings30. Therefore, the developed models that include weight and height with age or MS would be more appropriate for the practice than the models that include the skinfold thickness. In our study samples were selected randomly from a semi-urban area of the Galle district which has socio-economic characteristics and disease prevalence similar to national figures31. Hence, the anthropometric models developed can be generalized to middle-aged women in other parts of the country as well.
There were several limitations in our study. This study included only middle-aged women and further studies should be done on other age groups and males. Furthermore, these models need to validated further especially in individuals with co-morbidities to enhance the validity of the models. As we used the DXA manufacturer's routines to estimate the ASMM without resorting the DXA machine for this specific validation, the between-manufacturer variation could potentially limit the application of the mathematical models we proposed to DXA devices by other manufacturers.
In this study, simple predictive models were developed and validated which used different anthropometric measures to quantify the ASMM of middle-aged Sri Lankan women. These models showed a high accuracy and were suitable for research and were clinical settings. The selection of the model can be based on the availability of anthropometric indices in the particular setting.
Acknowledgment
Authors thank Ms Malini Kariyawasam and Ms Rajika Niroshini of DXA scanning unit, Teaching Hospital, Karapitiya, Sri Lanka, for their support.
Financial support & sponsorship: Authors acknowledge the Faculty Research Grant (2014-2015), Faculty of Medicine, University of Ruhuna, Sri Lanka, and the National Research Council (NRC 15-023), Sri Lanka, for providing funds for this study.
Conflicts of Interest: None.
References
- Measurement of lean body mass using bioelectrical impedance analysis: A consideration of the pros and cons. Aging Clin Exp Res. 2017;29:591-7.
- [Google Scholar]
- Postoperative loss of skeletal muscle mass, complications and quality of life in patients undergoing cardiac surgery. Nutrition. 2012;28:40-5.
- [Google Scholar]
- Changes in muscle mass and strength after menopause. J Musculoskelet Neuronal Interact. 2009;9:186-97.
- [Google Scholar]
- Menopause and sarcopenia: A potential role for sex hormones. Maturitas. 2011;68:331-6.
- [Google Scholar]
- Sarcopenia: European consensus on definition and diagnosis: Report of the european working group on sarcopenia in older people. Age Ageing. 2010;39:412-23.
- [Google Scholar]
- Assessment methods in human body composition. Curr Opin Clin Nutr Metab Care. 2008;11:566-72.
- [Google Scholar]
- Development of prediction equations for estimating appendicular skeletal muscle mass in Japanese men and women. J Physiol Anthropol. 2017;36:34.
- [Google Scholar]
- Ethnic differences in the relationship between body mass index and percentage body fat among Asian children from different backgrounds. Br J Nutr. 2011;106:1390-7.
- [Google Scholar]
- Anthropometric equation for estimation of appendicular skeletal muscle mass in Chinese adults. Asia Pac J Clin Nutr. 2011;20:551-6.
- [Google Scholar]
- Total body muscle mass estimation from bioelectrical impedance analysis & simple anthropometric measurements in Indian men. Indian J Med Res. 2008;127:441-6.
- [Google Scholar]
- Development and validation of anthropometric prediction equations for estimation of lean body mass and appendicular lean soft tissue in Indian men and women. J Appl Physiol (1985). 2013;115:1156-62.
- [Google Scholar]
- Total-body skeletal muscle mass: Development and cross-validation of anthropometric prediction models. Am J Clin Nutr. 2000;72:796-803.
- [Google Scholar]
- Development and validation of anthropometric equations to estimate appendicular muscle mass in elderly women. Nutr J. 2013;12:92.
- [Google Scholar]
- Appendicular skeletal muscle mass: Development and validation of anthropometric prediction equations. J Frailty Aging. 2012;1:147-51.
- [Google Scholar]
- Concordance between measured and estimated appendicular muscle mass in adult females. Ceylon Med J. 2015;60:100-2.
- [Google Scholar]
- Executive summary of the stages of reproductive aging workshop + 10: Addressing the unfinished Agenda of staging reproductive aging. Menopause. 2012;19:387-95.
- [Google Scholar]
- Insulin resistance, obesity, and metabolic syndrome among non-diabetic pre – And post-menopausal women in North Taiwan. Int J Obes (Lond). 2006;30:912-7.
- [Google Scholar]
- Biostatistics: A foundation for analysis in the health sciences. New Jersey: John Wiley & Sons, Inc; 2018.
- Anthropometry and body composition. In: Anthropometric standardization reference manual. Champaign, IL: Human Kinetics; 1988. p. :125-9.
- [Google Scholar]
- Anthropometric estimation of muscle mass in men. Med Sci Sports Exerc. 1990;22:729-33.
- [Google Scholar]
- A new formula for population-based estimation of whole body muscle mass in males. Can J Appl Physiol. 1997;22:598-608.
- [Google Scholar]
- 2005. Guidelines for data processing and analysis of the International Physical Activity Questionnaire (IPAQ)-Short and long Forms. IPAQ Research Committee; 17:2008. Available from: https://www.academia.edu/5346814/Guidelines_for_Data_Processing_and_Analysis_of_the_International_Physical_Activity_Questionnaire_IPAQ_Short_and_Long_Forms_Contents
- Validation of regression models: Methods and examples. Technometrics. 1977;19:415-28.
- [Google Scholar]
- Advances in body composition assessment. Champaign, IL: Human Kinetics Publishers; 1992.
- Statistical methods for assessing agreement between two methods of clinical measurement. Lancet. 1986;1:307-10.
- [Google Scholar]
- G*Power 3: A flexible statistical power analysis program for the social, behavioral, and biomedical sciences. Behav Res Methods. 2007;39:175-91.
- [Google Scholar]
- Prevalence of sarcopenia and predictors of skeletal muscle mass in healthy, older men and women. J Gerontol A Biol Sci Med Sci. 2002;57:M772-7.
- [Google Scholar]
- Association between body mass index and muscularity in healthy older Japanese women and men. J Physiol Anthropol. 2013;32:4.
- [Google Scholar]
- Body composition assessed on the basis of arm circumference and triceps skinfold thickness: A new index validated in children by magnetic resonance imaging. Am J Clin Nutr. 1997;65:1709-13.
- [Google Scholar]
- Prevalence of hypertension, diabetes and obesity: baseline findings of a population based survey in four provinces in Sri Lanka. Ceylon Med J. 2005;50:62-70.
- [Google Scholar]


