
Translate this page into:
Cost of screening, out-of-pocket expenditure & quality of life for diabetes & hypertension in India
For correspondence: Dr Shankar Prinja, Department of Community Medicine and School of Public Health, Postgraduate Institute of Medical Education and Research, Chandigarh 160 012, India e-mail: shankarprinja@gmail.com
-
Received: ,
This article was originally published by Wolters Kluwer - Medknow and was migrated to Scientific Scholar after the change of Publisher.
Abstract
Background & objectives:
The Government of India has initiated a population based screening (PBS) for noncommunicable diseases (NCDs). A health technology assessment agency in India commissioned a study to assess the cost-effectiveness of screening diabetes and hypertension. The present study was undertaken to estimate the cost of PBS for Type II diabetes and hypertension. Second, out-of-pocket expenditure (OOPE) for outpatient care and health-related quality of life (HRQoL) among diabetes and hypertension patients were estimated.
Methods:
Economic cost of PBS of diabetes and hypertension was assessed using micro-costing methodology from a health system perspective in two States. A total of 165 outpatients with diabetes, 300 with hypertension and 497 with both were recruited to collect data on OOPE and HRQoL.
Results:
On coverage of 50 per cent, the PBS of diabetes and hypertension incurred a cost of ₹ 45.2 per person screened. The mean OOPE on outpatient consultation for a patient with diabetes, hypertension and both diabetes and hypertension was ₹ 4381 (95% confidence interval [CI]: 3786-4976), ₹ 1427 (95% CI: 1278-1576) and ₹ 3932 (95% CI: 3614-4250), respectively. Catastrophic health expenditure was incurred by 20, 1.3 and 14.8 per cent of patients with diabetes, hypertension and both diabetes and hypertension, respectively. The mean HRQoL score of patients with diabetes, hypertension and both was 0.76 (95% CI: 0.72-0.8), 0.89 (95% CI: 0.87-0.91) and 0.68 (95% CI: 0.66-0.7), respectively.
Interpretations & conclusions:
The findings of our study are useful for assessing cost-effectiveness of screening strategies for diabetes and hypertension.
Keywords
Cost
complications
diabetes
hypertension
out-of-pocket expenditure
quality of life
screening

Given the rising burden, early age of onset and the associated economic burden of non-communicable diseases (NCDs), the Government of India launched the National Programme for Prevention and Control of Cancer, Diabetes, Cardiovascular Diseases and Stroke (NPCDCS) aiming at prevention as well as early detection and treatment of diabetes, hypertension and common cancers. The objectives of the program are to prevent and control common NCDs through behaviour and lifestyle changes and provide early diagnosis and management of common NCDs1. The focus of NPCDCS was to enable opportunistic screening for common NCDs at secondary care level, through setting up of NCD clinics. Further, population based screening (PBS) for NCDs including diabetes, hypertension and the three common cancers (breast, cervical and oral) has been initiated to complement the NPCDCS at primary care level. PBS is envisaged to address issues of low levels of care-seeking, limited access to health services, reaching marginalized groups, in addition to increasing awareness in the community about NCDs and the need for periodic screening. The process of screening includes active population enumeration, risk scoring on the community based assessment checklist (CBAC) by an accredited social health activist (ASHA) and allocation of unique identification number, followed by screening of all individuals above the age of 30 yr at a facility based fixed day camp or through outreach2.
While screening of NCDs has been initiated at a national level, questions arise related to the most efficient or cost-effective screening methodology. To build evidence for these policy decisions, economic evaluations of different strategies need to be undertaken. The Government of India has established a health technology assessment agency called Health Technology Assessment India (HTAIn) to strengthen evidence based policy making3,4. A study was commissioned by the HTAIn to assess the cost-effectiveness of screening for diabetes and hypertension in India. A pre-requisite for such a study involving an economic evaluation for screening strategies for diabetes and hypertension is data on health system costs of screening, out-of-pocket expenditure (OOPE) of patients and health-related quality of life (HRQoL) of diabetes and hypertension patients. While a few studies have been conducted in different parts of the country to assess the implementation of the NPCDCS programme5,6, cost of implementing the PBS has not been assessed. Second, while the National Sample Survey Organization (NSSO) estimates the nationally representative OOPE for outpatient and inpatient care for different illnesses, it is not possible to classify diabetes and hypertension into those with and without complications. Third, the NSSO data do not specifically provide OOPE for those with comorbidity, i.e. diabetes and hypertension, as well as those visiting a tertiary-level hospital. Finally, there is no Indian study on HRQoL of diabetes and hypertension patients using the Euro Quality of Life Questionnaire (EuroQoL), with five dimensions and five-level (EQ-5D-5L) scale tool, which is recommended by the HTAIn for use in economic evaluations.
To address this evidence gap, the current study aimed at determining the health system cost of implementing PBS for diabetes and hypertension, disaggregated OOPE expenditure and HRQoL of patients with diabetes, hypertension, both diabetes and hypertension – both uncomplicated and complicated.
Material & Methods
The study was conducted by the department of Community Medicine & School of Public Health, Postgraduate Institute of Medical Education & Research (PGIMER), Chandigarh, a tertiary care hospital. The study was carried out after approval from the Institute’s Ethics Committee. The investigation comprised three parts namely; costing of population based screening (PBS) of diabetes and hypertension, out-of-pocket expenditure (OOPE) and health-related quality of life (HRQoL) of diabetes and hypertension patients. Assessment of OOPE and HRQoL was done by recruiting outpatients from the departments of Endocrinology and Internal Medicine, PGIMER, Chandigarh. An informed written consent was obtained from all participants.
Data collection
Health system costing: An economic costing for PBS of diabetes and hypertension under the NPCDCS (National Programme for Prevention and Control of Cancer, Diabetes, Cardiovascular Diseases and Stroke) was undertaken using micro-costing methodology and health system perspective7 in one randomly selected district in the States of Haryana and Tamil Nadu. Within each district, one primary health centre and two sub-centres (SCs) were randomly selected for data collection.
The mode of implementation of PBS varied in both States. In Tamil Nadu, population enumeration and first screening were done door-to-door by a woman health volunteer (WHV) appointed for this purpose. Random blood sugar assessment using glucometer and blood pressure measurement using aneroid blood pressure apparatus were done at household level. In Haryana, the population enumeration and risk scoring were performed by accredited social health activist (ASHAs) at household level. The screening of the enumerated population was done in camp mode on a single day involving auxiliary nurse midwives (ANMs) and ASHAs.
The data on all resources utilized for the screening of diabetes and hypertension were collected for one-year period using standardized methodology and tools used for economic costing studies of health facilities in India8-10. The data on human resources involved in screening included designation, leaves in the reference period and gross annual salary. Time allocation for interview was performed for each of the staff members and further validated using actual observation on the day of the survey. A detailed time motion study was carried out to determine the time contribution of different personnel for individual activities at a screening camp. Data on consumables including quantity and unit price were obtained from the stock register. All the equipment (medical as well as non-medical) used to deliver screening services were also noted along with quantity, unit price, expected average life and maintenance charges during the reference period. The procurement price of each of the inputs was obtained from procurement records in the facility or state health department. In a few items where data were not available, market price was used. Since there was wide variation in the wage rate between the two States, a scenario analysis adjusting for the low wages in Tamil Nadu was also performed. The scenario analysis used average health-care worker wages for India from the National Health System Cost data base11.
Out-of-pocket expenditure (OOPE) and health-related quality of life (HRQoL): Outpatients from the departments of Endocrinology and Internal Medicine, were assessed for OOPE and HRQoL. Patients who had at least one previous visit, i.e. who were diagnosed with either diabetes or hypertension and had been on treatment for one month, were included in the study. A total of 165 patients with diabetes, 300 with hypertension and 497 with both were recruited. Data collection was undertaken over five months from October 2018 to February 2019.
Participants were interviewed to collect data on routine demographic information, consumption expenditure, medical diagnosis, number of facility visits and treatment regimen. Detailed information on OOPE incurred during the last outpatient consultation was collected using standard questionnaires used in previous Indian studies12,13. This included expenditure incurred on medicines, diagnostic test, supportive care, procedures, user fees, informal payment and travel and boarding/food in the last visit to the facility in the last one month.
HRQoL was evaluated using the EQ-5D-5L scale14 and the visual analogue scale (VAS).
Data analysis:
Health system costing: Costs were categorized into two types, namely capital and recurrent costs. In the case of capital items, the annualized cost was estimated using the average lifespan of item and a discount rate of three per cent15. Recurrent costs such as personnel salaries, medicines, consumables and overhead expenses were estimated by multiplying price/wage rate and quantity of resource used. Shared costs were apportioned for individual services using appropriate allocation statistics (Table I).
| Input resources | Source of data | Form of data | Methods used to annualize/annual cost | Allocation criteria used for joint costs |
|---|---|---|---|---|
| Capital items | ||||
| Building/space | Facility observation and measurement | Observation | Estimated the floor size of constructed area multiplied by local commercial rental price | Shared areas apportioned on the basis of duration for which space was used for screening activities |
| Equipment | Record review (stock register), facility observation | Stock registers | Annualization factor multiplied by purchase price plus annual maintenance cost | Shared equipment costs were apportioned on the basis of the number of individuals screened |
| Non-consumables (includes table, chair, water cooler, tube lights, etc.) | Record review (stock register), facility observation | Stock registers | Annualization factor multiplied by purchase price plus annual maintenance cost | Shared non-consumable items were apportioned on the basis of the number of individuals screened |
| Recurrent items | ||||
| Human resources | Record review, interview, facility observation | Payslips, interviews | Salary multiplied by the proportion of time spent in a year on screening activities | Proportional time spent on various activities |
| Drugs and consumables (stationery, sanitary items, etc.) | Record review | Stock register | Annual amount of drugs/consumables and price data | Proportion of individuals screened |
| Overheads utilities | ||||
| Electricity | Record review | Monthly electricity bills | Annual consumption of electricity in cardiac centre | Proportional time for which the space was used for screening activities |
| Water supply | Record review | Monthly water bills | Annual consumption of water in each cost centre | Floor area |
Unit costs were calculated for screening individuals for diabetes and hypertension as per PBS. Further, cost of screening for diabetes and hypertension individually was calculated by classifying costs into two types of screening. Costs of equipment and consumables for each type of screening were considered separately. Costs such as human resource time and supervisory, training and IEC-cost were assumed to be the same, irrespective of type of screening. Pooled unit cost was generated from unit costs of different facilities standardizing for coverage. While adjusting for coverage, equipment, human resources, training cost, IEC cost and supervisory cost were considered as fixed cost and hence kept constant, the variable cost such as consumables and overheads were varied with number of people screened.
OOPE: Mean OOPE expenditure per outpatient consultation was computed. Multiple linear regression was performed to assess the factors associated with OOPE on outpatient care among patients with diabetes and hypertension. The independent variables included in regression were age of the patient, gender, marital status, educational status, employment status, insurance status, wealth quartiles, disease status, presence of complications and disease control status. The model was assessed for multicollinearity and goodness of fit. Results are reported as beta coefficient, confidence intervals (CIs) for odds ratio (O.R.), t test value, P value and adjusted R square value.
Catastrophic health expenditure (CHE) was computed using a capacity to pay approach16. Capacity to pay was defined as the income remaining after meeting basic sustenance needs. To calculate subsistence expenditure, a poverty cut-off was derived as the average food expenditure of households whose food share was in the range of 45th-55th percentile. Subsistence expenditure was adjusted for household size using beta value of 0.56. Capacity to pay was computed as the income remaining after excluding basic sustenance expenditure. Households whose medical expenditure exceeded 40 per cent of the capacity to pay were considered to suffer CHE. Annual OOPE for outpatient care was estimated by taking into account median number of outpatient visits and OOPE on medicine and non-medicine expenses (such as travel, lodging and user free). Frequency of outpatient visits was as reported by patients and was used to estimate the annual number of visits. OOPE on medicine was assumed to be incurred on a monthly basis, while the non-medicine OOPE was incurred only at each outpatient visit.
Annual OOPE on outpatient care = (OOPE for medicine×12)+(non-medicine–related OOPE×median outpatient visits per year)
Binary logistic regression was performed to assess the independent factors determining CHE among patients with diabetes and hypertension. The variables included in regression were age, gender, marital status, educational status, employment status, insurance status, wealth quartiles, disease status, presence of complications and disease control status. The Enter method was used to run the regression model. The model was assessed for multicollinearity and goodness of fit. Results are reported as OR, CIs for OR, Wald’s statistic and P value.
HRQoL: Health states generated from the scoring on the EQ-5D-5L were converted into utility scores using the Thailand value set17. Scoring on the VAS was converted into utility scores by dividing them by 100. Mean scores were generated individually from EQ-5D-5L and VAS, for patients with diabetes, hypertension and both diabetes and hypertension. Scores were also generated for those with and without complications (such as retinopathy, nephropathy, neuropathy, heart disease, stroke and amputation).
Results
Health system cost of screening:’The per capita health system cost of PBS for diabetes, hypertension and both diabetes and hypertension at sub centre level in Haryana was ₹ 92 (US $ 1.32), 70 (US $ 1.00) and 130 (US $ 1.86), respectively, and in Tamil Nadu these were ₹ 22 (US $ 0.31), 13 (US $ 0.19) and 25 (US $ 0.36), respectively. The pooled unit cost of PBS for diabetes, hypertension and both diabetes and hypertension screening at 50 per cent screening coverage was ₹ 38.4 (US $ 0.55), 16.2 (US $ 0.23) and 45.2 (US $ 0.65), respectively (Figure).
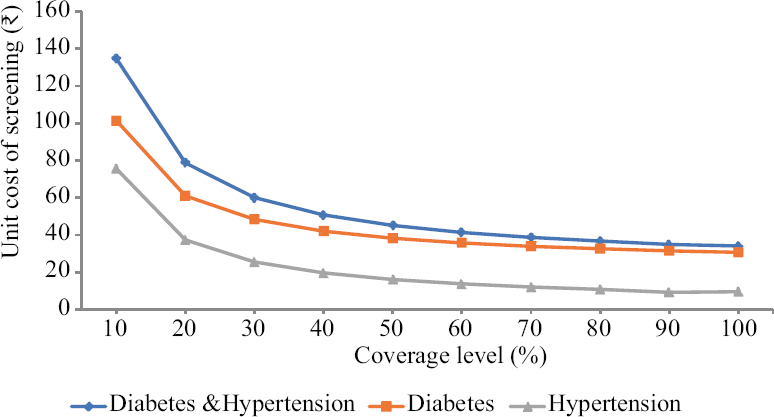
- Unit cost of screening by level of population-wide coverage.
In the scenario analysis using a national average wage for healthcare workers in Tamil Nadu, it was observed that the unit cost for screening of diabetes, hypertension and both diseases in Tamil Nadu changed to ₹ 65.7 (US $ 0.94), 56.3 (US $ 0.81) and 80.65 (US $ 1.15) respectively. The adjusted pooled estimates for unit cost of screening of diabetes, hypertension and both diseases were ₹ 53.5 (US $ 0.77), 31.1 (US $ 0.44) and 65.0 (US $ 0.93), respectively.
OOPE: Table II outlines the OOPE per outpatient consultation by socioeconomic and clinical factors. The mean OOPE of a patient with diabetes visiting a tertiary care facility was ₹ 4381 (95% CI: 3786-4976). The mean OOPE for a patient with diabetes with and without complications was ₹ 6007 (95% CI: 3832-8181) and ₹ 3990 (95% CI: 3484-4496), respectively. Similarly, for hypertension, the mean overall OOPE on outpatient consultation was ₹ 1427 (95% CI: 1278-1576), which varied from ₹ 1710 (95% CI: 1198-2223) to ₹ 1392 (95% CI: 1238-1547) among patients with and without complications. It was observed that OOPE was higher among older patients, those belonging to higher richer wealth quintile, those with complications and those with uncontrolled disease status.
| Factors | n | Mean OOPE (95% CI) | Median | CHE (%) |
|---|---|---|---|---|
| Socioeconomic factors | ||||
| Gender | ||||
| Male | 494 | 3230 (2901-3558) | 2260 | 10.5 |
| Female | 464 | 3211 (2940-3481) | 2510 | 12.5 |
| Age | ||||
| 18-35 | 66 | 1883 (1351-2415) | 935 | 6.1 |
| 36-45 | 158 | 2711 (2062-3359) | 1847 | 7.6 |
| 46-55 | 246 | 3268 (2859-3676) | 2375 | 13.0 |
| 56-65 | 304 | 3570 (3193-3948) | 2805 | 11.2 |
| >65 | 183 | 3556 (3121-3990) | 3000 | 14.2 |
| Wealth quartile | ||||
| I (poorest) | 299 | 2578 (2325-2832) | 1960 | 23.1 |
| II | 301 | 3081 (2786-3367) | 2550 | 3.0 |
| III | 163 | 4192 (3347-5036) | 2750 | 4.3 |
| IV (richest) | 107 | 4184 (3465-4904) | 3060 | 0.9 |
| Clinical factors | ||||
| Diabetes | 165 | 4381 (3786-4976) | 3500 | 20.0 |
| Without complications | 133 | 3990 (3484-4496) | 3400 | 18.0 |
| With complications | 32 | 6007 (3832-8181) | 3960 | 28.1 |
| Hypertension | 300 | 1427 (1278-1576) | 1010 | 1.3 |
| Without complications | 267 | 1392 (1238-1547) | 1000 | 1.5 |
| With complications | 33 | 1710 (1198-2223) | 1210 | 0.0 |
| Diabetes and hypertension | 497 | 3932 (3614-4250) | 3090 | 14.8 |
| Without complications | 318 | 3537 (3178-3895) | 2945 | 13.8 |
| With complications | 175 | 4688 (4079-5297) | 3290 | 16.0 |
| Complications | ||||
| Absent | 718 | 2823 (2614-3033) | 2120 | 10.2 |
| Present | 240 | 4455 (4241-4669) | 3200 | 15.7 |
| Disease control status | ||||
| Controlled | 309 | 3035 (2692-3379) | 2185 | 9.7 |
| Uncontrolled | 634 | 3289 (3016-3562) | 2510 | 12.5 |
| Treatment regimen amongst diabetes and diabetes and hypertension | ||||
| Insulin based | 257 | 4889 (4418-5359) | 3760 | 19.5 |
| Oral hypoglycaemics | 405 | 3508 (3169-3848) | 2910 | 13.8 |
| Overall | 962 | 3228 (3015-3441) | 2410 | 11.6 |
CI, confidence interval; CHE, catastrophic health expenditure
The CHE was estimated to have been incurred among 20, 1.3 and 14.8 per cent of the patients with diabetes, hypertension and both diabetes and hypertension, respectively. Further, the percentage of patients experiencing CHE was higher in patients suffering from complications and among those with uncontrolled disease, across the three conditions. An increasing pattern was observed with an increase in the number of complications suffered by patients in both OOPE and CHE (Supplementary Table I).
| Complication | n | Mean OOPE | 95% CI | Mean QoL (EQ-5D-5L) | 95% CI | Mean QoL (VAS) | 95% CI | |||
|---|---|---|---|---|---|---|---|---|---|---|
| Lower limit | Upper limit | Lower limit | Upper limit | Lower limit | Upper limit | |||||
| One complication | ||||||||||
| Retinopathy | 63 | 3536 | 2768 | 4304 | 0.71 | 0.68 | 0.74 | 0.67 | 0.62 | 0.72 |
| Neuropathy | 16 | 3095 | 976 | 5214 | 0.55 | 0.48 | 0.62 | 0.60 | 0.49 | 0.71 |
| Heart disease | 56 | 3926 | 3074 | 4779 | 0.71 | 0.68 | 0.74 | 0.67 | 0.63 | 0.72 |
| Stroke | 3 | 4340 | 2466 | 6214 | 0.67 | 0.45 | 0.88 | 0.73 | 0.67 | 0.80 |
| Nephropathy | 41 | 5391 | 3318 | 7465 | 0.64 | 0.59 | 0.70 | 0.66 | 0.61 | 0.72 |
| Foot ulcer | 17 | 5472 | 3635 | 7309 | 0.48 | 0.42 | 0.55 | 0.60 | 0.52 | 0.69 |
| Foot amputation | 2 | 3810 | 1948 | 5672 | 0.49 | 0.52 | 0.65 | 0.53 | 0.52 | 0.58 |
| Any one complication | 198 | 4176 | 3967 | 4385 | 0.66 | 0.62 | 0.7 | 0.73 | 0.71 | 0.74 |
| Two complications | ||||||||||
| Heart disease and retinopathy | 5 | 5064 | 2078 | 8050 | 0.55 | 0.20 | 0.91 | 0.58 | 0.54 | 0.62 |
| Amputation and foot ulcer | 1 | 1350 | - | - | 1.00 | - | - | 0.75 | - | - |
| Foot ulcer and retinopathy | 3 | 5027 | 4862 | 5192 | 0.75 | 0.50 | 1.00 | 0.65 | 0.50 | 0.80 |
| Heart and foot ulcer | 1 | 2000 | - | - | 0.39 | - | - | 0.60 | - | - |
| Heart and nephropathy | 5 | 6326 | 1869 | 10,783 | 0.56 | 0.23 | 0.78 | 0.68 | 0.58 | 0.78 |
| Heart and neuropathy | 1 | 3500 | - | - | 0.17 | 0.22 | 0.89 | 0.50 | - | - |
| Heart and stroke | 3 | 3790 | 1701 | 5879 | 0.74 | 0.60 | 0.89 | 0.58 | 0.50 | 0.67 |
| Nephropathy and neuropathy | 3 | 3823 | 1339 | 6307 | 0.44 | 0.35 | 0.53 | 0.65 | 0.39 | 0.91 |
| Nephropathy and retinopathy | 6 | 9717 | 4406 | 15,027 | 0.62 | 0.56 | 0.67 | 0.53 | 0.30 | 0.75 |
| Neuropathy and retinopathy | 3 | 2240 | 1950 | 2530 | 0.71 | 0.57 | 0.86 | 0.57 | 0.11 | 1.02 |
| Any two complications | 31 | 5379 | 3830 | 6927 | 0.61 | 0.5 | 0.72 | 0.6 | 0.53 | 0.67 |
| Multiple complications | ||||||||||
| Heart, amputation and foot ulcers | 1 | 9110 | - | - | -0.14 | - | - | 0.50 | - | - |
| Heart, nephropathy and retinopathy | 2 | 9470 | 4296 | 14,644 | 0.53 | 0.51 | 0.55 | 0.55 | 0.45 | 0.65 |
| Heart, nephropathy and stroke | 1 | 9000 | - | - | -0.17 | - | - | 0.25 | - | - |
| Heart, neuropathy and retinopathy | 1 | 2000 | - | - | 0.59 | - | - | 0.70 | - | - |
| Nephropathy, neuropathy and retinopathy | 3 | 5133 | 3420 | 6847 | 0.60 | 0.57 | 0.63 | 0.57 | 0.44 | 0.70 |
| Nephropathy, neuropathy and stroke | 1 | 1210 | - | - | 0.26 | - | - | 0.60 | - | - |
| Nephropathy, retinopathy and amputation | 1 | 3750 | - | - | 0.27 | - | - | 0.75 | - | - |
| Nephropathy, retinopathy, heart, amputation and foot ulcer | 1 | 16,000 | - | - | 0.41 | - | - | 0.40 | - | - |
| Three or more complications | 11 | 6855 | 6728 | 6983 | 0.35 | 0.18 | 0.51 | 0.55 | 0.46 | 0.63 |
CI, confidence interval; QoL, quality of life; EQ-5D-5L, Euro quality of life questionnaire with five dimensions and five-level scale; VAS, Visual analogue scale
Wealth quartile, disease condition and presence of complications were found to be associated with higher OOPE (P<0.05; Table III). OOPE was significantly lower in patients with hypertension as compared to diabetes patients and patients with both (beta coefficient –0.286, P<0.001).
| Variable | Standardized beta coefficient | T | P |
|---|---|---|---|
| Demographic variables | |||
| Gender | −0.011 | −0.271 | 0.786 |
| Age group | 0.037 | 1.09 | 0.276 |
| Marital status | 0.017 | 0.532 | 0.595 |
| Education | 0.053 | 1.515 | 0.13 |
| Employment status | −0.049 | −1.11 | 0.267 |
| Financial variables | |||
| Insurance status | −0.017 | −0.472 | 0.637 |
| Wealth quartile | 0.152 | 4.825 | <0.001 |
| Disease classification | |||
| Diabetes | 0.1 | 2.961 | 0.003 |
| Hypertension | −0.296 | −8.152 | <0.001 |
| Presence of complications | |||
| Present | 0.192 | 5.922 | <0.001 |
| Disease control status | |||
| Glycaemic control | 0.029 | 0.91 | 0.363 |
Adjusted R2: 0.207
The odds of incurring CHE was 1.8 times higher in females and those with complications as compared to males and those without complications, respectively (Table IV). The odds of incurring CHE was highest among patients with diabetes and least in patients with hypertension. The odds of incurring CHE was 36.5 times higher in the poorest quintile as compared with the richest quartile (P<0.001).
| Variable | Categories | Wald’s statistic | P | OR | OR (95% CI) | |
|---|---|---|---|---|---|---|
| Lower | Upper | |||||
| Demographic variables | ||||||
| Gender | Male | Reference | ||||
| Female | 3.098 | 0.078 | 1.819 | 0.934 | 3.54 | |
| Age group | 18-35 | 0.984 | 0.912 | Reference | ||
| 36-45 | 0.575 | 0.448 | 0.573 | 0.136 | 2.417 | |
| 46-55 | 0.255 | 0.613 | 0.707 | 0.185 | 2.711 | |
| 56-65 | 0.09 | 0.764 | 0.814 | 0.213 | 3.117 | |
| >65 | 0.061 | 0.804 | 0.839 | 0.21 | 3.356 | |
| Marital status | Married | Reference | ||||
| Unmarried | 0.661 | 0.416 | 1.457 | 0.588 | 3.612 | |
| Education | Illiterate | 2.523 | 0.641 | Reference | ||
| Up to primary | 1.083 | 0.298 | 1.784 | 0.6 | 5.308 | |
| Up to secondary | 1.676 | 0.195 | 1.728 | 0.755 | 3.954 | |
| Graduation | 0.228 | 0.633 | 1.277 | 0.468 | 3.485 | |
| Post-graduation | 1.296 | 0.255 | 2.066 | 0.592 | 7.205 | |
| Employment status | Employed | Reference | ||||
| Unemployed | 0.359 | 0.549 | 0.81 | 0.406 | 1.616 | |
| Financial variables | ||||||
| Insurance status | Insured | Reference | ||||
| Uninsured | 0.037 | 0.847 | 1.067 | 0.551 | 2.069 | |
| Wealth quartile | Richest | 63.869 | Reference | |||
| Poorest (I) | 12.268 | <0.001 | 36.468 | 4.874 | 272.858 | |
| II | 1.63 | 0.202 | 3.858 | 0.486 | 30.65 | |
| III | 1.342 | 0.247 | 3.568 | 0.415 | 30.692 | |
| Clinical variables | ||||||
| Disease condition | Hypertension | 29.283 | <0.001 | Reference | ||
| Diabetes | 29.268 | <0.001 | 23.311 | 7.449 | 72.946 | |
| Diabetes + hypertension | 20.492 | <0.001 | 12.924 | 4.268 | 39.139 | |
| Presence of complications | Complications absent | Reference | ||||
| Complications present | 3.534 | 0.06 | 1.761 | 0.976 | 3.175 | |
| Disease control status | Controlled | Reference | ||||
| Uncontrolled | 0.222 | 0.637 | 1.159 | 0.627 | 2.143 | |
| Treatment | Insulin based | Reference | ||||
| Non-insulin based | 10.514 | 0.001 | 2.562 | 1.451 | 4.523 | |
Hosmer and Lemeshow test: χ2 3.981; Degrees of freedom 8; Significance 0.859. OR, odds ratio; CI, confidence interval
HRQoL: The mean HRQoL score for diabetes patients with and without complications was 0.61 (95% CI: 0.53-0.69) and 0.8 (95% CI: 0.76-0.84), respectively. Similarly, the mean HRQoL score for patients of hypertension with and without complications was 0.78 (95% CI: 0.76-0.8) and 0.9 (95% CI: 0.88-0.92), respectively, and for those with both diabetes and hypertension with and without complications was 0.62 (95% CI: 0.58-0.66) and 0.72 (95% CI: 0.68-0.76), respectively. The quality of life of patients was lower in patients with complications, patients with uncontrolled disease and patients who were on insulin-based treatment (Table V). Further, the distribution of levels reported of different domains in the tool was also assessed (Supplementary Table II).
| Factors | n | Mean HRQoLEQ-5D-5L (95% CI) | n | Mean HRQoLVAS (95% CI) |
|---|---|---|---|---|
| Socioeconomic factors | ||||
| Gender | ||||
| Male | 488 | 0.81 (0.79-0.83) | 494 | 0.71 (0.69-0.73) |
| Female | 460 | 0.72 (0.70-0.74) | 464 | 0.7 (0.68-0.72) |
| Age | ||||
| 18-35 | 66 | 0.93 (0.89-0.97) | 66 | 0.76 (0.72-0.80) |
| 36-45 | 158 | 0.86 (0.82-0.90) | 50 | 0.75 (0.73-0.77) |
| 46-55 | 244 | 0.77 (0.73-0.81) | 158 | 0.72 (0.70-0.74) |
| 56-65 | 300 | 0.74 (0.70-0.78) | 246 | 0.68 (0.66-0.70) |
| >65 | 180 | 0.67 (0.63-0.71) | 183 | 0.67 |
| Wealth quartile | ||||
| I (poorest) | 299 | 0.77 (0.73-0.80) | 299 | 0.71 (0.70-0.73) |
| II | 301 | 0.76 (0.72-0.80) | 301 | 0.72 (0.70-0.74) |
| III | 163 | 0.78 (0.74-0.82) | 163 | 0.70 (0.68-0.72) |
| IV (richest) | 107 | 0.73 (0.68-0.77) | 107 | 0.70 (0.64-0.70) |
| Clinical factors | ||||
| Diabetes | 165 | 0.76 (0.72-0.80) | 234 | 0.7 (0.68-0.72) |
| Without complications | 133 | 0.8 (0.76-0.84) | 178 | 0.71 (0.69-0.73) |
| With complications | 32 | 0.61 (0.53-0.69) | 56 | 0.66 (0.60-0.72) |
| Hypertension | 300 | 0.89 (0.87-0.91) | 300 | 0.77 (0.75-0.79) |
| Without complications | 267 | 0.9 (0.88-0.92) | 267 | 0.78 (0.76-0.80) |
| With complications | 33 | 0.78 (0.76-0.80) | 33 | 0.72 (0.66-0.78) |
| Diabetes and hypertension | 418 | 0.68 (0.66-0.70) | 428 | 0.66 (0.64-0.68) |
| Without complications | 269 | 0.72 (0.68-0.76) | 273 | 0.68 (0.66-0.70) |
| With complications | 149 | 0.62 (0.58-0.66) | 151 | 0.62 (0.58-0.66) |
| Complications | ||||
| Absent | 710 | 0.81 (0.79-0.83) | 718 | 0.72 (0.70-0.74) |
| Present | 238 | 0.64 (0.60-0.68) | 240 | 0.64 (0.62-0.66) |
| Disease control status | ||||
| Controlled | 305 | 0.80 (0.79-0.82) | 309 | 0.72 (0.70-0.74) |
| Uncontrolled | 629 | 0.75 (0.73-0.77) | 634 | 0.70 (0.68-0.72) |
| Treatment regimen amongst diabetes and diabetes and hypertension | ||||
| Insulin based | 257 | 0.67 (0.63-0.70) | 257 | 0.65 (0.63-0.67) |
| Oral hypoglycaemics | 405 | 0.74 (0.71-0.76) | 405 | 0.69 (0.67-0.71) |
| Overall | 952 | 0.77 (0.75-0.79) | 962 | 0.7 (0.68-0.72) |
CI, confidence interval; EQ-5D-5L, Euro quality of life questionnaire with five dimensions and five-level scale; VAS, visual analogue scale
| Level | Mobility, n (%) | Self-care, n (%) | Usual activities, n (%) | Pain, n (%) | Anxiety, n (%) |
|---|---|---|---|---|---|
| Diabetes | |||||
| 1 | 149 (65) | 181 (79) | 152 (66) | 123 (53) | 173 (75) |
| 2 | 36 (16) | 35 (15) | 42 (18) | 55 (24) | 41 (18) |
| 3 | 29 (13) | 8 (3) | 24 (10) | 32 (14) | 14 (6) |
| 4 | 15 (6) | 6 (3) | 5 (2) | 16 (7) | 2 (1) |
| 5 | 2 (1) | 0 (0) | 7 (3) | 5 (2) | 1 (0) |
| Hypertension | |||||
| 1 | 237 (79) | 268 (89) | 251 (84) | 228 (76) | 290 (97) |
| 2 | 52 (17) | 30 (10) | 45 (15) | 65 (22) | 7 (2) |
| 3 | 9 (3) | 2 (1) | 3 (1) | 5 (2) | 1 (0) |
| 4 | 2 (1) | 0 (0) | 1 (0) | 2 (1) | 1 (0) |
| 5 | 0 (0) | 0 (0) | 0 (0) | 0 (0) | 1 (0) |
| Diabetes and hypertension | |||||
| 1 | 187 (44) | 316 (75) | 232 (55) | 187 (44) | 290 (69) |
| 2 | 143 (34) | 79 (19) | 114 (27) | 139 (33) | 97 (23) |
| 3 | 60 (14) | 19 (4) | 36 (8) | 61 (14) | 30 (7) |
| 4 | 28 (7) | 9 (2) | 20 (5) | 30 (7) | 5 (1) |
| 5 | 6 (1) | 1 (0) | 22 (5) | 6 (1) | 0 (0) |
| Overall | |||||
| 1 | 573 (60) | 765 (80) | 635 (67) | 538 (56) | 753 (79) |
| 2 | 231 (24) | 144 (15) | 201 (21) | 259 (27) | 145 (15) |
| 3 | 98 (10) | 29 (3) | 63 (7) | 98 (10) | 45 (5) |
| 4 | 45 (5) | 15 (2) | 26 (3) | 48 (5) | 8 (1) |
| 5 | 8 (1) | 1 (0) | 29 93) | 11 (1) | 2 (0) |
HRQoL scores and mean OOPE of patients with different complications are provided in Supplementary Table I.
Discussion
NCDs present a significant public health challenge with adverse health effects and economic burden. They not only burden the health system but also push households into poverty owing to the requirement of long term management and treatment. To build evidence to inform policies on screening of diabetes and hypertension, information on cost borne by the health system and patients is required. The first year target of the PBS was 50 per cent coverage of target population2. The pooled screening cost for diabetes and hypertension at 50 per cent coverage was ₹ 45.2 (US $ 0.65). The unit cost of screening declined with rise in coverage and plateaued at 70 per cent population coverage. A wide variation was observed in screening cost in the two States (Haryana and Tamil Nadu), attributable to the mode of implementation. First, the primary screening in Tamil Nadu was done at household level compared to camp or facility-based mode in Haryana. Second, human resource cost contributed to 75-90 per cent cost in Haryana as compared to 27-35 per cent in Tamil Nadu (
The estimates of HRQoL for patients with diabetes were found to be consistent with other studies in Canada, Norway, Japan and the Netherlands, which reported utility scores of 0.76 (95% CI: 0.58-0.94), 0.85 (95% CI: 0.82-0.87), 0.88 (95% CI: 0.85-0.91) and 0.81 (95% CI: 0.8-0.82) among uncomplicated patients and 0.7 (95% CI: 0.5-0.9), 0.73 (95% CI: 0.69-0.78), 0.85 (95% CI: 0.82-0.97) and 0.61 (95% CI: 0.59-0.63) among complicated patients20-23. The HRQoL estimates for patients with hypertension in our study were in keeping with a study in Nepal, reporting HRQoL of 0.87 (95% CI: 0.86-0.89) and 0.64 (95% CI: 0.51-0.77) on EQ-5D-3L and VAS, respectively24. The quality of life of patients with complications and those with uncontrolled disease was observed to be lower across all disease groups, as reported by a number of other studies20,22,25, highlighting the need to focus on treatment compliance and prevention of development of complications amongst diabetes and hypertension patients.
The present study also assessed OOPE per outpatient consultation for patients with diabetes and hypertension. Patients with diabetes had the highest OOPE followed by patients with both diabetes and hypertension. While the difference between OOPE amongst diabetes patients and those with both diabetes and hypertension was not statistically significant (P=0.176), possible reasons for this difference were explored. The samples of both disease groups were similar in age distribution, socioeconomic status, education, insurance status and other demographic variables. It was noted that the average duration of disease amongst the diabetes group was 21.3 yr as compared with 12.4 yr among the group with both diseases. It has been reported by multiple studies that a longer duration of illness amongst diabetes patients is associated with difficulty in achieving glycaemic control, requirement of more and higher doses of medication26,27. Such medication is associated with higher costs. This is reflected by the average monthly OOPE on medicines of patients with diabetes (₹ 2936) and those with diabetes and hypertension (₹ 2500). This is consistent with another study from India which reported that expenditure increased with duration of diabetes26. An increasing trend in OOPE was observed with the presence of complications (Table II) and the number of complications (Supplementary Table I); this was in keeping with other studies that reported expenditure proportionately increasing with the number of complications28,29. Furthermore, the input-wise distribution of OOPE was assessed (Supplementary Table III) and majority (63%) of the expenditure was found to be incurred on medicines, which is consistent with a number of other studies in India28,29.
| OOPE component | Diabetes | Hypertension | D and HTN | Overall |
|---|---|---|---|---|
| Travel | 0.13 | 0.27 | 0.18 | 0.17 |
| Medicines | 0.68 | 0.62 | 0.59 | 0.64 |
| Lab diagnostics | 0.16 | 0.10 | 0.19 | 0.16 |
| Supportive care procedures | 0.000 | 0.000 | 0.004 | 0.002 |
| User fee/hospital charges | 0.001 | 0.005 | 0.002 | 0.002 |
| Informal payments | 0.000 | 0.000 | 0.000 | 0.000 |
| Boarding/lodging/food | 0.02 | 0.01 | 0.03 | 0.02 |
| Other expenses | 0.00 | 0.00 | 0.00 | 0.00 |
OOPE, out-of-pocket expenditure; D, diabetes; HTN, hypertension
Policy implications: This study highlights a few operational and programmatic considerations with regard to PBS of diabetes and hypertension. The Tamil Nadu model was observed to have more effective implementation in limited resources. The recently announced health and wellness centres (HWCs) under the Ayushman Bharat programme30 could help in smooth implementation of PBS with better coverage and resources. The adverse effects of comorbidity of diabetes and hypertension in terms of poor HRQoL and economic burden was clearly established in the present study, highlighting the importance of screening for both conditions together and continued treatment to prevent progression to complications.
Our investigation, however, had certain limitations. First, the OOPE and HRQoL estimates were generated from a cross-sectional sample drawn from one tertiary level public healthcare facility in north India; thus, the study results could have limited generalizability. However, this facility has patient footfall from more than six Indian States and as a result represents the heterogeneity in terms of geography, rural and urban distribution, severity of disease and socioeconomic status. As a result, there is little possibility of any selection bias resulting from a hospital based sample. Further, the findings of this study do not comment upon prevalence, incidence and long term management of NCDs since it was a one time survey. Long term consequences of the financial hardship should be assessed in future studies using a cohort study design to understand the implications pertaining to individuals and households. Second, the EQ-5D-5L health states were covered into utility scores using the Thailand tariff value set due to the absence of an Indian value set. Third, health system cost data on resources such as training, IEC and supervision were collected using a top-down approach from the state level and apportioned to the facility at which the costing was being performed. Finally, the overall cost of management for diabetes and hypertension would require an assessment of health system costs, which is not the objective of the present study. A more comprehensive assessment of health system costs and OOPE would help in determining the overall economic burden of diabetes and hypertension.
To conclude, the current study findings can be used to further undertake cost-effectiveness analysis to determine the ideal interval of screening, mode of screening and diagnostic test. The cost estimates after incorporation of estimates of health system cost as well may be used for determining the reimbursement package rates under various publicly financed health insurance schemes in India. The present study also highlights the rising economic burden of NCDs, largely borne by the patients, which calls for steps in the direction of health system strengthening such as establishment of HWCs.
Financial support and sponsorship
The study was funded by the Department of Health Research, Ministry of Health and Family Welfare, Government of India.
Conflicts of interest
None.
Supplementary Figure
Supplementary Figure Input-wise distribution of screening cost in sub-centres of Tamil Nadu and Haryana.References
- 2013. Ministry of Health and Family Welfare, Government of India. National programme for prevention and control of cancer, diabetes, cardiovascular diseases & stroke (NPCDCS) – Operational Guidelines. Available from: https://main.mohfw.gov.in/sites/default/files/Operational.Guidelines.of.NPCDCS.%28Revised-2013-17%29_1.pdf
- 2017. Training module for medical officers for prevention, control and population level screening of hypertension, diabetes and common cancer (Oral, Breast & Cervical). Available from: https://main.mohfw.gov.in/sites/default/files/Training.Module.for.Medical.Officers.for.Prevention%2C.Control.and.Population.Level.Screening.of.NCDs_1.pdf
- Health technology assessment for policy making in India: Current scenario and way forward. Pharmacoecon Open. 2018;2:1-3.
- [Google Scholar]
- Institutionalising health technology assessment: Establishing the Medical Technology Assessment Board in India. BMJ Glob Health. 2017;2:e000259.
- [Google Scholar]
- Assessment of implementation of the national programme for the prevention and control of cancer, diabetes, cardiovascular diseases, and stroke at subcenters of Belagavi taluka: A cross-sectional study. Indian J Health Sci Biomed Res. 2019;12:21.
- [Google Scholar]
- A study on implementation of national programme for prevention and control of cancer, diabetes, cardiovascular diseases and stroke in Udupi district, Karnataka. Int J Community Med Public Health. 2018;5:2384-7.
- [Google Scholar]
- Methods for the economic evaluation of health care programme. (3rd ed). Available from: https://pure.york.ac.uk/portal/en/publications/methods-for-the-economic-evaluation-of-health-care-programme-third-edition(e43f24cd-099a-4d56-97e6-6524afaa37d1)/export.html
- Cost of trauma care in secondary- and tertiary-care public sector hospitals in North India. Appl Health Econ Health Policy. 2017;15:681-92.
- [Google Scholar]
- Cost of treatment of valvular heart disease at a tertiary hospital in North India: Policy implications. Pharmacoecon Open. 2019;3:391-402.
- [Google Scholar]
- Cost analysis of implementing mHealth intervention for maternal, newborn &child health care through community health workers: Assessment of ReMIND program in Uttar Pradesh, India. BMC Pregnancy Childbirth. 2018;18:390.
- [Google Scholar]
- Addressing the cost data gap for universal healthcare coverage in India: A call to action. Value Health Reg Issues. 2020;21:226-9.
- [Google Scholar]
- Cost of intensive care treatment for liver disorders at tertiary care level in India. Pharmacoecon Open. 2018;2:179-90.
- [Google Scholar]
- Out-of-pocket expenditure for health care: District level estimates for Haryana state in India. Int J Health Plann Manage. 2019;34:277-93.
- [Google Scholar]
- The EuroQol Group. EQ-5D-3L valuation. Available from: https://euroqol.org/eq-5d-instruments/eq-5d-3l-about/valuation/
- The international decision support initiative reference case for economic evaluation: An aid to thought. Value Health. 2016;19:921-8.
- [Google Scholar]
- Household catastrophic health expenditure: A multicountry analysis. Lancet. 2003;362:111-7.
- [Google Scholar]
- The EQ-5D-5L valuation study in Thailand. Expert Rev Pharmacoecon Outcomes Res. 2018;18:551-8.
- [Google Scholar]
- Estimating the unit costs of healthcare service delivery in India: Addressing information gaps for price setting and health technology assessment. Appl Health Econ Health Policy. 2020;18:699-711.
- [Google Scholar]
- Cost of delivering secondary healthcare through the public sector in India. Pharmacoecon Open. 2020;4:249-61.
- [Google Scholar]
- Estimation of the impact of diabetes-related complications on health utilities for patients with type 2 diabetes in Ontario, Canada. Qual Life Res. 2011;20:939-43.
- [Google Scholar]
- Health-related quality of life in diabetes: The associations of complications with EQ-5D scores. Health Qual Life Outcomes. 2010;8:18.
- [Google Scholar]
- Measurement of HRQL using EQ-5D in patients with type 2 diabetes mellitus in Japan. Value Health. 2006;9:47-53.
- [Google Scholar]
- Health-related quality of life and treatment satisfaction in Dutch patients with type 2 diabetes. Diabetes Care. 2002;25:458-63.
- [Google Scholar]
- Factors associated with health-related quality of life among hypertensive patients in Kathmandu, Nepal. Front Cardiovasc Med. 2017;4:69.
- [Google Scholar]
- Health related quality of life in patients with type 2 diabetes mellitus in Iran: A national survey. PLoS One. 2012;7:e44526.
- [Google Scholar]
- Factors that correlate with poor glycemic control in type 2 diabetes mellitus patients with complications. Osong Public Health Res Perspect. 2018;9:167-74.
- [Google Scholar]
- Factors associated with poor glycemic control among patients with type 2 diabetes. J Diabetes Complications. 2010;24:84-9.
- [Google Scholar]
- Increasing expenditure on health care incurred by diabetic subjects in a developing country: A study from India. Diabetes Care. 2007;30:252-6.
- [Google Scholar]
- Out-of-pocket expenditure on diabetes care in an urban population of Tamil Nadu: A community based study. Int J Adv Community Med. 2019;2:125-30.
- [Google Scholar]
- Ministry of Health & Family Welfare, Government of India. Ayushman Bharat-Health and Wellness Centre. Available from: https://ab-hwc.nhp.gov.in/


