
Translate this page into:
Comparison of pneumonia severity scores for patients diagnosed with pneumonia in emergency department
For correspondence: Dr Seda Ozkan, Department of Emergency Medicine, Istanbul University-Cerrahpasa, Cerrahpasa Faculty of Medicine, Istanbul 34098, Turkey e-mail: sedacil@gmail.com
-
Received: ,
This is an open access journal, and articles are distributed under the terms of the Creative Commons Attribution-NonCommercial-ShareAlike 4.0 License, which allows others to remix, tweak, and build upon the work non-commercially, as long as appropriate credit is given and the new creations are licensed under the identical terms.
This article was originally published by Wolters Kluwer - Medknow and was migrated to Scientific Scholar after the change of Publisher.
Abstract
Background & objectives:
Sepsis due to pneumonia or pneumonia itself is one of the main causes of deaths in patients despite the advanced treatment methods. The optimal prognostic tool in pneumonia is still not clear. This study was aimed to compare the pneumonia severity scores and the possibility of using the new scores in patients who were diagnosed with pneumonia in the emergency department.
Methods:
Demographic data, laboratory and imaging results, confusion, elevated blood urea nitrogen, respiratory rate and blood pressure plus age ≥65 yr (CURB-65), pneumonia severity index (PSI), national early warning score (NEWS), NEWS-lactate (NEWS-L) scores, hospitalization, referral, discharge and 30-day mortality of patients who were diagnosed with pneumonia in emergency department were recorded.
Results:
A total of 250 patients were included in the study. The most successful score in predicted mortality was found to be NEWS-L. This was followed by NEWS, CURB-65 and PSI, respectively. Most successful scores in anticipation of admission to the intensive care unit were NEWS-L followed by NEWS. This was followed by CURB-65 and PSI scores, respectively. The most successful score in anticipation of hospital admission was NEWS-L, followed by NEWS, CURB-65 and PSI, respectively. There was a significant difference between all pneumonia severity scores of the patients who died and survived within 30 days. There was a significant difference between the scores of patients in intensive care unit (ICU) and service, compared to non-ICU patients.
Interpretation & conclusions:
NEWS-L score was found to be the most successful score in predicting mortality, ICU admission and hospitalization requirement. Both NEWS-L and NEWS scores can be used in determining the mortality, need for hospitalization and intensive care of the patients with pneumonia in the emergency department.
Keywords
Emergency department
hospitalization
mortality
pneumonia
pneumonia severity scores
prognosis

Pneumonia is responsible for a significant proportion of hospital admissions, treatment costs, loss of work and school days and deaths123. Various scores have been sought to determine the relationship between the clincial findings and the laboratory tests of the patients with the severity of pneumonia and thus predict the need for hospitalization, admission into intensive care and/or mortality45. Confusion, elevated blood urea nitrogen, respiratory rate and blood pressure plus age ≥65 yr (CURB-65) and pneumonia severity index (PSI) scores are the most commonly used scores67. PSI score assesses hospitalization and mortality by evaluating the patient's demographic information, clinical findings, laboratory findings and co-morbid illnesses and categorizes the patient in a risk group of 1-55. CURB-65 evaluates the patients' consciousness, blood urea level, systolic blood pressure, respiratory rate and age6. Studies345678 comparing PSI and CURB-65 have shown that short-term mortality is more consistently determined by PSI. However, PSI is not as easy to calculate as CURB-65 and its variables are different8.
National early warning score (NEWS) is a relatively new score that includes systolic blood pressure, respiratory rate, heart rate, fever, consciousness and oxygen saturation level9. NEWS-lactate (NEWS-L) is another scoring system, in which the data of the NEWS score and the lactate level are evaluated together9. The purpose of establishing these two scores was to determine the clinical prognosis in a practical way. Better results were obtained with these two scoring systems, which included vital signs10.
The number of studies comparing NEWS and NEWS-L with other scores is limited. This study was aimed to compare pneumonia severity scores in patients who were diagnosed with pneumonia in the emergency department and to investigate the utility of new scores.
Material & Methods
This study was carried out at the Emergency department of Ankara Dışkapı Yıldırım Beyazıt Training and Research Hospital, Ankara, Turkey. The study was approved by the local ethical committee and written informed consent was obtained from each participant. All consecutive patients over 18 years of age who were diagnosed with community-acquired pneumonia between October 1, 2015 and May 1, 2016 were included in this study. The minimum sample size required in this study was 234.
Patients with new or worsening of pre-existing infiltration in the chest X-ray and at least two of the symptoms associated with pneumonia (cough, sputum, dyspnoea and pleuritic chest pain) with significant laboratory findings were included. Those with hospital-acquired pneumonia, aspiration pneumonia, pulmonary tuberculosis, pulmonary oedema, and pulmonary thromboembolism were excluded. During the study period, 314 patients diagnosed with pneumonia were recruited. Thirteen patients with hospital-acquired pneumonia and 29 patients with aspiration pneumonia were excluded from the study. A total of 272 patients who met the criteria were included. Twenty two patients who met the study criteria were lost to follow up. Vital signs, biochemistry, complete haemogram, arterial blood gas values, chest X-ray findings, accompanying diseases, consciousness status, age, gender and treatment of the patients were recorded. CURB-65, PSI, NEWS and NEWS-L scores of the patients were calculated. All variables requiring the calculation of the score systems were obtained from the routine examinations of the patients. Patients who were diagnosed with pneumonia in the emergency department were discharged home, hospitalized into the general ward or admitted into ICU depending on their clinical conditions. The follow up and treatment of patients included in this study were not affected by the risk score calculated. The intensive care admission criteria (threatened airway, respiratory rate ≥40 or ≤8 breaths/min, oxygen saturation <90 per cent on ≥50 per cent, respiratory and cardiac arrests, pulse rate <40 or >140 beats/min, systolic blood pressure <90 mmHg, fall in the level of consciousness, rising arterial carbon dioxide with respiratory acidosis) were used in determining whether intensive care was required. The hospital records and national healthy notification system were used for investigating the outcome at 30 days. Telephone call was made for follow up if no record was found from the above two systems. Calculation of risk scores is shown in Tables I and II.
| Physiologic component | 3 | 2 | 1 | 0 | 1 | 2 | 3 |
|---|---|---|---|---|---|---|---|
| SBP (mmHg) | ≤90 | 91-100 | 101-110 | 111-219 | ≥220 | ||
| PR (beats/min) | ≤40 | 41-50 | 51-90 | 91-110 | 111-130 | ≥131 | |
| RR (breaths/min) | ≤8 | 9-11 | 12-20 | ≥25 | |||
| Body temperature (°C) | ≤35 | 35.1-36 | 36.1-38 | 38.1-39 | ≥39, 1 | ||
| SpO2 (%) | ≤91 | 92-93 | 94-95 | 96 | |||
| Any supplemental oxygen | Yes | No | |||||
| Level of consciousness | Alert | Voice, pain, unresponsive | |||||
| Laboratory component | |||||||
| Lactate level | When calculating the NEWS-L score, serum lactate level is added on the score of the NEWS score | ||||||
| NEWS risk class: Score | |||||||
| I: 0-4 | Low risk | ||||||
| II: 5-6 | Moderate risk | ||||||
| III: ≥7 | High risk | ||||||
| NEWS-L risk class: Score | |||||||
| I: 0-3 | Low risk | ||||||
| II: 3.1-5.2 | Low risk | ||||||
| III: 5.3-8.0 | Moderate risk | ||||||
| IV: ≥8.1 | High risk | ||||||
SBP, systolic blood pressure; PR, pulse rate; RR, respiratory rate, SpO2, peripheral oxygen saturation; NEWS, national early warning score; NEWS-L, national early warning score-lactate. Source: Ref. 4
| CURB-65 | Points |
|---|---|
| Confusion | 1 |
| Blood urea nitrogen >20 mg/dl | 1 |
| Respiratory rate >29 breaths per minute | 1 |
| SBP <90 mmHg or diastolic blood pressure ≤60 mmHg | 1 |
| Age ≥65 yr | 1 |
| Score | |
| 0-1: Low risk | Outpatient |
| 2: Moderately severe | Hospitalization required |
| 3-5: Severe pneumonia | Hospitalization required; consider ICU admission |
| PSI | |
| Characteristic | Points |
| Age-men | yr |
| Age-Women | yr-10 |
| Nursing home resident | 10 |
| Comorbidity | |
| Neoplastic disease | 10 |
| Liver disease | 20 |
| Congestive heart disease | 10 |
| Cerebrovascular disease | 10 |
| Renal disease | 10 |
| Examination | |
| Altered mental state | 20 |
| Respiratory rate ≥30 breaths per minute | 20 |
| SBP <90 mmHg | 20 |
| Temperature <35°C or ≥40°C | 15 |
| Pulse ≥125 | 10 |
| Laboratory findings | |
| Arterial pH <7.35 | 30 |
| Urea ≥30 mg/dl | 20 |
| Na <130 mg/dl | 20 |
| Glucose ≥250 mg/dl | 10 |
| Hct <30% | 10 |
| PaO2 <60 mmHg or SaO2 (air) <90% | 10 |
| Pleural effusion | 10 |
| PSI risk class: Score | |
| I: <50 | Outpatient |
| II: 51-70 | Outpatient |
| III: 71-90 | Outpatient or short inpatient |
| IV: 91-130 | Hospitalization required |
| V: >130 | Hospitalization required |
PSI, pneumonia severity index; Hct, haematocrit; PaO2, partial oxygen pressure. Source: Ref. 3
Statistical analysis: Statistical Package for the Social Sciences (SPSS) programme (IBM SPSS Statistics for Windows, version 17.0, SPSS Inc, Chicago, IL) was used to analyze the obtained information. Kolmogorov-Smirnov test was used in groups with >30 patients in the analysis of normality of the data, and the Shapiro-Wilk test was used in those <30. The Mann-Whitney U-test was used to compare data that did not fit the normal distribution, and the Student's t test was used to compare data with a normal distribution.
Med Calc statistic software programme (Med Calc Software, version 15, Mariakerke, Belgium) was used for the analysis of receiver operating characteristic (ROC) curves to compare the performance of the pneumonia risk scores in predicting mortality, need of admission into hospital and intensive care unit (ICU). The area under the ROC curves (AUC) was calculated. Variables with risk scores were defined if a two-sided P value was 0.05 or less; 95 per cent confidence intervals (CIs) were calculated. The method of DeLong et al11 was used to calculate the standard error of the area under the curve. An exact binomial Ci was calculated for the area under the curve. Youden index was used to determine the optimal cut-off value, sensitivity and specificity on a ROC curve (Youden index J is defined as J=max (sensitivityc+specificityc−1). The cut-point that achieved this maximum was referred to as the optimal cut-point (c). Correlation tests of normally distributed data were performed by Spearman correlation test.
Results
The study included 250 patients. Mean age was 72.3±14.25 yr and 41.6 (n=104) per cent of the patients were females chronic obstructive pulmonary disease (COPD) was the most common associated (39.2%) comorbid diseases (Table III). Of these, 23.6 per cent (n=59) of the patients were ex-smokers and 6.8 per cent (n=17) were active smokers.
| Parameters | All patients | Survived | Dead | P | Hospitalized | Non-hospitalized | P | ICU admission | Non-ICU admission | P |
|---|---|---|---|---|---|---|---|---|---|---|
| Age† | 76;20 | 76; 20 | 77; 18 | 0.46 | 78;18 | 73;19 | 0.01 | 78; 16 | 76; 22 | 0.02 |
| SBP (mmHg)# | 125.1±27.4 | 127.5±26.2 | 104.4±30.6 | 0.001 | 122.5±28.8 | 128.7±25.6 | 0.03 | 117.4±32.0 | 128.5±32.2 | 0.01 |
| DBP (mmHg)# | 73.3±15.4 | 74.9±14.7 | 60.1±16.1 | 0.001 | 72.8±16.1 | 74.0±14.7 | 0.52 | 70.5±17.5 | 75.4±13.9 | 0.16 |
| PR (beats/min)# | 97.5±22.7 | 95.42±20.76 | 114.1±27.8 | 0.001 | 97.9±23.2 | 96.8±21.1 | 0.81 | 102.9±26.6 | 94.9±19.6 | 0.01 |
| RR (breaths/min)† | 22;4 | 21; 4 | 27; 12 | 0.001 | 22;5 | 20;2 | 0.001 | 24; 6 | 22;2 | 0.001 |
| Body temperature (°C)# | 37.2±0.8 | 37.3±0.8 | 37.2±0.8 | 0.43 | 37.3±0.8 | 37.3±0.8 | 0.71 | 37.3±0.8 | 37.2±0.8 | 0.50 |
| SpO2 (%)# | 87.1±9.1 | 88.4±8.0 | 78.1±12.3 | 0.001 | 85.2±10.2 | 90.3±6.2 | 0.001 | 83.2±11.6 | 83.3±11.6 | 0.08 |
| AVPU# | 1;0.699 | 1; 1 | 2; 1 | 0.001 | 1;1 | 1;0 | 0.001 | 2; 1 | 1;0 | 0.001 |
| Blood urea nitrogen (mg/dl)# | 65.5±46.2 | 61.4±43.4 | 96.2±56.7 | 0.001 | 74.5±47.0 | 51.4±41.6 | 0.001 | 83.9±52.1 | 63.5±27.7 | 0.01 |
| Creatinine (mg/dl)# | 1.3±0.8 | 1.3±0.7 | 1.8±1.1 | 0.01 | 1.4±0.8 | 1.2±0.7 | 0.09 | 1.5±0.9 | 1.2±0.5 | 0.29 |
| Glucose (mg/dl)# | 151.1±69.2 | 149.9±68.9 | 164.6±76.6 | 0.53 | 155.8±72.8 | 145.2±64.8 | 0.17 | 154.8+71.1 | 156.9±71.1 | 0.98 |
| ALT (IU/l)# | 39.6±125.4 | 31.7±48.2 | 102.4±355.4 | 0.04 | 50.7±162.7 | 22.9±23.5 | 0.02 | 61.5±211.8 | 49.5±119.9 | 0.02 |
| AST (IU/l)# | 47.9±140.0 | 38.7±73 | 122±369.5 | 0.001 | 62.9±181.3 | 25.8±16.6 | 0.001 | 74.2±220.5 | 37.9±66.2 | 0.24 |
| Sodium (mmol/l)# | 137±6.5 | 136.6±6.3 | 140.2±7.6 | 0.02 | 137.4±7.6 | 136.4±4.6 | 0.17 | 138.5±9.0 | 136.1±5.2 | 0.06 |
| pH# | 7.36±0.10 | 7.37±0.09 | 7.29±0.12 | 0.001 | 7.37±0.11 | 7.39±0.07 | 0.001 | 7.32±0.13 | 7.37±0.08 | 0.001 |
| pCO2 (kPa)# | 43.2±17.3 | 43.3±17.2 | 43.1±18.9 | 0.5 | 45.9±20.7 | 39.2±9.4 | 0.01 | 48.3±25.8 | 48.3±12.0 | 0.59 |
| pO2 (kPa)# | 57.8±23.6 | 58.8±23.6 | 49.8±23.1 | 0.01 | 55.3±24.2 | 61.5±22.5 | 0.001 | 58.5±21.5 | 54.0±19.3 | 0.65 |
| HCO3 (mmol/l)# | 24.6±6.1 | 25.0±6.0 | 20.4±6.1 | 0.001 | 24.7±6.6 | 24.3±5.3 | 0.97 | 23.7±7.1 | 25.8±6.0 | 0.05 |
| Lactate (mmol/l)# | 2.7±2.0 | 2.4±1.5 | 5.2±3.5 | 0.001 | 3.0±2.4 | 2.2±1.2 | 0.02 | 3.5±2.8 | 2.4±1.8 | 0.001 |
| Base deficit (mmol/l)# | -0.2±5.51 | 3.7±3.6 | 5.8±5.3 | 0.001 | 4.2±4.0 | 3.5±3.7 | 0.05 | 5.3±4.7 | 3.0±2.5 | 0.001 |
| SAT O2 (%)# | 81.7±12.1 | 82.6±11.3 | 73.4±15.6 | 0.001 | 79.5±12.8 | 84.6±10.5 | 0.001 | 78.8±14.3 | 80.3±10.9 | 0.94 |
| WBC (µl)# | 12611.4±6630.1 | 12873.9±6641.4 | 11301.0±6272.3 | 0.43 | 12862.5±6687.4 | 12461.6±6515.2 | 0.48 | 12752±6891.7 | 12992.5±6487.5 | 0.96 |
| Haematocrit (%)# | 38.7±6.8 | 38.8±6.5 | 38.0±8.6 | 0.42 | 38.0±6.8 | 39.8±6.7 | 0.15 | 37.6±7.5 | 38.5±5.9 | 0.38 |
| Haemoglobin (g/dl)# | 12.6±2.2 | 12.6±2.0 | 12.3±2.9 | 0.56 | 12.4±2.1 | 12.9±2.1 | 0.061 | 12.3±2.3 | 12.4±1.9 | 0.6 |
| Comorbidity, n (%) | ||||||||||
| COPD pulmonary disease, n (%) | 98 (39.2) | 91 (92.9) | 7 (7.1) | 0.13 | 55 (56.1) | 43 (43.9) | 0.37 | 22 (40) | 33 (60) | 0.01 |
| Hypertension, n (%) | 97 (38.8) | 86 (88.7) | 11 (11.3) | 0.83 | 62 (63.9) | 35 (36.1) | 0.27 | 33 (53.2) | 29 (46.8) | 0.92 |
| Diabetes mellitus, n (%) | 61 (24.4) | 53 (86.9) | 8 (13.1) | 0.50 | 45 (73.8) | 16 (26.2) | 0.01 | 18 (40) | 27 (60) | 0.03 |
| Cardiovascular disease, n (%) | 45 (18) | 37 (82.2) | 8 (17.8) | 0.09 | 28 (62.2) | 17 (37.8) | 0.69 | 15 (53.6) | 13 (46.4) | 0.98 |
| Congestive heart failure, n (%) | 31 (12.4) | 27 (87.1) | 4 (12.9) | 0.76 | 21 (67.7) | 10 (32.3) | 0.32 | 9 (42.9) | 12 (57.1) | 0.28 |
| Cerebrovascular disease, n (%) | 26 (10.4) | 22 (84.6) | 4 (15.4) | 0.43 | 16 (61.5) | 10 (38.5) | 0.83 | 14 (87.5) | 2 (12.5) | 0.01 |
| Neoplastic disease, n (%) | 19 (7.6) | 17 (89.5) | 2 (10.5) | 1.00 | 11 (57.9) | 8 (42.1) | 0.9 | 5 (45.5) | 6 (55.5) | 0.75 |
| Chronic renal disease, n (%) | 15 (6) | 12 (80) | 3 (20) | 0.21 | 7 (46.7) | 8 (53.3) | 0.42 | 7 (100) | 0 | 0.01 |
| Chronic liver disease, n (%) | 2 (0.8) | 2 (100) | 0 | 1.00 | 1 (50) | 1 (50) | 1.00 | 0 | 1 (100) | 0.46 |
| Ex-smoker, n (%) | 59 (23.6) | 57 (96.6) | 2 (3.4) | 0.05 | 31 (52.5) | 28 (47.5) | 0.20 | 10 (32.3) | 21 (67.7) | 0.01 |
| Current smoker (%) | 17 (6.8) | 15 (88.2) | 2 (11.8) | 0.70 | 13 (76.5) | 4 (23.5) | 0.20 | 4 (30.8) | 9 (69.2) | 0.14 |
| Radiographic findings | ||||||||||
| Pleural effusion, n (%) | 32 (12.8) | 29 (90.6) | 3 (9.4) | 1.00 | 27 (84.4) | 5 (15.6) | 0.00 | 13 (48.1) | 14 (51.9) | 0.52 |
| Lobar opacities, n (%) | 187 (74.8) | 169 (90.4) | 18 (9.6) | 0.30 | 110 (58.8) | 77 (41.2) | 0.66 | 56 (50.9) | 54 (49.1) | 0.25 |
| Bilateral opacities, n (%) | 51 (20.4) | 45 (88.2) | 6 (11.8) | 0.80 | 33 (64.7) | 18 (35.3) | 0.40 | 21 (63.6) | 12 (36.4) | 0.19 |
†Median, IQR; #mean±SD. DBP, diastolic blood pressure; COPD, chronic obstructive pulmonary disease; ALT, alanine transaminase; AST, aspartate transaminase; HCO3, bicarbonate; AVPU, alert-verbal-pain-unresponsive; SAT O2, oxygen saturation; pCO2, partial pressure of carbon dioxide; pO2, partial pressure of oxygen
Pleural effusion on chest radiograph was detected in 12.8 per cent (n=32) patients, lobar infiltration was detected in 74.8 per cent (n=187) patients and bilateral infiltration was detected in 20.4 per cent (n=51) patients (Table III). Bronchodilator therapy was started with antibiotics in 246 of the patients in the Emergency department. One hundred and one patients were discharged from emergency services with medical therapy. One hundred and forty nine patients were hospitalized, 69 were admitted to the wards, while 80 patients were admitted to the ICU. Mortality was seen in 27 patients during the 30 days of follow up period.
The mean values of the risk scores in the three outcome groups are shown in Table IV. NEWS-L was the most successful in predicting 30-day mortality with a value of 0.96 AUC (95% CI: 0.928-0.981, cut-off value: 13.7). This was followed by NEWS, CURB-65 and PSI, respectively (Fig. 1 and Table V. Pneumonia severity scores were compared between those who died and survived within 30 days of follow up. Significant difference was found in all scores (Table IV). There was a significant difference between the other parameters except age, fever, glucose, pCO2, white blood cell (WBC), haemoglobin (Hb) and haematocrit (Hct) values with regard to 30-day mortality (Table III).
| Scores | All | Dead (n=27) | Survived (n=223) | P | ICU admission (n=80) | Non-ICU admission (n=69) | P | Hospitalized (n=149) | Non-hospitalized (n=101) | P |
|---|---|---|---|---|---|---|---|---|---|---|
| CURB-65 (mean±SD) | 2.1±0. 8 | 3.11±0.75 | 1.96±0.75 | 0.001 | 2.81±0, 79 | 1.76±0.54 | 0.001 | 2.32±0.86 | 1.73±0.63 | 0.001 |
| Class 1 | 54 (21.6) | 1 (3.7) | 53 (23.8) | 5 (6.3) | 20 (29) | 25 (16.8) | 29 (28.7) | |||
| Class 2 | 130 (52) | 2 (7.4) | 128 (57.4) | 18 (22.5) | 47 (68.1) | 65 (43.6) | 65 (64.4) | |||
| Class 3 | 66 (26.4) | 24 (88.9) | 42 (18.8) | 57 (71.3) | 2 (2.9) | 59 (39.6) | 7 (6.9) | |||
| PSI (mean±SD) | 123.5±26.2 | 139.18±23.18 | 121.59±25.86 | 0.001 | 132.11±23.78 | 125.37±22.17 | 0.11 | 128.99±23.22 | 115.37±28.23 | 0.001 |
| Class 1 | 14 (5.6) | 1 (3.7) | 13 (5.8) | 2 (2.5) | 2 (2.9) | 4 (2.7) | 10 (9.9) | |||
| Class 2 | 1 (0.4) | - | 1 (0.4) | - | 1 (1.4) | 1 (0.8) | - | |||
| Class 3 | 16 (6.4) | - | 16 (7.6) | 5 (6.3) | 5 (7.2) | 10 (6.7) | 6 (5.9) | |||
| Class 4 | 149 (59.6) | 12 (44.4) | 137 (61.4) | 39 (48.8) | 43 (62.3) | 82 (55) | 67 (66.3) | |||
| Class 5 | 70 (28) | 14 (51.9) | 56 (25.1) | 34 (42.5) | 18 (26.1) | 52 (34.9) | 18 (17.9) | |||
| NEWS (mean±SD) | 5.9±3.1 | 10.29±2.50 | 5.38±2, 73 | 0.001 | 8.62±2.63 | 4.85±2.13 | 0.001 | 6.87±3.05 | 4.49±2.61 | 0.001 |
| Class 1 | 79 (31.6) | - | 79 (35.4) | 2 (2.5) | 26 (37.7) | 28 (18.8) | 51 (50, 5) | |||
| Class 2 | 61 (24.4) | 1 (3.7) | 60 (26.9) | 11 (13.8) | 26 (37.7) | 37 (24.8) | 24 (23.8) | |||
| Class 3 | 110 (44) | 26 (96.3) | 84 (37.7) | 67 (83.8) | 17 (24.6) | 84 (56.4) | 26 (25.7) | |||
| NEWS-L (mean±SD) | 8.6±4.0 | 15.48±3.34 | 7.75±3.20 | 0.001 | 12.06±3.80 | 7.31±2.91 | 0.001 | 9.86±4.15 | 6.71±2.92 | 0.001 |
| Class 1 | 16 (6.4) | - | 16 (7.2) | - | 3 (4.3) | 3 (2) | 13 (12.9) | |||
| Class 2 | 38 (15.2) | - | 38 (17) | - | 12 (17.2) | 12 (8) | 26 (25.7) | |||
| Class 3 | 61 (24.4) | - | 61 (27.4) | 8 (10) | 27 (39.1) | 35 (23.5) | 26 (25.7) | |||
| Class 4 | 135 (54) | 27 (100) | 108 (48.4) | 72 (90) | 27 (39.1) | 99 (66.4) | 36 (35.6) |
Score values shown as n (%)
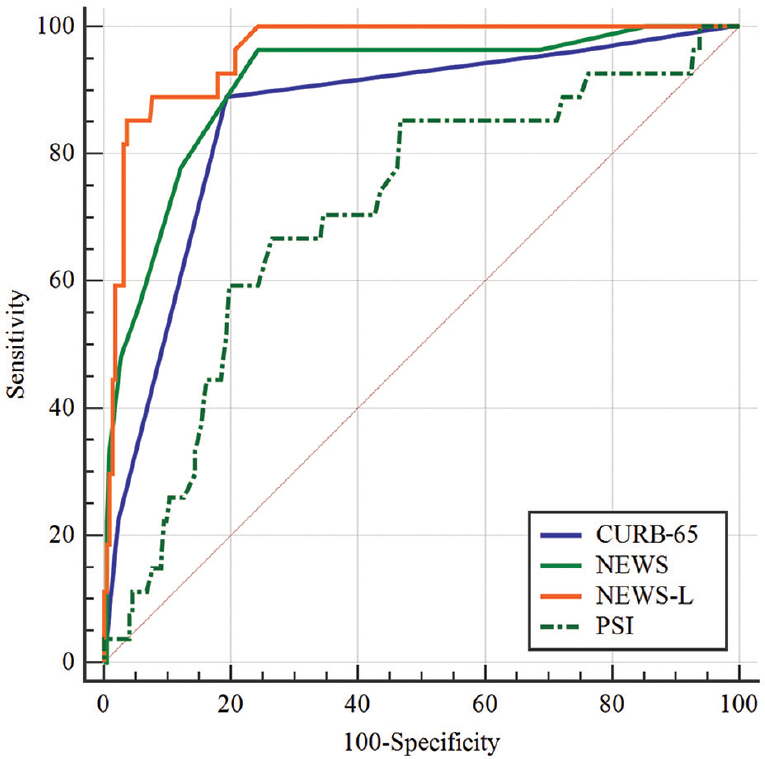
- Comparison of pneumonia severity scores receiver operating characteristic curves for 30-day mortality. CURB-65, confusion, elevated blood urea nitrogen, respiratory rate and blood pressure plus age ≥65 yr; NEWS, national early warning score; NEWS-L, national early warning score-lactate; PSI, pneumonia severity index.
| Scores | AUC | SE | 95% Cl | Sensitivity (%) | Specificity (%) | Cut-off | Youden index J | P |
|---|---|---|---|---|---|---|---|---|
| CURB-65 | 0.86 | 0.037 | 0.809-0.899 | 88.9 | 80.7 | >2 | 0.6961 | <0.001 |
| NEWS | 0.91 | 0.031 | 0.869-0.943 | 96.3 | 75.8 | >7 | 0.7208 | <0.001 |
| NEWS-L | 0.96 | 0.014 | 0.928-0.981 | 85.1 | 96.4 | >13.7 | 0.8160 | <0.001 |
| PSI | 0.71 | 0.054 | 0.645-0.762 | 66.7 | 73.5 | >136 | 0.4021 | <0.001 |
AUC, area under the curve; SE, standard error; CI, confidence interval
| Scores | AUC | SE | 95% Cl | Sensitivity (%) | Specificity (%) | Cut-off | Youden index J | P |
|---|---|---|---|---|---|---|---|---|
| CURB-65 | 0.69 | 0.029 | 0.627-0.745 | 40.3 | 60 | >2 | 0.3334 | <0.001 |
| NEWS | 0.71 | 0.032 | 0.655-0.771 | 77.1 | 53.5 | >4 | 0.3065 | <0.001 |
| NEWS-L | 0.72 | 0.032 | 0.659-0.774 | 69.1 | 63.4 | >7.7 | 0.3249 | <0.001 |
| PSI | 0.64 | 0.035 | 0.580-0.702 | 69.8 | 54.5 | >117 | 0.2425 | 0.001 |
ROC curve analysis was performed for admission to the hospital for pneumonia severity scores. The highest AUC score was for NEWS-L (AUC: 0.72, CI: 0.659-0.774, cut-off value: >7.7), while the highest sensitivity was shown by NEWS (77.1%) and the highest specificity by NEWS-L score (63.4%) (Fig. 2 and Table VI). ROC curve analysis was performed to predict the need for intensive care for all scores. The highest AUC was shown by NEWS (0.86) and NEWS-L (0.86), followed by CURB-65 (0.85). NEWS-L had the highest sensitivity (90%) and CURB-65 had the highest specificity (94.7%) (Fig. 3 and Table VII).
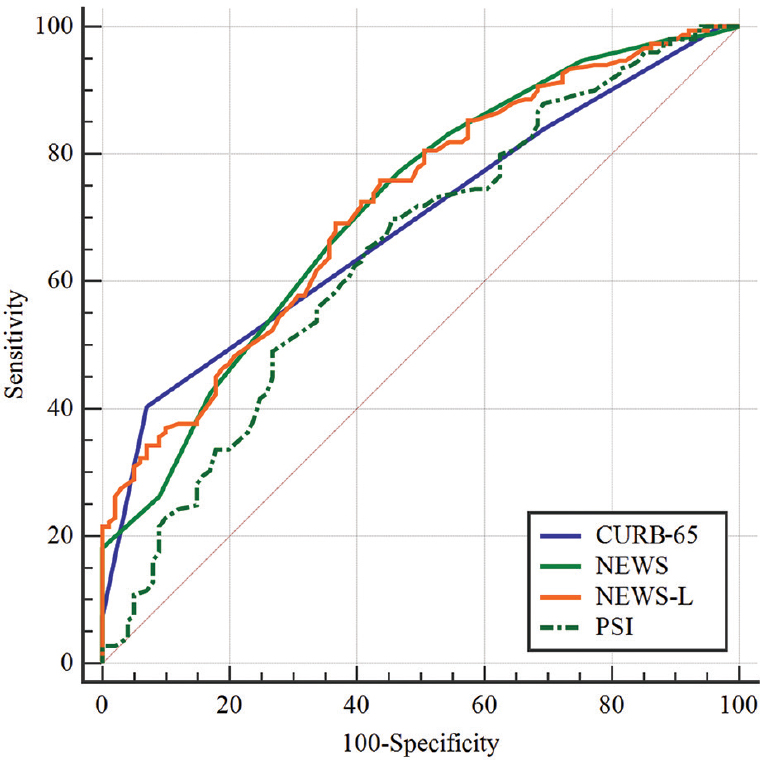
- Comparison of pneumonia severity scores receiver operating characteristic curves for hospitalization.
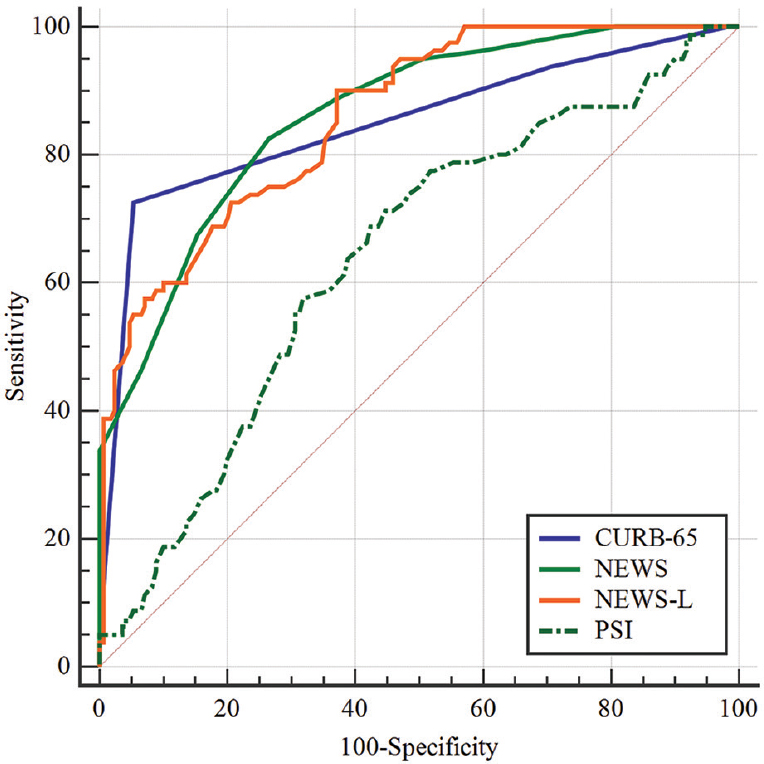
- Comparison of pneumonia severity scores receiver operating characteristic curves for intensive care unit needs.
| Scores | AUC | SE | 95% Cl | Sensitivity (%) | Specificity (%) | Cut-off | Youden index J | P |
|---|---|---|---|---|---|---|---|---|
| CURB-65 | 0.85 | 0.027 | 0.798-0.891 | 72.5 | 94.7 | >2 | 0.6721 | <0.001 |
| NEWS | 0.86 | 0.023 | 0.812-0.901 | 82.5 | 73.5 | >6 | 0.5603 | <0.001 |
| NEWS-L | 0.86 | 0.023 | 0.809-0.699 | 90 | 62.9 | >8 | 0.5294 | <0.001 |
| PSI | 0.64 | 0.037 | 0.577-0.699 | 71.25 | 55.29 | >122 | 0.2654 | 0.001 |
The pneumonia severity scores of the patients admitted to the ICU and ward (non-ICU) were compared, and significant difference was detected among the scores except PSI (Table IV). The pneumonia severity scores of hospitalized patients and patients discharged home were also and a significant difference was observed between all the risk scores (Table IV).
Discussion
In the ROC analysis for 30-day mortality prediction, the NEWS-L score performed the best with a value of 0.96 AUC. It was followed by NEWS and CURB-65 scores, respectively. In a study conducted by Jo et al4, the NEWS-L score was found to be the first rank and the NEWS score was the second rank, consistent with our results. CURB-65 and PSI performed moderately with the latter having a better AUC than the former4. However, in our study, the PSI score was the weakest predictor of mortality. In the PSI score, patients with neoplastic disease history and liver disease were in high risk group5. It was presumed that the blood glucose, Hct and sodium levels used in the evaluation of PSI score were normal at the time of our study, which categorized the patients as low risk. Chen et al12 have found that the use of the CURB-65 score alone predicts the mortality poorly. In a study by Gwak et al13, the mortality rate of patients with PSI scores grades 1 and 2 was 2.4 per cent. Jo et al4 found that vital signs constituted more significant effects in the NEWS and NEWS-L scores than in the PSI and CURB-65 scores, which led to better performance in predicting 30-day mortality. In our study, significant differences were found in all scores when pneumonia severity scores of patients who died in 30 days as with that who survived. Jo et al4 found significant differences between the dead and survivors for NEWS, NEWS-L, CURB-65 and PSI scores. Gwak et al13 also compared the PSI score in the deceased and surviving groups and found a significant difference. Our results were consistent with these studies.
In the ROC analysis for hospitalization of pneumonia severity scores, the NEWS-L score ranked first with an AUC of 0.72, followed by NEWS, CURB-65 and PSI scores, respectively. Chen et al12 calculated an AUC of 0.61 for CURB-65 in ROC analysis for hospitalization. This rate was comparable with our study. These results indicated that the NEWS and NEWS-L scores predicted hospitalization better than the other scores. NEWS and NEWS-L scores ranked first in ROC analysis of all pneumonia severity scores in terms of ICU necessity. Chen et al12 found that ROC analysis value for intensive care requirement of the lactate-CURB-65 combination was better than CURB-65 score alone.
There has been a significant difference between lactate levels of deceased and alive patients in studies conducted in patients with pneumonia121314. Our results were consistent with these studies. All these studies indicate that lactate level plays an important role in the prognosis of patients with pneumonia. As the NEWS-L score includes lactate acid, it performs better than other score in predicting the 30-day mortality, need for hospitalization and intensive care. There was a significant difference between all the scores when the pneumonia severity scores of the patients who were hospitalized were compared with those who received medical therapy at home. These findings were consistent with the study by Chen et al12 for CURB-65.
Our study had some limitations. COPD patients may need additional oxygen as part of the severity of the disease/acute exacerbation. In our study, the presence of 39 per cent COPD patients might have played a role in the success of NEWS and NEWS-L scores more than other scores (PSI and CURB-65). Most validation studies for NEWS score were single-centre studies with a short follow up of patients. Thus, external validity and long-term predictive ability of NEWS remains unknown. As in other studies, only 30-day results were evaluated in our study. Furthermore, NEWS was not designed to a single time point tool but rather a 'track-and-trigger' system in individual patients. Accuracy of NEWS may thus be different if multiple measurements at different time points are considered.
In conclusion, NEWS-L score was found to be the most successful score in predicting mortality, and requirement for ICU admission and hospitalization in our study. NEWS-L and NEWS scores thus can be helpful in determining the mortality, need for hospitalization and intensive care of the patients with pneumonia in the emergency department.
Financial support & sponsorship: None.
Conflicts of Interest: None.
References
- Turkish Thoracic Society Consensus Report on diagnosis and treatment of community acquired pneumonia. Turk Toraks Dergisi. 2009;10:1-16.
- [Google Scholar]
- Lancet. 1985;2:699-701.
- Diagnosis and treatment of adults with community-acquired pneumonia.An official clinical practice guideline of the American Thoracic Society and Infectious Diseases Society of America. Am J Respir Crit Care Med. 2019;200:e45-67.
- [Google Scholar]
- Validation of modified early warning score using serum lactate level in community-acquired pneumonia patients.The national early warning score-lactate score. Am J Emerg Med. 2016;34:536-41.
- [Google Scholar]
- Risk prediction models for mortality in community acquired pneumonia: A systematic review. Biomed Res Int. 2013;2013:504136.
- [Google Scholar]
- Defining community acquired pneumonia severity on presentation to hospital: An international derivation and validation study. Thorax. 2003;58:377-82.
- [Google Scholar]
- A prediction rule to identify low-risk patients with community-acquired pneumonia. N Engl J Med. 1997;336:243-50.
- [Google Scholar]
- ViEWS - Towards a national early warning score for detecting adult inpatient deterioration. Resuscitation. 2010;81:932-7.
- [Google Scholar]
- Modified early warning score with rapid lactate level in critically ill medical patients: The ViEWS-L score. Emerg Med J. 2013;30:123-9.
- [Google Scholar]
- Comparing the areas under two or more correlated receiver operating characteristic curves: A nonparametric approach. Biometrics. 1988;44:837-45.
- [Google Scholar]
- Lactate on emergency department arrival as a predictor of mortality and site of care in pneumonia patients: A cohort study. Thorax. 2015;70:404-10.
- [Google Scholar]
- Initial serum lactate level is associated with inpatient mortality in patients with community-acquired pneumonia. Am J Emerg Med. 2015;33:685-90.
- [Google Scholar]
- Clinical significance of dynamic monitoring of blood lactic acid, oxygenation index and C reactive protein levels in patients with severe pnuemonia. Exp Ther Med. 2015;10:1824-28.
- [Google Scholar]


