
Translate this page into:
Comparative analysis of Luminex-based donor-specific antibody mean fluorescence intensity values with complement-dependent cytotoxicity & flow crossmatch results in live donor renal transplantation
Reprint requests: Dr Narinder Mehra, Dr C.G. Pandit National Chair and Former Dean (Research), All India Institute of Medical Sciences, Ansari Nagar, New Delhi 110 029, India e-mail: narin.mehra@gmail.com
-
Received: ,
This is an open access article distributed under the terms of the Creative Commons Attribution-NonCommercial-ShareAlike 3.0 License, which allows others to remix, tweak, and build upon the work non-commercially, as long as the author is credited and the new creations are licensed under the identical terms.
This article was originally published by Medknow Publications & Media Pvt Ltd and was migrated to Scientific Scholar after the change of Publisher.
Abstract
Background & objectives:
Antibodies specific to donor human leucocyte antigen (HLA) play a critical role in graft rejection and graft loss. In recent years, techniques for their detection have evolved significantly providing an ever-increasing degree of sensitivity and specificity, from the conventional cell-based assays to the advanced solid-phase system based on the Luminex platform. Consensus is still evolving on the routine employment of all these methods, either stand alone or in combination. The objective of this study was to explore the near-accurate mean fluorescence intensity (MFI) cut-off values detected on Luminex platform predicting the strength of cell-based crossmatch results.
Methods:
Serum samples from 116 primary renal transplant recipients awaiting transplantation were tested for the presence of antidonor antibodies by the complement-dependent cytotoxicity (CDC) and flow crossmatch (FCXM) methods with their corresponding donors as well as for HLA-donor-specific antibodies (DSA) detection using a sensitive single antigen bead (SAB) assay.
Results:
None of the patients having HLA Class I DSA with MFI values <1000 showed positivity for T-cell FCXM or CDC crossmatch, while in the group having MFI values between 1000 and 3000, 54 per cent showed positivity for the FCXM but none by the CDC method. However, in the group having MFI values >3000, 95 per cent of cases were positive for FCXM. Further, those groups with MFI values between 3000 and 5000, only 36 per cent were positive for CDC crossmatch, while 90 per cent showed positivity in the group with MFI >7000.
Interpretation & conclusions:
A cut-off MFI value of 3000 for Luminex SAB-based assay was found to significantly correlate with the FCXM positivity while a MFI value of 7000 and above predicted a positive CDC crossmatch. MFI cut-off value obtained as a surrogate marker for CDC and FCXM tests will help in resolving the limitations of different cell-based techniques.
Keywords
Complement-dependent cytotoxicity
donor-specific antibodies
flow crossmatch
kidney transplantation
mean fluorescence intensity
solid-phase assay

Antibodies against the human leucocyte antigen (HLA) play a major role in the causation of antibody-mediated rejection and graft loss, thus making it a critical barrier for solid organ transplantation123. Almost 60 years have passed since the introduction of complement-dependent cytotoxicity (CDC) as the first technique for the detection of HLA antibodies in recipients before undergoing renal transplantation4. Since then, methodologies to detect HLA antibodies have progressed from purely target donor cell-based assays, such as CDC or flow cytometry to the more sensitive and specific HLA protein-based solid-phase assay systems in the form of an enzyme-linked immunosorbent assay (ELISA) or HLA antigen-coated fluorescence bead assay based on a Luminex platform5. In the latter technique, the mean fluorescence intensity (MFI) is a measure of the degree of saturation of total antigens present on the beads by antibodies and is used as a surrogate marker for the level of antibody titres. Currently, there is a lack of consensus with regard to the optimum MFI cut-offs for classifying antibodies as positive or those that are significant.
Consensus is still evolving on the routine employment of all these methods either stand alone or together and the clinical relevance of antibodies detected by each of these. Several studies have focused on defining cut-off values for donor-specific antibodies (DSA) which can predict the CDC and flow crossmatch (FCXM) results to a reasonable degree of accuracy67891011. However, the MFI values of such a cut-off have differed in different studies and seem to be centre/laboratory specific.
The objective of this study was to actuate the MFI values of DSA detected by single antigen bead (SAB) assay to that of cell-based CDC and flow crossmatch results. This is perhaps the first Indian study to assess the MFI cut-off values of Luminex-based single antigen DSA that can accurately predict the strength of cell-based CDC and FCXM results.
Material & Methods
A total of 116 consecutive prospective ABO-compatible primary renal transplant recipients who reported for pre-transplant workup at the department of Transplant Immunology and Immunogenetics, All India Institute of Medical Sciences (AIIMS), New Delhi, between May 2012 and July 2014, were included in the study. All patients underwent antibody detection by three methods: (i) CDC crossmatch, (ii) flow cytometry crossmatch, and (iii) HLA-DSA detection using solid-phase immunoassay based on a Luminex platform. The study was approved by the Institutional Ethics Committee, and written informed consent was obtained from all recipients and donors.
Complement-dependent cytotoxicity (CDC) crossmatch: T-cell CDC crossmatch assay was performed using the standard two-stage National Institute of Health (NIH) technique12, and a score of ≥4 was considered positive.
Flow crossmatch (FCXM): FCXMs using patients' serum samples and donor peripheral blood mononuclear cells were performed for both IgG T- and B-cells13. Fluorescence-labelled antibodies [anti-CD3 phycoerythrin (e-Bioscience, San Diego, CA, USA); anti-CD19 Cy5 phycoerythrin (e-Bioscience) and anti-human IgG F(ab)2 FITC (Jackson ImmunoResearch, West Grove, PA, USA)] were used. A total of 50,000 events were acquired using a FACSCalibur cytometer (BD Biosciences, USA), and analysis was performed with FlowJo software (http://www.flowjo.com). The cut-off set in our laboratory for defining positive IgG T- and B-cell FCXM was a median channel shift (MCS) of ≥25.
Human leucocyte antigen (HLA)-donor-specific antibody (DSA) detection using solid-phase immunoassay (SPI): Serum samples from the recipients were analyzed for Class I and Class II IgG HLA antibodies using the commercially available LABScreen SAB assay kit (One Lambda, Inc., Canoga Park, CA, USA) on a Luminex platform (Bio-Plex 200, Bio-Rad Laboratories, USA)14. The procedure was performed according to the manufacturer's instructions, and samples were analyzed using Luminex 100 IS v 2.3 software (Luminex Corporation, USA) for data acquisition. Data analysis was done with HLA Fusion software (One Lambda, Inc.). Results were interpreted using raw MFI values.
HLA typing: Low-resolution HLA typing of all recipients and donors included in this study was performed for A, B and DR locus alleles using the polymerase chain reaction-sequence-specific primer (PCR-SSP) method15.
Statistical analysis: For categorical data, Chi-square test was applied and odds square with 95 per cent confidence interval (CI) and P value were calculated. Receiver operating characteristic (ROC) analysis was performed, ROC curve was plotted between the true-positive fraction (sensitivity) against the false-positive fraction (1-specificity) at various MFI values for Class I DSA and area under the curve (AUC) was calculated. For CDC and FCXMs, classifiers were simply a positive or negative crossmatch result. All calculations were performed using SPSS for windows, version 20.0 (SPSS Inc. Chicago, USA).
Results
The outcome of CDC crossmatch, FCXM and HLA-DSA results by SAB performed on all 116 recipients included in this study are presented in Fig. 1. A total of 13 (11.21%) of the 116 recipients were positive for CDC crossmatch, and 100 per cent of the CDC-positive group was also positive for FCXM and SAB-based DSA. Further, 45 of the 116 (38.79%) recipients were positive for FCXM, 30 (66.67%) being positive for both T- and B-cells, while the remaining 15 (33.33%) showed positivity for B-cell only. Further analysis revealed that 28 (93.33%) of both T- and B-cell FCXM-positive cases were also positive for HLA-DSA while the remaining two (6.67%) were negative for DSA by the SAB assay. Twenty (71.43%) of these 28 DSA-positive cases had Class I DSA only, seven (25%) had both Class I and II DSA and the remaining one (3.57%) had Class II DSA only. Eleven (73.33%) of the 15 B-cell only positive FCXM cases were also positive for DSA by SAB assay while the remaining four (26.67%) were negative for DSA. Of these 11 DSA-positive cases, nine (81.82%) had Class II DSA and one each had both Class I and Class II DSA or only Class I DSA.
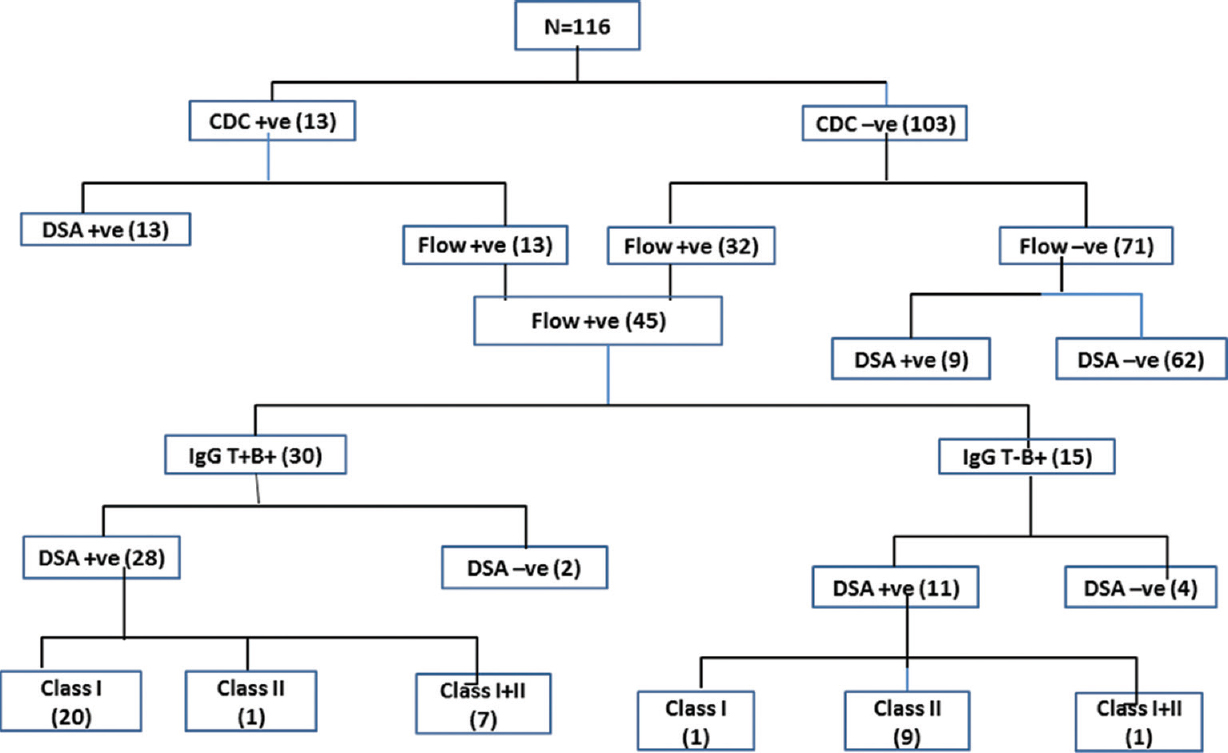
- Flowchart depicting complement-dependent cytotoxicity (CDC) crossmatch, flow crossmatch and single antigen bead results in the given cohort. DSA, donor-specific antibodies.
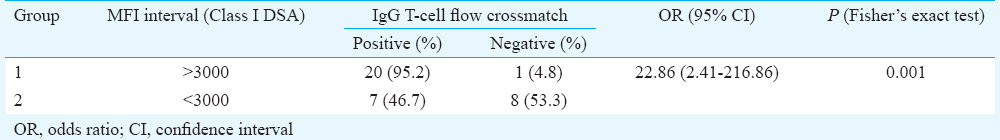
Association of Class I donor-specific antibody (DSA) mean fluorescence intensity (MFI) with flow crossmatch (FCXM) IgG T-cell: The association data on MFI values of SAB-based Class I DSA with that of IgG T-cell FCXM are given in Table I and Fig. 2 None of the cases having DSA with MFI values <1000 showed positivity for T-cell FCXM, while in the group having MFI values between 1000 and 3000, seven of the 13 cases (53.85%) were positive and the remaining six (46.15%) were negative. In the group having MFI values >3000, 20 (95.24%) of the 21 cases were positive for T-cell FCXM. In this group, 11 patients had MFI values between 3000 and 5000 while 10 had MFI values >5000. On comparison of groups 1 versus 2 and 2 versus 3 (Table I), only the latter revealed a significant difference for predicting a positive T-cell FCXM (P<0.002). MFI values were not homogeneous with respect to the FCXM results [Chi-square=13.92, degree of freedom (df)=3, P=0.003, Yates' P=0.05 and Fisher's exact P=0.002]. Since values in some of the cells were less (<1) (Table I), the data were compressed in two categories with the MFI cut-off value of 3000. Table II summarizes comparison between T-cell FCXM results with the Luminex data based on MFI cut-off value of 3000. The odds of FCXM to be positive was found to be 22.86 (95% CI=2.41-216.86, P=0.001) when the MFI values were >3000. On ROC analysis, Class I DSA MFI values showed good predictive accuracy for T-cell FCXM (AUC=0.8807; 95% CI=0.767-0.994) (Fig. 3A). Further, the diagnostic sensitivity and specificity for MFI cut-off at 3382 were 74 and 88.9 per cent, respectively, while for MFI at 3424, it was 70.3 and 100 per cent, respectively.

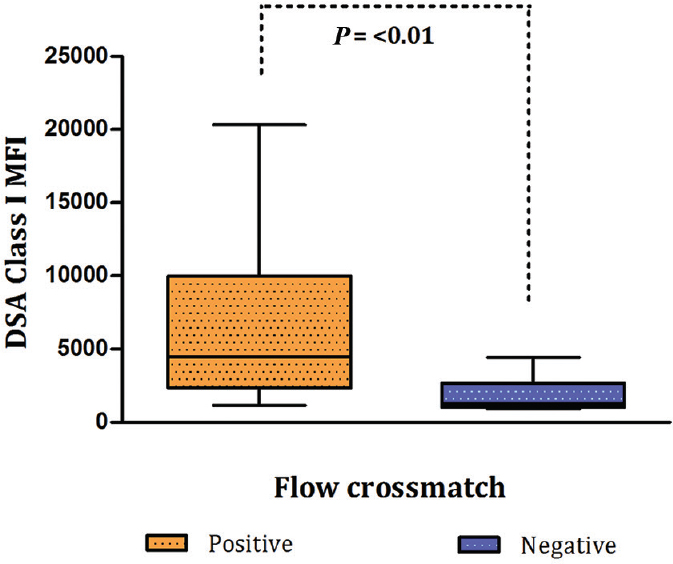
- Box-and-whisker plot depicting correlation of donor-specific antibody (DSA) Class I mean fluorescence intensity (MFI) values with the results of T-cell flow crossmatch.
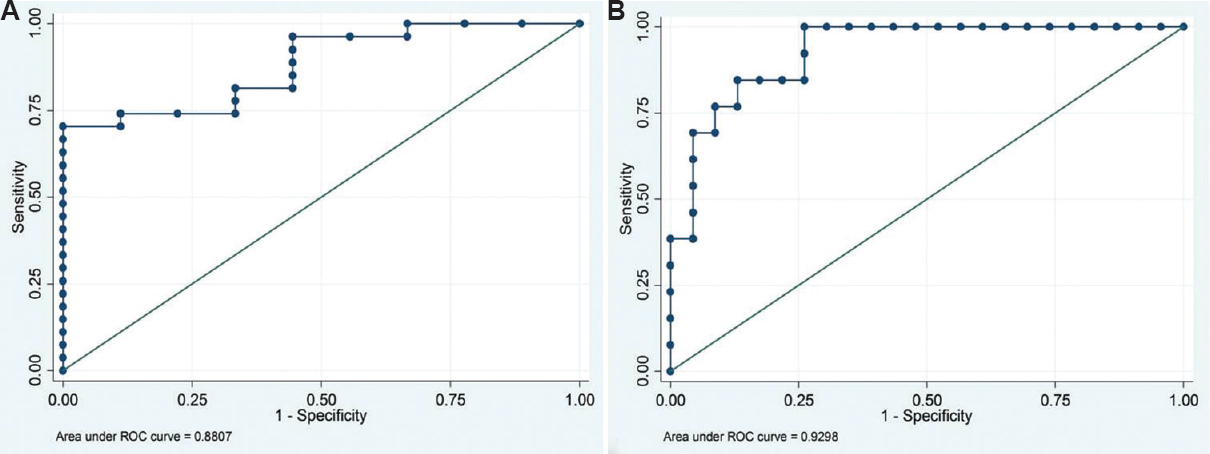
- Receiver operating characteristic curves for mean fluorescence intensity values for predicting (A) positive flow crossmatches (B) complement-dependent cytotoxicity crossmatches.
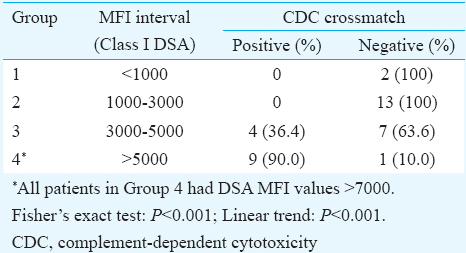
Association of SAB- MFI with CDC crossmatch: Data presented in Table III and Fig. 4 illustrate the association of MFI values of SAB Class I DSA with that of the T-cell CDC crossmatch results. None of the patients with DSA MFI values <3000 were positive for CDC crossmatch. In the group having MFI values between 3000 and 5000, only four (36.36%) of the 11 cases showed positivity for the CDC crossmatch while the remaining seven (63.64%) were negative. However, in the group with DSA MFI >7000, nine (90%) of the 10 patients were CDC positive and only one was negative. This negative patient had MFI value of 9986. When SAB-C1q assay was performed on the serum sample of this patient, it was found to be negative indicating the presence of non-complement-fixing antibodies.

- Box-and-whisker plot for correlation of Class I mean fluorescence intensity values with the results of complement-dependent cytotoxicity crossmatch. • = Represents an outlier with DSA MFI value of 9986.
It was also found that MFI values were not homogeneous with respect to CDC crossmatch results (Chi square=21.07, df=3, P<0.001, Yates' P<0.001 and Fisher's exact P≤0.001) (Table III). Since the values in some of the cells were extremely low (<1), the data were compressed in two categories with a MFI cut-off value of 7000 (Table IV). The results revealed that the odds of CDC crossmatch to be positive was 49.50 (95% CI=4.84-505.98, P<0.001) when the MFI values were >7000. ROC analysis showed strong predictive accuracy of Class I DSA MFI values for identifying CDC crossmatch positivity (AUC=0.9298; 95% CI=0.851-1.000) (Fig. 3B). MFI cut-off of 4644 exhibited a diagnostic sensitivity of 76.9 per cent and specificity of 91.3 per cent for predicting positive CDC crossmatch. Sensitivity decreased to 69.2 per cent each for MFI cut-off value of 4886 and 7507 while the specificity remained same for MFI cut-off of 4886 and increased to 95.7 per cent at MFI of 7507. None of the patients had DSA MFI between 4886 and 7507.

Discussion
This study was carried out with the main aim of correlating Luminex-based SAB-MFI values with that of cell-based assays so as to determine the actuarial MFI cut-off value above which the CDC and FCXM would predictably be positive. An attempt was made to explore the correlation of HLA Class I DSA detected by Luminex-based SAB with the IgG T-cell FCXM and CDC crossmatch results. We did not include B-cell FCXM as its results were influenced by both Class I and II HLA-DSA. Moreover, B-cell crossmatch is prone to false positivity due to non-specific binding of immunoglobulins to Fc receptors. Data on IgM crossmatch were not considered since Luminex-based assay detects only IgG antibodies.
Our results indicated that Luminex-based single antigen MFI cut-off of 3000 significantly correlated with FCXM positivity while a MFI value of 7000 and above was predictive of a positive CDC crossmatch. Although the numbers were small, an almost 100 per cent concordance reached between the two techniques i.e., CDC and Luminex-based SAB for the MFI values <3000 and >7000. Our results were consistent with those of others1016. In fact, the latter group of investigators reported that in their experience, all CDC-positive crossmatches had a MFI value of >6000, but not all serum samples with high MFI were positive for CDC. They attributed this finding to the possible presence of non-complement-fixing antibodies. In our study also a similar case was seen in whom the CDC crossmatch was negative despite having DSA with MFI value of 9986. We found this to be due to the presence of non-complement-fixing antibodies by performing Luminex-based C1q assay for the detection of complement-fixing anti-HLA antibodies (C1qScreen, One Lambda). In the study by Ellis et al16, no such test was performed to confirm the presence of non-complement-fixing nature of antibodies.
The MFI cut-off value for FCXM in our study was much lower than those reported in earlier studies911. For example, Moreno et al11 demonstrated a cut-off MFI value of 6500 for predicting a positive FCXM result with a sensitivity of 85 per cent and specificity of 82 per cent. This could be due to the differences in the MCS defined for positive T-cell FCXM which was taken as 25 or more in our laboratory as compared to 40 in the earlier two studies. Moreover, the cumulative effect of antibodies against more than one antigen was possible, and this could have influenced the MFI values to be lower as observed in our study. Lobashevsky17 reported unpublished data suggesting a positive predictive value of 97 per cent for a MFI cut-off of 2600 and T-cell-positive FCXM results. This was in line with our cut-off value of 3000 with a positive predictive value of 95.2 per cent. However, in this study17, the details on cut-off values for MCS for positive T-cell FCXM have not been given.
In our study there were two cases in whom the DSA was not identified by Luminex-SAB assay while the flow-based crossmatch for IgG T- and B-cell was found to be positive. This could be due to the presence of non-HLA antibodies. In one of the cases, the presence of DSA against major histocompatibility complex Class I-related chain A (MICA) antigen have been found (data not shown). It is presumed that the observed FCXM positivity could well be because of the presence of MICA antibodies. It is known that the expression of MICA molecule can be induced on activated lymphocytes18.
Our study had some limitations, the main being that we included participants having DSA against more than one Class I antigen and this cumulative effect of different antigen-antibody interaction could have affected the MFI cut-off value and thus the correlation with the strength of cell-based crossmatch. Another limitation was non-inclusion of HLA-C antigens in the study for the determination of Class I DSA. This is because currently, typing for HLA-C locus is not a part of the donor selection criteria under the renal transplantation protocol19 and hence our cut-off applies to anti-HLA Class I antibodies limited to HLA-A and HLA-B loci only.
To conclude, our study correlated MFI values detected by Luminex-based single antigen with the strength of CDC and flow-based crossmatch results. Only when data from other centres and larger cohorts become available, it will be possible to explore the near-accurate MFI cut-off values predicting the strength of cell-based crossmatch results. The MFI cut-off values of determining donor-specific anti-HLA antibodies on Luminex platform could serve as a surrogate marker for CDC and FCXM test results and help in resolving the limitations of different cell-based techniques.
Acknowledgment
Authors thank the Indian Council of Medical Research, New Delhi for financial support.
Conflicts of Interest: None.
References
- Significance of the positive crossmatch test in kidney transplantation. N Engl J Med. 1969;280:735-9.
- [Google Scholar]
- Four-year follow-up of a prospective trial of HLA and MICA antibodies on kidney graft survival. Am J Transplant. 2007;7:408-15.
- [Google Scholar]
- Analysis of positive kidney, heart, and liver transplant crossmatches reported to the Collaborative Transplant Study. Hum Immunol. 2009;70:627-30.
- [Google Scholar]
- Clinical relevance of antibody development in renal transplantation. Ann N Y Acad Sci. 2013;1283:30-42.
- [Google Scholar]
- Prediction of crossmatch outcome of highly sensitized patients by single and/or multiple antigen bead luminex assay. Transplantation. 2006;82:1524-8.
- [Google Scholar]
- Clinical importance of anti-human leukocyte antigen-specific antibody concentration in performing calculated panel reactive antibody and virtual crossmatches. Transplantation. 2008;85:1046-50.
- [Google Scholar]
- Organ Procurement and Transplantation Network/United Network for Organ Sharing Histocompatibility Committee collaborative study to evaluate prediction of crossmatch results in highly sensitized patients. Transplantation. 2009;87:557-62.
- [Google Scholar]
- Antihuman leukocyte antigen – Specific antibody strength determined by complement-dependent or solid-phase assays can predict positive donor-specific crossmatches. Arch Pathol Lab Med. 2010;134:1534-40.
- [Google Scholar]
- Predictive value of the Luminex single antigen panel for detecting flow cytometry cross-match positivity. Hum Immunol. 2012;73:517-21.
- [Google Scholar]
- Flow cytometric crossmatching in primary renal transplant recipients with a negative anti-human globulin enhanced cytotoxicity crossmatch. J Am Soc Nephrol. 2001;12:2807-14.
- [Google Scholar]
- IgG donor-specific anti-human HLA antibody subclasses and kidney allograft antibody-mediated injury. J Am Soc Nephrol. 2016;27:293-304.
- [Google Scholar]
- Phototyping: Comprehensive DNA typing for HLA-A, B, C, DRB1, DRB3, DRB4, DRB5 & DQB1 by PCR with 144 primer mixes utilizing sequence-specific primers (PCR-SSP) Tissue Antigens. 1995;46:355-67.
- [Google Scholar]
- Diagnostic accuracy of solid phase HLA antibody assays for prediction of crossmatch strength. Hum Immunol. 2012;73:706-10.
- [Google Scholar]
- Methodological aspects of anti-human leukocyte antigen antibody analysis in solid organ transplantation. World J Transplant. 2014;4:153-67.
- [Google Scholar]
- Intracellular expression of MICA in activated CD4 T lymphocytes and protection from NK cell-mediated MICA-dependent cytotoxicity. Hum Immunol. 2006;67:170-82.
- [Google Scholar]
- Current role of human leukocyte antigen matching in kidney transplantation. Curr Opin Organ Transplant. 2013;18:438-44.
- [Google Scholar]


