
Translate this page into:
Choice of criterion used in the receiver operating characteristic analysis
*For correspondence: farrokh.habibzadeh@theijoem.com
-
Received: ,
This is an open access article distributed under the terms of the Creative Commons Attribution-NonCommercial-ShareAlike 3.0 License, which allows others to remix, tweak, and build upon the work non-commercially, as long as the author is credited and the new creations are licensed under the identical terms.
This article was originally published by Medknow Publications & Media Pvt Ltd and was migrated to Scientific Scholar after the change of Publisher.
Sir,
We read with interest the article of Mohan et al1 on determination of glycosylated haemoglobin (HbA1c) cut-off value for the diagnosis of type 2 diabetes in Rayalaseema area in Andhra Pradesh, Southern India1. They mention that various studies have reported different HbA1c cut-off values from ≥5.6 per cent (38 mmol/mol) to ≥7.0 per cent (53 mmol/mol) and that ‘age, ethnicity, genetic makeup, erythrocyte lifespan and erythrocyte environment’ are the most likely causes of the observed variance. We believe that in selecting the criterion used to derive the most appropriate test cut-off value in the receiver operating characteristic (ROC) curve analysis, we should also consider other important contributing factors2.
Mohan et al1 mentioned that based on the article of Perkins and Schisterman3, they used the cut-off value corresponding to the point on the ROC curve with the minimum distance from the upper left corner of the unit square, where both the test sensitivity (Se) and specificity (Sp) were equal to 1. However, Perkins and Schisterman3 clearly recommended the use of Youden's index (Se + Sp − 1) and warned about using the minimum distance criterion.
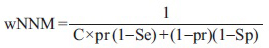
It has been shown that neither the minimum distance nor maximizing the Youden's index, though commonly used by researchers, is the best criterion for the calculation of the most appropriate test cut-off values24. To reach the most appropriate value, it is imperative to also take into account the ‘pre-test probability’ (pr) of the disease as well as the relative cost of a false negative test result as compared to a false positive result (C). Generally, in areas where the pr (disease prevalence, where there is no other information about the person tested) and the C are higher, to obtain better results, we should set the test cut-off point at a lower value24. It can be shown that maximizing the weighted Number Needed to Misdiagnose (wNNM)5, defined as follows, is corresponding to the most appropriate test cut-off value:
To calculate the wNNM, we need to know estimations of the pr and C and also the Se and Sp corresponding to each point on the ROC curve. From Table II of Mohan et al's1 article, we know that of the 342 persons examined in the training data set, there were 139 newly diagnosed patients with type 2 diabetes, translating into a pr of 0.41. To determine the Se and Sp corresponding to each point on the ROC curve, we retrieve parts of the data from Fig. 2A and Fig. 3 (inset graph)1 by a digitizer (Cal-Comp, USA).
If we miss a patient with type 2 diabetes (a false negative test result), the patient will return and present with a more advanced stage of the disease with more complications needing more care. On the other hand, labelling a person to have diabetes, while he or she really does not (a false positive test result), causes him/her to be further tested, plus the time and the psychological trauma to them and their family members. Even after a normal test, it is difficult to believe that he or she really does not have the disease. Assume the cost of making a false negative test result is five times the cost of a false positive result (C=5). Considering a pr of 0.41 and C of 5, the maximum wNNM of 3.74 occurs at a point on ROC curve with a Se of 0.91, Sp of 0.85, a positive predictive value (PPV) of 0.81, and a negative predictive value (NPV) of 0.93, corresponding to a cut-off value of >6.3 per cent (45 mmol/mol). This value is accidentally equal to the value derived through using the minimum distance method used by the authors1 (Figure, the white circle). The Youden's index at this very point has also the maximum value of 0.76. However, all the assumptions made by the authors would not necessarily be correct, even for their region.
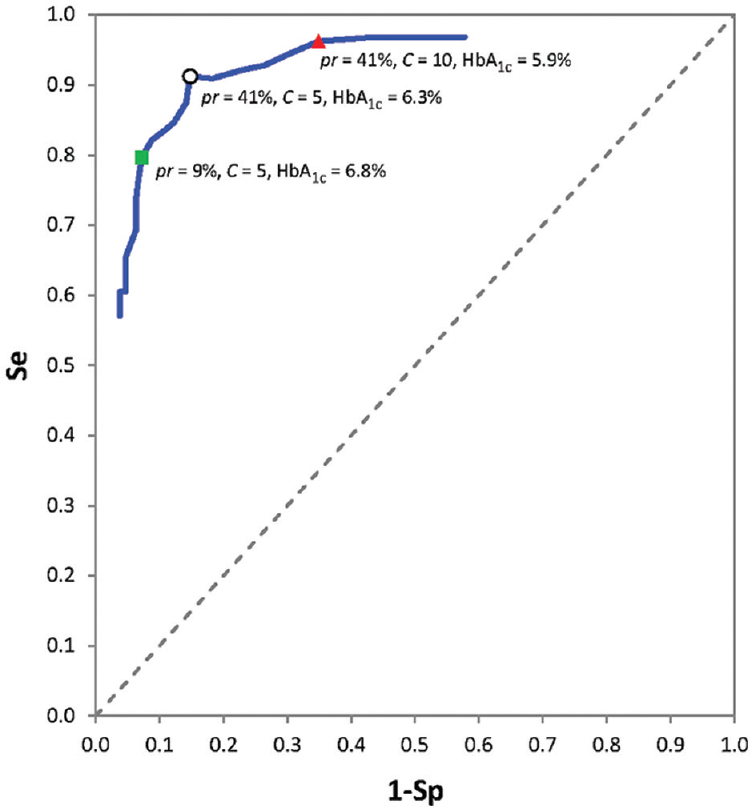
- Part of the receiver operating characteristic curve plotted based on the data retrieved from Fig. 2a of Ref. 1. The white circle corresponds to the cut-off point derived by the authors of the article. The green square corresponds to a higher cut-off value when the prior probability is considered 9 per cent (the prevalence of type 2 diabetes in general population) instead of 41 per cent (the prevalence in the referral centre where the study was conducted), and the red triangle corresponds to a lower cut-off value, when the cost of a false negative test result is assumed 10 (instead of 5) times a false positive result.
Suppose we want to use HbA1c as a screening test in general population in the studied region. Under such circumstance, the pr is no longer 0.41; it is 0.09 - the prevalence of type 2 diabetes in the studied region, Rayalaseema area in Andhra Pradesh, Southern India6. Considering a pr (here, the prevalence) of 0.09 and a C of 5 (as before), the maximum wNNM corresponds to a Se of 0.80, Sp of 0.93, PPV of 0.52 and NPV of 0.98, corresponding to a cut-off value of >6.8 per cent (51 mmol/mol) (Figure, the green square). The centre where the study was conducted was probably a referral centre; all persons studied were ‘suspected to have type 2 diabetes’, probably based on their signs or symptoms (polyuria, polydipsia, etc.), hence, a higher pr of 0.41. As one can see, where the pr of a disease is higher, we need to use a lower test cut-off value to obtain the best result2. Therefore, it is very important to bear in mind to use an HbA1c cut-off of >6.3 per cent when practicing in that referral centre, and a value of >6.8 per cent when practicing in a general clinic.
Now, suppose one in the said referral centre (pr=0.41) believes that the relative cost of a false negative test result is 10 times the cost of a false positive result (C=10, not 5). Then, the maximum wNNM corresponds to a Se of 0.96, Sp of 0.65, PPV of 0.66, and NPV of 0.96, corresponding to a cut-off value of >5.9 per cent (41 mmol/mol) (Figure, the red triangle). Note that in the calculation of the cost, we should not only consider financial costs incurred but also take into account all other costs (psychological, legal, etc.). These calculations are mainly based on the results of cost-effectiveness and benefit-risk studies. Apparently, the higher the relative cost of a false negative to a false positive test results, the lower test cut-off value should be set2.
Many of the criteria nowadays commonly used to determine the most appropriate test cut-off value, consider neither the pr of the disease of interest nor the costs of false test results. It can however be shown that these criteria (e.g., maximizing the Youden's index) are special cases of the maximizing wNNM2. To obtain better results, we, therefore, suggest using the method of maximizing wNNM, which can easily be calculated based on the output data of most statistical software programmes.
Conflicts of Interest: None.
References
- Derivation & validation of glycosylated haemoglobin (HbA1c) cut-off value as a diagnostic test for type 2 diabetes in south Indian population. Indian J Med Res. 2016;144:220-8.
- [Google Scholar]
- On determining the most appropriate test cut-off value: the case of tests with continuous results. Biochem Med (Zagreb). 2016;26:297-307.
- [Google Scholar]
- The inconsistency of “optimal” cutpoints obtained using two criteria based on the receiver operating characteristic curve. Am J Epidemiol. 2006;163:670-5.
- [Google Scholar]
- Medical decision making (2nd ed). Oxford, UK: Wiley-Blackwell; 2013.
- Number needed to misdiagnose: A measure of diagnostic test effectiveness. Epidemiology. 2013;24:170.
- [Google Scholar]
- Prevalence of risk factors for coronary atherosclerosis in a cross-sectional population of Andhra Pradesh. Indian Heart J. 2002;54:697-701.
- [Google Scholar]


