
Translate this page into:
Carbohydrate profiling & glycaemic indices of selected traditional Indian foods
For correspondence: Dr Vasudevan Sudha, Department of Foods Nutrition & Dietetics Research, 4, Conran Smith Road, Gopalapuram, Chennai 600 086, Tamil Nadu, India e-mail: s2r_7@mdrf.in
-
Received: ,
This article was originally published by Wolters Kluwer - Medknow and was migrated to Scientific Scholar after the change of Publisher.
Abstract
Background & objectives:
Consumption of high glycaemic index (GI) food is associated with a high risk for diabetes. There is a felt need to understand the GI of common Indian traditional foods using standard GI protocols. The present study was aimed to analyse the carbohydrate profile of common traditional Indian food preparation and to determine their GI using standardized protocols.
Methods:
Twelve food preparations made of millets, wheat, maize and pulses were evaluated for nutrient composition including detailed carbohydrate profiling and tested for GI in healthy volunteers using standard methodology. Capillary blood glucose responses for the test foods containing 50 g available carbohydrates were recorded and compared to the reference food (50 g glucose). GI was calculated from the incremental area under the curve (IUAC) for the test and reference foods.
Results:
Available carbohydrate content of the food preparations ranged between 13.6 and 49.4 g per cent. Maize roti showed the highest total dietary fibre (7.5 g%). White chick pea ‘sundal’ showed highest resistant starch content (3.95 g%). Amongst the 12 test foods, five fell in the high GI category (finger millet balls, sorghum, pearl millet and maize roti), four in the medium GI category (sorghum idli, wheat dosa, methi roti and adai) and three in the low GI category (broken wheat upma, white peas sundal and white chick peas sundal).
Interpretation & conclusions:
Merely being a whole grain-based food does not qualify for a lower GI. The method of processing, food structural integrity and preparation could influence the GI. The type and quality of fibre are important than the quantity of fibre alone. Judicious planning of accompaniments using low GI legumes may favourably modify the glycaemic response to high GI foods in a meal.
Keywords
Carbohydrates
diabetes
glycaemic index
millets
resistant starch
structural integrity
whole grains

Carbohydrates form the major source of energy in Indian diets. The quantity and quality of dietary carbohydrates are important as carbohydrates with high glycaemic index (GI) and glycaemic load (GL) have been found to be associated with the risk of non-communicable diseases12. Indian culinary preparations are diverse region specific with unique carbohydrate profile and glycaemic properties. In addition, carbohydrate constituents in different foods may undergo modification/transformation during processing/food preparation, all of which could synergistically determine post-meal glycaemic response to the food3.
Physiologically, dietary carbohydrates are broadly classified as available (glycaemic carbohydrates, which are metabolizable and raise the blood glucose upon consumption) and unavailable carbohydrates (which are not digested and may get fermented in the colon). Most of the dietary fibres and resistant starch (RS) are unavailable carbohydrates4. The glycaemic property (carbohydrate quality) of a food is assessed by the GI, a relative ranking system, which classifies carbohydrate-containing foods based on their ability to raise blood glucose levels upon ingestion as against reference food (glucose). This GI system has been recommended for making healthier carbohydrate food choices by the Food and Agriculture Organization (FAO)45. Glycaemic response of foods is dependent on a multitude of factors such as food form, composition (nature and content of carbohydrates, presence of RS, dietary fibre, protein and fat), method of preparation and processing3, and is unique for each food. RS, presents in some of the foods or formed during processing, is resistant to digestion by digestive enzymes and may help in reducing the glycaemic response and glycaemic load (GL) of diets and also in improving insulin sensitivity6.
The prevalence rates of diabetes are alarmingly high in Asian Indians. Almost 7.3 per cent of the Indian adult population is affected with diabetes and 10.3 per cent can be classified as having pre-diabetes7. This is partly linked to faulty dietary patterns in Asian Indian diets8, which may mediate type 2 diabetes (T2D) through insulin resistance and beta cell exhaustion. Foods with lower GI are recommended for Asian Indians9. It is necessary to understand the carbohydrate profile and GI of commonly consumed foods to make judicious food choices. Although there are some studies on the GI of Indian foods10, it is difficult to draw conclusions from these owing to the variable methodologies adopted, and many of the studies report GI based on in vitro methods, which may not be a precise indicator of the GI determined through in vivo methods. In addition, there is no information on the carbohydrate profile of cooked/processed Indian foods in the National Food Composition Table. Thus, this study was conducted to analyse the carbohydrate profile of different commonly consumed traditional Indian food preparations by standard chemical analytic methods and to further determine the GI using internationally validated protocols41213.
Material & Methods
The foods taken up for the study (Table I) were prepared in the Institutional test kitchen for GI testing and for nutrient evaluation including carbohydrate profiling (available carbohydrate, dietary fibre and RS contents). Available carbohydrates include free sugars and starch, those that are digested and absorbed by the human small intestine and are glucogenic.
| Foods | Description | Method of preparation | Moisture (g/100 g) | Fat (g/100 g) | Protein (g/100 g) | Ash (g/100 g) | Available carbohydrates (g/100 g) | THF (g/100 g) | RS (g/100 g) |
|---|---|---|---|---|---|---|---|---|---|
| Millet-based preparations | |||||||||
| Finger millet stiff porridge (ball) | Stiff porridge rolled into balls | A soft ball prepared by boiling finger millet flour in water | 64.27 | 0.47 | 3.9 | 1.51 | 26.71 | 5.42 | 0.7 |
| Sorghum roti (Indian bread) | Unleavened bread | Unleavened flat breads made from sorghum flour and salt | 43.47 | 1.05 | 4.12 | 1.55 | 49.35 | 7.0 | 0.69 |
| Sorghum idli | Fermented steamed cake | Steamed cake made from fermented batter of sorghum grits and decorticated black gram (3:1, sorghum-to-pulse) | 62.15 | 0.75 | 4.17 | 1.25 | 27.62 | 4.5 | 1.87 |
| Pearl millet roti (Indian bread) | Unleavened bread | Unleavened flat breads made from pearl millet flour and salt | 33.59 | 2.23 | 6.63 | 1.64 | 47.82 | 7.05 | 1.0 |
| Wheat-based preparations | |||||||||
| Wheat dosa | Crepe | Thin crisp pancake made from wheat flour batter (with mustard, asafoetida and curry leaves seasoning) | 52.36 | 1.31 | 6.55 | 1.8 | 32.46 | 6.28 | 1.95 |
| Broken Wheat upma | Boiled broken wheat with seasonings | Toasting followed by boiling wheat grits in water seasoned with onion, salt and spices | 61.12 | 4.08 | 4.27 | 1.35 | 26.34 | 5.28 | 3.25 |
| Wheat flakes chivda | Snack | Snack made wheat flakes, dry fruits, peanuts and spices | 19.68 | 6.84 | 11.25 | 1.97 | 42.83 | 5.28 | 2.45 |
| Methi paratha | Unleavened bread | Unleavened flat breads made from dough made by mixing wheat flour, fenugreek leaves, curd, salt, cumin, red chilli powder, coriander powder, oil and water | 27.19 | 7.03 | 10.0 | 2.96 | 42.38 | 10.39 | 0.49 |
| Maize-based preparations | |||||||||
| Maize roti (Indian bread) | Unleavened bread | Unleavened flat breads made from maize flour salt | 40.29 | 1.36 | 6.02 | 1.99 | 44.78 | 7.51 | 1.87 |
| Pulse-based preparations | |||||||||
| White peas sundal | Boiled legumes with seasonings | Snack made from boiled white peas, green chillies, spices and coconut | 71.19 | 0.42 | 6.73 | 1.73 | 13.55 | 4.88 | 1.28 |
| White chickpea sundal | Boiled legumes with seasonings | Snack made from boiled white chickpeas, spices and coconut | 58.37 | 2.65 | 8.66 | 1.25 | 22.27 | 6.47 | 3.95 |
| Adai | Spicy pan cake | Thick type of pancake made out of a coarsely ground batter of rice, pulses and spices | 49.34 | 2.35 | 7.48 | 2.48 | 32.63 | 6.47 | 2.78 |
TDF, total dietary fibre; RS, resistant starch
The method of preparation is shown in Table I.
Nutrient evaluation including carbohydrate profiling: Freshly cooked foods were homogenized and were taken up for nutrient evaluation (moisture, protein, fat and ash) using standard AOAC methods [moisture (method 925.10, 2008), ash (method 923.03, 2005), protein (method 984.13, 2005) and fat (method 920.39, 2005)]. The dietary fibre content, available carbohydrates and RS contents were estimated by enzymatic methods using K-ACHDF 06/14 Megazyme kit (Ireland) which is based on the AOAC Official Method 991.43 and AACC Method 32-07.01.
Glycaemic index (GI) testing: Selected foods belonging to four different categories were taken for GI determination:
-
Millet-based preparations [finger millet balls, sorghum roti, sorghum idli and pearl millet (bajra) roti]
-
Wheat-based preparations (wheat dosa, methi paratha, broken wheat upma and wheat flakes chivda)
-
Maize-based preparation (roti)
-
Pulse-based preparations (white peas sundal, white chick peas sundal and adai).
This study was conducted in the Madras Diabetes Research Foundation, Chennai, India, during the years 2010-13 following the internationally recognized GI protocol4 which is based on the guidelines recommended by the International Dietary Carbohydrate Task Force for GI Methodology1213. The study was approved by the Institutional Ethics Committee. All volunteers gave informed written consent before they enrolled themselves for the study. The trial was also registered in the Clinical Trial Registry of India (CTRI/2018/04/013456). Fifteen healthy volunteers of both genders aged between 20 and 45 yr, overweight and obese with body mass index (BMI) >23 kg/m2 were recruited for the purpose. Anthropometric measurements including height, weight and waist circumference were measured in the fasting state using standardized techniques (Table II). The participants were excluded with the BMI <22.9 kg/m2 and had fasting blood glucose >5.6 mmol (>100 mg/dl), or if they were on a special diet, had a family history of diabetes, suffered from any illness or food allergy or were on medications. A practice test was performed on volunteers who were not familiar with blood sampling via finger-pricking so as to acquaint them with the procedure to minimize the effects of anxiety on blood glucose response. All the volunteers underwent three days of testing with the reference food and one day with the test foods in random order with at least two days gap between measurements to minimize carry-over effects.
| Description | Mean±SD |
|---|---|
| Age (yr) | 32.3±6.3 |
| Male n (%) | 7 (47.9) |
| Female n (%) | 8 (52.1) |
| Height (cm) | 161.3±8.9 |
| Weight (kg) | 68.3±11.6 |
| BMI (kg/m2) | 26.2±3.8 |
| Waist circumference (cm) | 85.8±9.7 |
| Systolic blood pressure (mmHg) | 113.3±15.5 |
| Diastolic blood pressure (mmHg) | 73.9±11.5 |
| Fasting blood glucose | 91.0±9.8 |
SD, standard deviation; BMI, body mass index
Information on the previous day’s diet (24 h recall) and physical activity was obtained to ensure that they followed the same pre-test diets and refrained from smoking and alcohol during the study period. Fasting blood samples (10-12 h overnight fast) were taken by finger prick using an automatic lancet device at −5 and 0 min before consumption of the food and the average of these two was taken as the baseline value. The volunteers were given 200 ml of water along with the test food and an extra 200 ml water was provided during the subsequent two hours. The time of first bite in the mouth was set as time 0 and capillary blood samples were taken at 15, 30, 45, 60, 90 and 120 min after starting to eat the test foods.
Available carbohydrates, proximate composition and total dietary fibre were estimated, and the test foods containing 50 g available carbohydrates were provided to the volunteers. Fifty five grams of glucose [glucose monohydrate- (Glucon-D) glucose powder, Heinz India (P) Ltd., Mumbai, India] dissolved in 200 ml of water was used as the reference food [1.1 g monohydrated glucose provides 1.0 g glucose. Hence, 55 g of monohydrate glucose (50×1.1=55) was used to get 50 g of anhydrous glucose. It was consumed at the beginning, middle and end of the test foods testing, while three test foods were consumed in random order between reference foods on different occasions with a gap of at least two days between the measurements13.
The GI was calculated as the incremental area under the blood glucose response curve of a 50 g available carbohydrate portion of a test food expressed as a per cent of the response to the same amount of carbohydrate from a reference food (glucose) taken by the same volunteer. The GL of the foods was arithmetically calculated by multiplying the GI (%) of the foods and the available carbohydrate content of the food per serving. Here, per serving of the food was the 50 g of available carbohydrate containing foods tested for GI.
Statistical analysis: Statistical analysis was performed using SPSS software (SPSS Inc., Chicago, IL, USA). Data were shown as mean with standard error unless otherwise stated. Participants with mean GI <2 SD ( standard deviation) were considered as outliers. A total of 15 volunteers were enrolled, of whom one participant each from sorghum roti, maize roti, adai, wheat dosa and pearl millet roti; two participants each from wheat flakes chivda snack and broken wheat upma and three participants each from finger millet balls, methi paratha, white peas sundal and white chick peas sundal were removed as outliers and not considered for the present analysis. Multivariate linear regression was carried out to assess the effects of covariates – age, sex, BMI, waist circumference and previous day diet total calories on the GI of each of the test foods.
Results
In the current study, 12 different types of traditional foods prepared based on different cereals were evaluated for their nutrient composition, carbohydrate profile and GI values. The nutrient composition and also the GI values of the cooked foods varied widely. With respect to carbohydrate profile, the available carbohydrate content of the cooked foods ranged from 13.6 per cent for white peas sundal to 49.4 per cent for sorghum roti. Methi paratha showed the highest total dietary fibre (TDF) (10.4%), while sorghum idli showed the lowest TDF (4.5 g%). RS content of the foods ranged between 0.69 per cent (for sorghum roti) and 3.95 per cent in white chick pea sundal. The moisture content of the foods varied considerably depending on the preparation and ranged from 71.9 per cent for white peas sundal to 19.7 per cent for wheat flakes chivda. Wheat flakes chivda showed the highest protein content (11.25 g%) and methi paratha showed the highest fat content (7.0 g%), while finger millet ball showed the least for both (3.9 and 0.47 g%, respectively) (Table I).The demographic and clinical characteristics of the GI study participants are presented in Table II.
The mean age and BMI of GI study participants were 32.3±6.3 yr and 26.2±3.8 kg/m2, respectively. The mean change in blood glucose concentration of high, medium and low GI foods is shown in Figure A-C. Among the 12 foods tested for GI (Table III), three fell in the low GI category and the rest in medium and high GI category. Finger millet balls (gruel) (stiff porridge or mudde) showed the highest GI value (98.2±5.5, IAUC 4847.6±543.7) followed by sorghum roti (84.1±6.7, IAUC 4502.8±701.1), maize roti (74.8±5.5, IAUC 3862.8±547.0), wheat flakes chivda (72.5±3.4, IAUC 3358.0±396.9) and pearl millet roti (GI= 70.1±3.0, IAUC 3801.6±483.0). It may be noted that even though these are whole grain flour-based preparations, their GI values were in higher range. The legume-based adai showed medium GI values 66.2±3.5 (3460.9±454.0), as did wheat dosa (GI=61.8±5.7, IUAC 2994.8 ± 460.2), sorghum idli (GI 61.3±5.1, IAUC 2871.3±315.1), and methi paratha (GI=60.2±6.7, IAUC 3002.4±404.7). The two whole grain legume preparations, namely white peas sundal and white chick peas sundal, showed the lowest GI values [29.8±4.2 (IAUC 1529.8±220.2) and 24.1±2.6 (IAUC 1259.1±230.6)], respectively, while broken wheat upma also showed low GI category food choice [51.7±7.7 (IAUC 2357.6±316.4)]. Multivariate linear regression analysis for each test foods (intercept) showed that age, sex, BMI, waist circumference and previous day dietary calories (kcal/day) of the participants did not influence the GI values of foods (Table IV). The GL of the test foods (shown in Table III) varied between foods and ranged from as low as 12.1 for white chick peas sundal to as high as 49.1 for finger millet ball. The sundal varieties prepared from legumes showed the lowest GL (12-14), while finger millet stiff porridge and roti varieties showed higher GL (35-49) and by design GL correlated with GI of these foods which all had equal amount of carbohydrates (50 g).
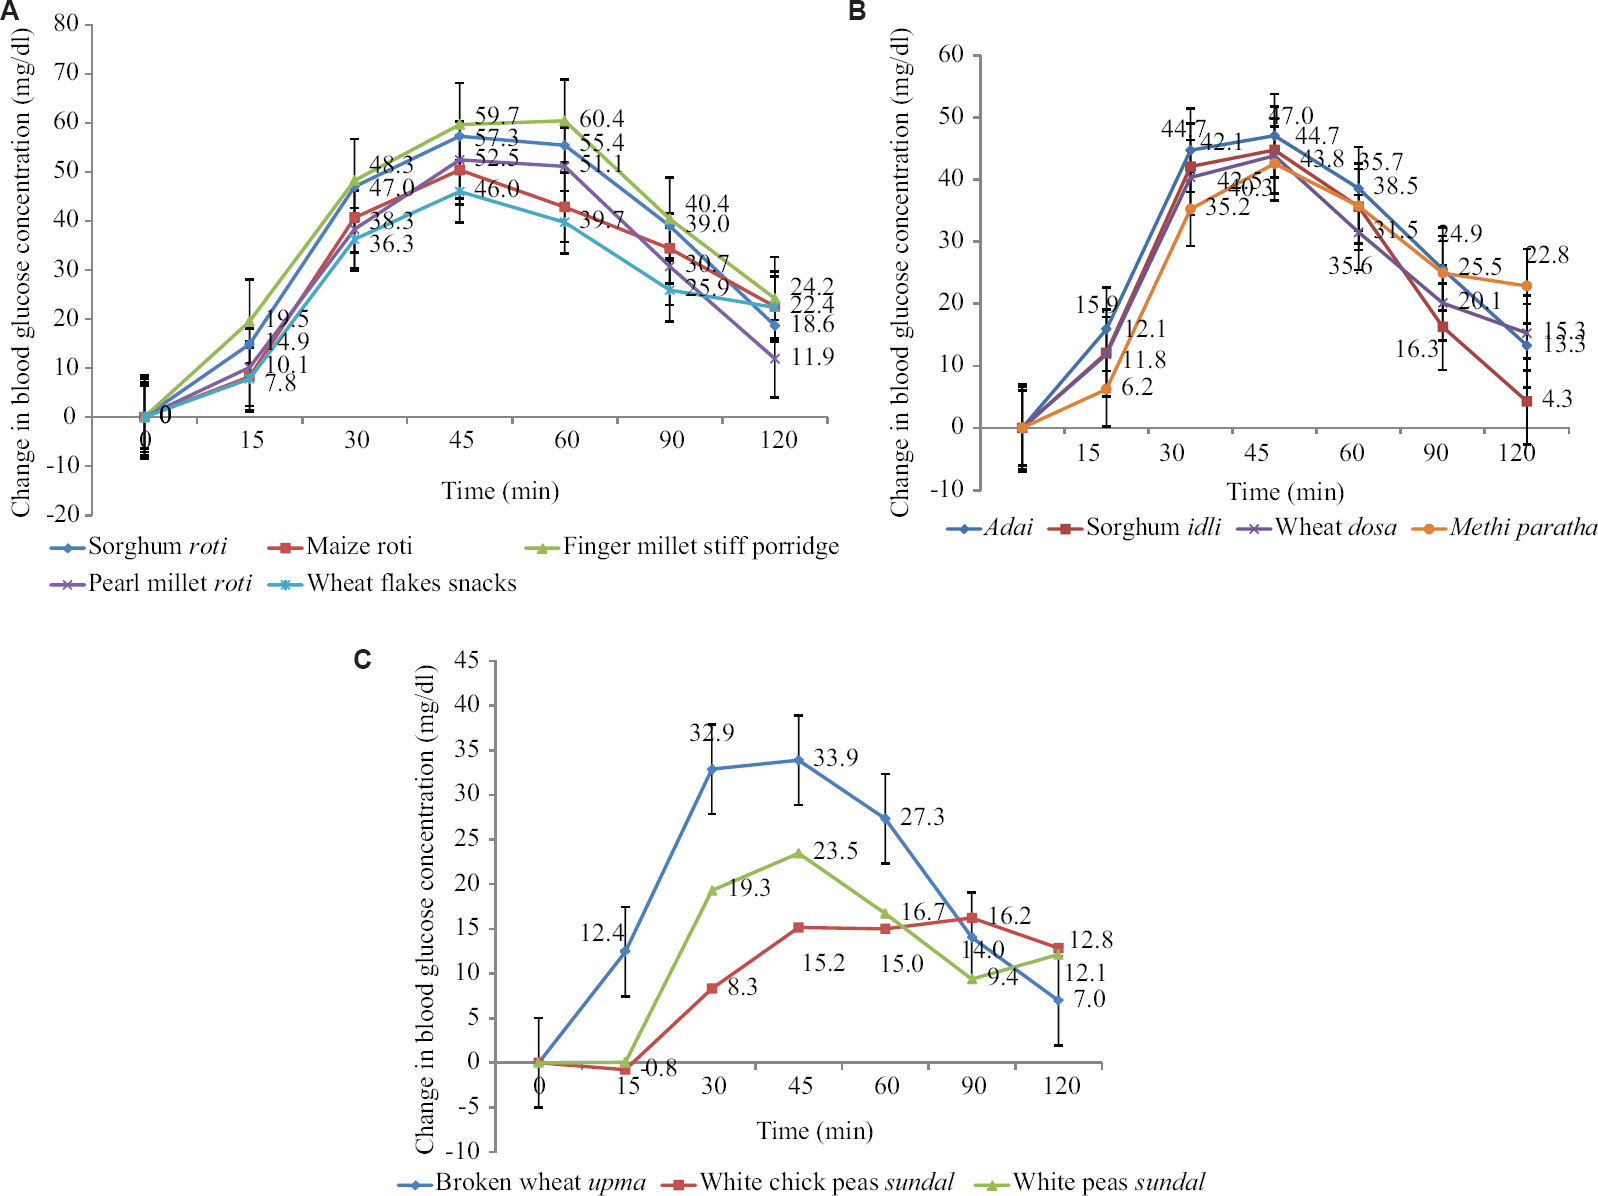
- (A) Mean change in blood glucose concentration of high glycaemic index foods. (B) Mean change in blood glucose concentration of medium glycaemic index foods. (C) Mean change in blood glucose concentration of low glycaemic index foods.
| Food | n | Cooked weight of the food contributing 50 g available carbohydrate | IUAC | GI | GI classification | GL# | ||
| Mean | SEM | Mean | SEM | |||||
| Millet based preparations | ||||||||
| Finger millet stiff porridge (ball) | 12 | 187.3 | 4847.6 | 543.7 | 98.2 | 5.5 | High | 49.1 |
| Sorghum roti | 14 | 113.9 | 4502.8 | 701.1 | 84.1 | 6.7 | High | 42.1 |
| Sorghum idli | 15 | 181.8 | 2871.3 | 315.1 | 61.3 | 5.1 | Medium | 30.7 |
| Pearl millet roti | 14 | 104.6 | 3801.6 | 483.0 | 70.1 | 3.0 | High | 35.1 |
| Wheat based preparations | ||||||||
| Wheat dosa | 14 | 154.04 | 2994.8 | 460.2 | 61.8 | 5.7 | Medium | 30.9 |
| Broken wheat upma | 13 | 189.82 | 2357.6 | 316.4 | 51.7 | 7.7 | Low | 25.9 |
| Wheat flakes snacks (chivda) | 13 | 94.6 | 3358.0 | 396.9 | 72.5 | 3.4 | High | 36.3 |
| Methi paratha | 12 | 117.9 | 3002.4 | 404.7 | 60.2 | 6.7 | Medium | 30.1 |
| Maize based preparations | ||||||||
| Maize roti | 14 | 116.1 | 3862.8 | 547.0 | 74.8 | 5.5 | High | 37.4 |
| Pulse based preparations | ||||||||
| White peas sundal | 12 | 322.6 | 1529.8 | 220.2 | 29.8 | 4.2 | Low | 14.9 |
| White chick peas sundal | 12 | 224.5 | 1259.1 | 230.6 | 24.1 | 2.6 | Low | 12.1 |
| Adai | 14 | 155.6 | 3460.9 | 454.0 | 66.2 | 3.5 | Medium | 33.1 |
# GL values are provided for the quantity of foods providing 50 g available carbohydrates; SEM, standard error of mean; SD, standard deviation; GI, glycaemic index; IUAC, incremental area under the curve; GL, glycaemic load
| Foods tested for GI | Intercept (β) | P |
|---|---|---|
| Finger millet stiff porridge (ball) | 183.3 | 0.12 |
| Sorghum roti | −49.8 | 0.55 |
| Sorghum idli | −21.7 | 0.80 |
| Pearl millet roti | −122.6 | 0.13 |
| Wheat dosa | −13.1 | 0.83 |
| Broken wheat upma | 62.3 | 0.47 |
| Wheat flakes snacks | 14.6 | 0.85 |
| Methi paratha | 68.8 | 0.46 |
| Maize roti | −20.2 | 0.81 |
| White peas sundal | 7.2 | 0.93 |
| White chick peas sundal | 19.1 | 0.35 |
| Adai | 70.7 | 0.26 |
GI, glycaemic index
Discussion
Our findings show that carbohydrate profile and GI of the foods widely vary and this could be attributed to factors such as inherent nature of the grains, form of food, additional ingredients used and method of preparation. Unleavened flat breads (rotis, paratha), pancakes (dosa, adai) and snacks (chivda) showed higher available carbohydrate values, probably due to the lower moisture levels (higher solid content) in these foods. In general, the RS content of the foods was low possibly due to the nature of processing undergone and the starch makeup. Most of the foods tested were prepared using wholegrain and contained substantial amounts of dietary fibre (4.5-7.5 g%) though not intact fibre as most of the traditional food preparations were whole meal flour-based.
Observational studies indicate that low GI diets are associated with lower risk of T2D114. Hence, it is important to understand the GI of commonly consumed foods for efficient meal planning and impart dietary advice with the focus to balance not only carbohydrate quantity but also its quality.
Some of the food processing methods are known to influence RS formation, which could decrease the GI. On the other hand, processes such as grinding are known to alter the food matrix, leading to increase in the bio-accessibility of starch, whereas the food matrix is preserved to a greater extent in the foods where grains are cooked as such3.
Millet-based preparations: Among the millet-based preparations, the wholegrain preparations such as finger millet balls, sorghum roti and pearl millet roti contained higher levels of dietary fibre. In the case of sorghum idli, incorporation of black gram and the presence of RS to the extent preserved in the form of bigger grits of sorghum used for idli making might have also added to the RS and DF values, but these were lower for sorghum idli than most of the other foods tested owing to its higher moisture content. Vaidya and Sheth15 reported RS content of 0.9 per cent for pearl millet roti, which was comparable to the values observed (1.0 g%) in the current study. The lower RS in finger millet (0.7 g%) in the present study was similar to the values reported by Roopa and Premavalli16 for finger millet stiff porridge. Similarly, Mangala et al17 had reported very low levels of RS in finger millet products processed by different methods, probably due to lower levels of amylose contents which have higher tendency to form RS during hydrothermal processing. Higher GI for finger millet stiff porridge corroborates with previous reports by Urooj et al18. Grinding, rolling, pressing or even thoroughly chewing kernel or starch food can disrupt the outer layer of granules and increase the GI. Although finger millet has higher fibre content, but most of its fibre is insoluble in nature. Also, preparation of stiff porridge entails boiling the flour in water with complete loss of grain matrix, leading to increased surface area, finer particle size of the flour and easier exposure of starch granules for swelling and gelatinization during cooking. This increases the accessibility for amylolysis and ultimately higher glycaemic responses. We have earlier reported high GI of finger millet flakes and decorticated finger millet19. Many finger millet-based preparations seem to show high GI20. Rotis (an unleavened flat bread where the flattened dough is toasted on a hot griddle) also showed high GI. However, methi paratha showed medium GI, probably due to the characteristic features of ingredients added in the preparation such as curds and oil, which could have influenced lower GI (medium GI) compared to rotis (high GI). It is well known that dairy products are low to medium GI choices and the presence of fat delays gastric emptying rate and hence leads to lower GI3.
Apart from other factors, the nature of starch in the respective grains in the food preparation is also an important determinant of the GI. The high GI observed for sorghum roti in the present study corroborated with the reports for sorghum roti (GI=77) by Atkinson et al10. However, Prasad et al21 reported an upper medium GI value of 68±8.6 for sorghum roti. In the present study, dough for sorghum roti was prepared with hot water and hence could have developed some amount of pre-gelatinized starch. Atkinson et al10 reported low GI value (49) for pearl millet roasted bread and chapathi, but Shukla et al22 reported upper medium GI for pearl millet chapathi (69.7), which was similar to the values observed in the current study. Medium GI of sorghum idli could be due to the nature of starch and the food matrix (prepared from batter with bigger grits of sorghum and finely ground paste of black gram). Jahan and Kamalaja23 reported a low GI (51.2) for sorghum rava idli, the differences in the GI could be attributed to the differences in sorghum to black gram daal (pulse) ratio used for the idli batter preparation (sorghum:daal 3:1 and 2:1 in our study as compared to the study of Jahan and Kamalaja23).
Wheat-based preparations: In the case of wheat-based preparations, broken wheat upma showed low GI, whereas other foods such as wheat dosa and methi roti showed medium GI values and wheat flakes chivda showed high GI. Higher dietary fibre in wheat dosa was possible as whole wheat was used for preparation. Similarly, higher dietary fibre and RS in broken wheat upma is expected as these are prepared from whole samba wheat (Triticum dicoccum) which is known for higher protein, dietary fibre and also high RS contents. This is hard textured wheat24 and the broken wheat is prepared by cracking the whole wheat kernels to grits of bigger size which have firmer texture with intact grain matrix, causing slow digestion. In addition, the oil used in the seasoning probably coats the grits, forming a barrier around the grain constituents, reducing its digestibility and the glycaemic response25. The bigger and harder wheat grits in upma take longer time to hydrate and may lead to incomplete swelling and gelatinization of starch granules and ultimately slower rate of digestion, leading to lower glycaemic response. Vaidya and Sheth15 reported a RS content of 2.1 g per cent in plain boiled daliya (wheat brokens), while in our study, broken wheat upma which is made of daliya showed a higher RS content 3.5 g%, Wheat flakes chivda is prepared from flaked and roasted wheat wherein the grain matrix is disrupted to an extent, probably increasing GI value. The lower GI of broken wheat upma could be due to the nature of starch present in the dicoccum wheat and the bigger particle size of the grits used for upma preparation. There are no reports on the GI of broken wheat upma as such, however Bordia26 reported a higher GI (74.1) for wheat daliya which was prepared with vegetables by pressure cooking, while Urooj and Puttaraj27 have earlier shown a GI of 67 for normal wheat semolina (fibre-depleted starch endosperm) upma. The medium GI of methi roti as compared to higher GI of other rotis could be attributed to higher fat content in the preparation.
Maize-based preparations: In spite of being a wholegrain-based preparation with higher dietary fibre content, maize roti showed a high GI. Vaidya and Sheth15 reported almost similar RS content (2.3 g%) for maize roti (as against 1.87 g% in our study). However, Atkinson et al10 reported medium GI (59) for maize roti, but Shukla et al22 reported very high GI for maize chapathi (84.7). Identification of grain varieties which elicit a lower glycaemic response in the form of roti could be beneficial for populations who consume it as staple food.
Pulse-based preparations: Out of the three pulse-based preparations tested, both the sundal preparations showed low GI as compared to adai (medium GI category), and this is possible as both white peas sundal and white chick peas sundal are whole grain legumes cooked in the grain form (as a whole legume and not split daal) which also contained higher amylose. In addition, cooked legumes tend to retrograde faster to form RS and hence may contain RS328, apart from which the protein and fibre contents in the legumes, their effects on gastric emptying and presence of anti-nutritional factors could also contribute to lower glycaemic response. The results of the current study corroborated with the lower GI category reported for boiled chickpea (GI=33) in the international GI tables. Earlier reports also indicate that addition of chickpea flour reduces the GI of pasta and bread29.
The higher RS (2.78%) for adai could be mainly RS1 from the coarsely ground batter of pulses. The medium GI of adai is expected as it contains almost 50 per cent legumes. The coarser particle size of the grains in the batter and nature of starch in the legumes indicates that they are slowly digestible as compared to cereal starches. The limitations of our study included the limited number of traditional foods that have been evaluated, as also the fact that only one style of preparation of each of the selected foods was considered for testing. In addition, physical activity during the GI testing period was not assessed.
The carbohydrate profile of traditional Indian foods varied widely. The available carbohydrate contents were higher in foods with lesser moisture content (wheat flakes chivda). Merely being a whole grain-based food does not imply a lower GI. The method of processing, food structural integrity (food matrix) and preparation dictate the GI. The GI of the whole grain millet flour-based stiff porridge showed high GI, whereas the GI of whole meal rotis varied between medium and high GI. The type and quality of fibre influence the GI rather than quantity of fibre alone. Consumption of intact whole grains cooked along with intact whole grain legumes and vegetables may help to lower GI. There is an urgent need for region-wise databases on GI of commonly consumed foods for developing GI and GI-based food exchange lists in the country for prevention and effective management of chronic diseases such as diabetes.
Financial support & sponsorship: The study was funded by the Department of Science & Technology, New Delhi, India.
Conflicts of Interest: None.
References
- Can the diabetes/cardiovascular disease epidemic in India be explained, at least in part, by excess refined grain (rice) intake? Indian J Med Res. 2010;131:369-72.
- [Google Scholar]
- Glycemic index, glycemic load, and risk of type 2 diabetes:Results from 3 large US cohorts and an updated meta-analysis. Am J Clin Nutr. 2014;100:218-32.
- [Google Scholar]
- The glycemic index: Applications in practice. Boca Raton, FL: CRC Press; 2016.
- FAO Food Nutr Pap. 1998;66:1-140.
- Glycemic index, glycemic load and glycemic response:An International Scientific Consensus Summit from the International Carbohydrate Quality Consortium (ICQC) Nutr Metab Cardiovasc Dis. 2015;25:795-815.
- [Google Scholar]
- Resistant starch and health. In: Technology of functional cereal products. Cambridge, England: Woodhead Publishing; 2008. p. :63-85.
- Prevalence of diabetes and prediabetes in 15 states of India:Results from the ICMR-INDIAB population-based cross-sectional study. Lancet Diabetes Endocrinol. 2017;5:585-96.
- [Google Scholar]
- Refined grain consumption and the metabolic syndrome in urban Asian Indians (Chennai Urban Rural Epidemiology Study 57) Metabolism. 2009;58:675-81.
- [Google Scholar]
- Consensus dietary guidelines for healthy living and prevention of obesity, the metabolic syndrome, diabetes, and related disorders in Asian Indians. Diabetes Technol Ther. 2011;13:683-94.
- [Google Scholar]
- International tables of glycemic index and glycemic load values:|y2008. Diabetes care. 2008;31:2281-83.
- [Google Scholar]
- Indian food composition tables. Hyderabad: ICMR-NIN; 2017.
- ISO 26642-2010: Food products: Determination of the glycaemic index (GI) and recommendation for food classification. Geneva: ISO; 2010.
- Glycemic index, glycemic load, and dietary fiber intake and incidence of type 2 diabetes in younger and middle-aged women. Am J Clin Nutr. 2004;80:348-56.
- [Google Scholar]
- Processing and storage of Indian cereal and cereal products alters its resistant starch content. J Food Sci Technol. 2011;48:622-7.
- [Google Scholar]
- Effect of processing on starch fractions in different varieties of finger millet. Food Chem. 2008;106:875-82.
- [Google Scholar]
- Resistant starch derived from processed ragi (finger millet, Eleusine coracana) flour:Structural characterization. Food Chem. 1999;64:475-9.
- [Google Scholar]
- Glycaemic responses to finger millet based Indian preparations in non-insulin dependent diabetic and healthy subjects. J Food Sci Technol Mysore. 2006;43:620-5.
- [Google Scholar]
- Development and evaluation of nutritional, sensory and glycemic properties of finger millet (Eleusine coracana L.) based food products. Asia Pac J Clin Nutr. 2018;27:84-91.
- [Google Scholar]
- Finger millet (Ragi, Eleusine coracana L.): A review of its nutritional properties, processing, and plausible health benefits. Adv Food Nutr Res. 2013;69:1-39.
- [Google Scholar]
- Glycaemic index and glycaemic load of sorghum products. J Sci Food Agric. 2015;95:1626-30.
- [Google Scholar]
- Glycaemic response to maize, bajra and barley. Indian J Physiol Pharmacol. 1991;35:249-54.
- [Google Scholar]
- Correlation of glycemic index and in vitro starch digestibility of idli made with rice (Oryza sativa) rawa and jowar (Sorghum) rawa. Indian J Agric Sci Res. 2016;6:161-6.
- [Google Scholar]
- Nutritional and nutraceutical properties of Triticum dicoccum wheat and its health benefits:An overview. J Food Sci. 2017;82:2243-50.
- [Google Scholar]
- Effect of fat on glycaemic responses in normal subjects:A dose-response study. Nutr Res. 2003;23:1341-7.
- [Google Scholar]
- Glycemic index of traditional cereal based recipes of Rajasthan. Udaipur: Ph. D Thesis, Maharana Pratap University of Agriculture & Technology; 2003.
- Glycaemic responses to cereal-based Indian food preparations in patients with non-insulin-dependent diabetes mellitus and normal subjects. Br J Nutr. 2000;83:483-8.
- [Google Scholar]
- Processing of legumes:Resistant starch and dietary fiber contents. J Food Qual. 2004;27:289-303.
- [Google Scholar]
- Chickpea flour ingredient slows glycemic response to pasta in healthy volunteers. Food Chem. 2003;81:511-5.
- [Google Scholar]


