Translate this page into:
Caesarean section delivery & determining factors in northeastern State, India: A Bayesian spatio-temporal analysis of areal data
For correspondence: Dr Kh. Jitenkumar Singh, Data Centre, Indian Council of Medical Research, New Delhi 110 029, India e-mail: jitensinghkh@gmail.com
-
Received: ,
Accepted: ,
Abstract
Background & objectives
Caesarean Section (CS) is a crucial life-saving surgical procedure for maternal delivery when normal delivery is ruled out for the safety of mother and infant. This study investigated the spatio-temporal pattern of CS rates to assess the significant factors boosting this delivery in the northeastern States of India.
Methods
We analysed cross-sectional data from three rounds of the National Family Health Survey (NFHS 3, NFHS 4, and NFHS 5). We estimated the relative risk (RR) of CS delivery and assessed the global and local spatial autocorrelation for each year from 2011 to 2019. Furthermore, the posterior median RR with credible interval was estimated using Bayesian Spatio-temporal modelling with Markov Chain Monte Carlo simulation.
Results
The CS rates in the northeastern States have escalated by nearly 15 per cent over the last two decades, from 5.4 per cent in 2001 to 19.9 per cent in 2019. Furthermore, we observed a substantial increase in the high-high Local Indicator of Spatial Analysis clusters from 2011 to 2019. The estimated posterior median RR exceeded one for four significant predictors: maternal age, maternal education, obesity, and household wealth status. This analysis also revealed that the estimated spatio-temporal trend displayed a clear upward trend in CS risk during the nine-year study period.
Interpretation & conclusions
This study found a substantial increase in CS delivery rate over the nine-year period (2011 to 2019) in the northeastern States of India. The findings of the study provide important policy input for strengthening healthcare intervention and regulations by initiating targeted programmes to monitor and avert excessive use of CS facilities in districts with high CS delivery.
Keywords
Caesarean section
local indicator of spatial analysis
northeastern States
relative risk
spatial temporal analysis
Caesarean section (CS) is a crucial life-saving surgical procedure for birth delivery when normal delivery is ruled out for the safety of the mother and unborn infant. Clinical experts recommend that CS can effectively reduce maternal mortality and morbidity. However, a higher CS rate is a deterrent to the mother and newborn’s health, especially when performed under inadequate healthcare settings. Studies have documented that CS is linked with increased perinatal risks and has implications for future pregnancies1. Furthermore, higher rates of CS are associated with a substantial increase in healthcare costs2,3.
In general, most countries in Asian and African continents showed higher CS rates than the WHO-recommended threshold of 15 per cent4. In South Asia, the CS rate was as high as 19 per cent in 20184. In India, the CS rate increased considerably from nine per cent in 2006 to 22 per cent in 20215,6, with significant inter-State variation, from the highest 60 per cent in Telangana to the lowest five per cent in Nagaland.
Over-reliance on CS facilities coupled with inadequate healthcare facilities could hinder achieving Sustainable Development Goals (SDGs), particularly targets dedicated to improving maternal and newborn health. Therefore, it is important and pertinent to monitor the trends and spatial variation in CS rates to draw attention to the need for adequate and timely healthcare intervention to perform CS in dire circumstances and strengthen healthcare facilities.
To fill the research gap and enrich literature in the context of northeastern States of India, an attempt was made to estimate trends of CS in the last two decades and provide spatial visualisation of temporal trends in RR to help identification of districts with the highest CS delivery rate. The study addressed the following research questions: (i) what has been the trend of CS in the last two decades in northeastern States of India, (ii) what has been the temporal trend in relative risk (RR), (iii) which districts (local authorities) have exhibited the high CS rates, (iv) what have been the associations of higher education levels, advanced maternal age, body mass index (BMI), and highest wealth quintile with CS rate, and (v) what has been the spatio-temporal trend in RR of CS delivery.
Materials & Methods
This study was conducted by ICMR- National Institute for Research in Digital Health and Data Sciences (erstwhile ICMR-National Institute of Medical Statistics), New Delhi.
Data
This study used cross-sectional data from three consecutive rounds of National Family Health Survey (NFHS 2005-06, 2015-16 and 2019-21)7,8, and age-referenced shapefile. The NFHS was conducted from 2005-06, 2015-16, and 2019-21, under the stewardship of the Ministry of Health and Family Welfare, Government of India.
This study considered all mothers who delivered in the last five years of the respective survey in the northeastern States of Arunachal Pradesh, Assam, Manipur, Meghalaya, Mizoram, Nagaland, Sikkim, and Tripura. We used NFHS-3, NFHS-4, and NFHS-5 datasets for information on the number of CS deliveries from 2001 to 2005, 2011 to 2015, and 2016 to 2019, respectively. The unit of analysis is the most recent birth in the last five years preceding the survey.
Outcome variable
The outcome variable is the reported number of CS deliveries in each district of the northeastern States of India.
Predictor variables
Based on the review of existing literature, we identified the following predictor variables and maternal characteristics: maternal age (15-29 and 30-49 yr), educational level (at most secondary level education, higher education), mothers’ BMI (<30 kg/m2, ≥30 kg/m2), alcohol consumption (yes and no), use of smokeless tobacco (yes and no); child characteristics: child’s birth order (<3, ≥3); household characteristics: religion (Hindu and others), social groups (unreserved and others), wealth quintile of the household (poor/middle, and rich); and community characteristics: place of residence (rural and urban). Additionally, the study also considered the type of healthcare facility for delivery (private and public) and the distance to the health facility (no problem and problem)3,4,7.
Statistical analysis
We estimated the district-wise prevalence of CS deliveries in 15-49 yr old women from 2011 to 2019, across 104 districts in the northeastern States. The svyset command in STATA was used to take into account the complex survey sampling design. Further, we computed the global Moran’s I statistics (0.473, P<0.001) to test for spatial autocorrelation.
We used SIR to compare the observed number of occurrences of an event in a population relative to what might be the expected number of occurrences.
We applied Poisson log-linear model, represented as follows:
Risk of CS in the area k with time t is denoted by,
where, is the number of CS in local authority area k during year t, is the RR of CS in local authority area k during year t and is the expected count. In addition, , , denote the proportion of mothers with higher education, between ages 30-49 yr, and those with obesity and within the richest wealth quintile, respectively.
We employed Bayesian spatio-temporal modelling using MCMC simulation that deals with spatial and spatio-temporal data accounting for both space and time variability in CS risk modelling8. In MCMC simulation, we proposed the general form:
where, is expressed as a sum of several components, including spatial and temporal structures that take into account the fact that neighbouring areas and consecutive times may have more similar risks. The spatio-temporal interaction can also be included in dif ferent areas, which may have different time trends, but these may be more similar in neighbouring areas8.
Here, is the spatio-temporal random effect for local authority area k and time-period t.
Our aim here is to quantify the evolution of the spatial pattern in CS risk over time, so we used the spatially autocorrelated first-order autoregressive process model given by,
where, denotes the vector of random effects for all areal units (local authority) at time t., and = ( , ……, ) the vector of errors. Temporal autocorrelation is controlled by the mean function , while spatial autocorrelation is controlled by the covariance structure of . This model was used by Rushworth et al (2014)9, and is available in R as a package called CARBayesST.
For assessing the convergence of the Markov chains, we drew a trace plot of the samples for each regression parameters . We provided estimated posterior median, 95% credible intervals, Geweke diagnostic value for all three chains in supplementary table I.
We computed estimated RR for four predictor variables by constructing a matrix of MCMC samples for the regression parameters ( ) from all chains using the formula given in equation (3) for variable. Similarly, we computed for and .
We used STATA version 18 (Stata Corp, College Station, TX, USA) and R version 4.3.2 to fulfil the study objectives. Throughout the analysis, an α level of 0.05 was adopted to indicate statistical significance.
Results
Trend analysis
The trends of CS rate in northeastern States and India from 2001-2019 are displayed in figure 1. The overall CS rates in the northeastern States increased by nearly 15 per cent over the last two decades. It increased from 5.4 per cent in 2001 to 19.9 per cent in 2019. At the Indian level, the CS rates increased from 6.8 per cent in 2001 to 23.7 per cent in 2019. Nearly all northeastern States observed an increasing trend in CS rates from 2001 to 2019.
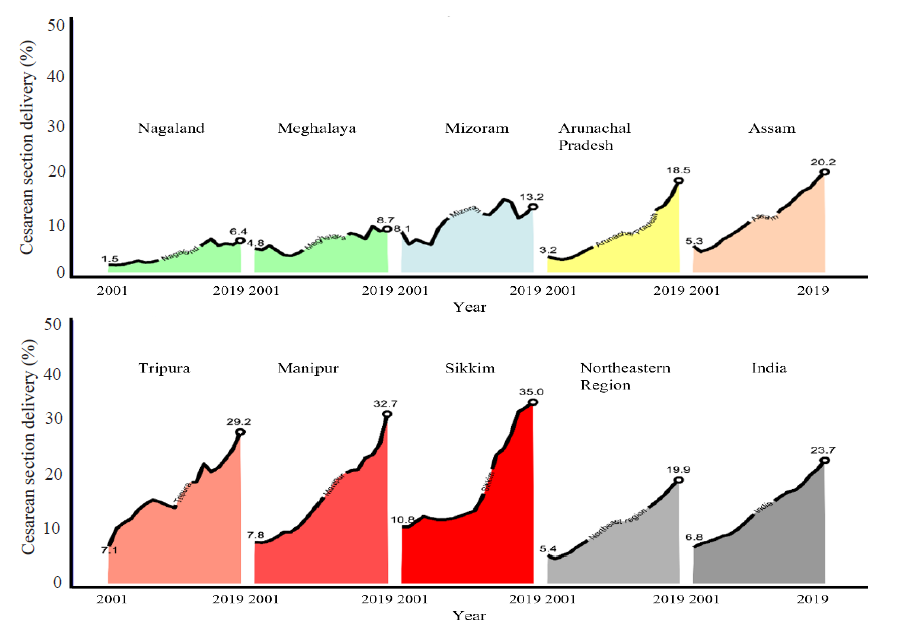
- Trends of CS rate in northeastern States and India from 2001 to 2019.
Local indicator spatial autocorrelation (LISA)
Based on the results of the LISA analysis, we observed a substantial increase in the number of high-high LISA clusters from 2011 to 2019, i.e., districts with a high prevalence of CS rate were surrounded by districts where higher CS rates were observed. In 2011 and 2012, Imphal West and Thoubal districts of Manipur had high-high LISA clusters (Fig. 2A and B). Further, in 2013, three districts of Manipur and Lakhimpur of Assam were in high-high LISA category (Fig. 2C). In 2014, the south district of Sikkim and Dhalai district of Tripura were also in high-high LISA category (Fig. 2D). Further, in 2015, south Tripura and Gomati districts of Tripura, Imphal West district of Manipur, south district of Sikkim, and Dibrugarh district of Assam exhibited high-high LISA clustering (Fig. 2E).
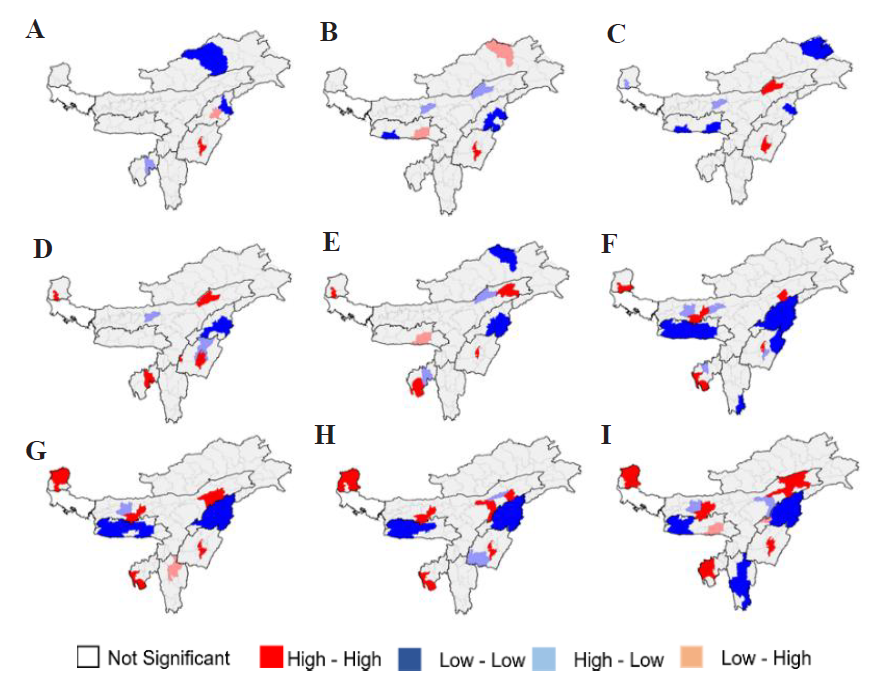
- LISA of CS delivery rate in northeastern States from 2011 to 2019. Maps were reproduced with permission from Georeference data received from DHS website.
High-high LISA clusters in south and east districts of Sikkim, Sepahijala and south Tripura districts of Tripura, Imphal West district of Manipur, and Kamrup and Shivsagar districts of Assam were observed in 2016 (Fig. 2F). Similar trends of high-high LISA categories were observed in 2017 (Fig. 2G). In 2018, three districts (north, west, and south) of Sikkim, two districts of Assam (Golaghat and Shiv Sagar), Imphal West, Thoubal districts of Manipur, and Sepahijala and South Tripura district of Tripura were identified as belonging to the high-high LISA category (Fig. 2H). Moreover, three districts of Sikkim (north, south and west district), Sepahijala, West Tripura, and Gomati were from high-high LISA category in 2019 (Fig. 2I).
Figure 3 showed that a higher RR value was found in the upper-western districts of Arunachal Pradesh, lower and western part of Assam, and north district in Sikkim from 2015 to 2019 (a detailed interpretation of Fig. 3 is provided in supplementary material).
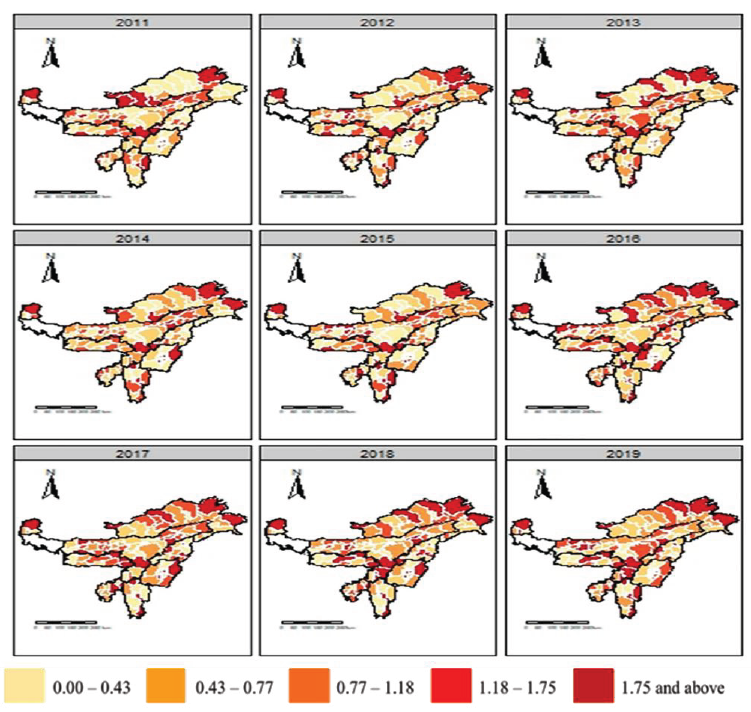
- RR for CS delivery rate in northeastern States from 2011 to 2019. Maps were reproduced with permission from Georeference data received from DHS website.
Spatio-temporal analysis
Figure 4 indicated that the chains appear to have converged, as there is no change in the mean or variance of the samples between the three chains. To draw inferences from the MCMC model on the effect of the predictor variables on CS deliveries, the posterior median RR was estimated for a fixed increase in each of the covariates. Table shows that the estimated posterior median RR for four predictor variables was above 1, which indicated that the variables were significantly related to CS delivery risk.
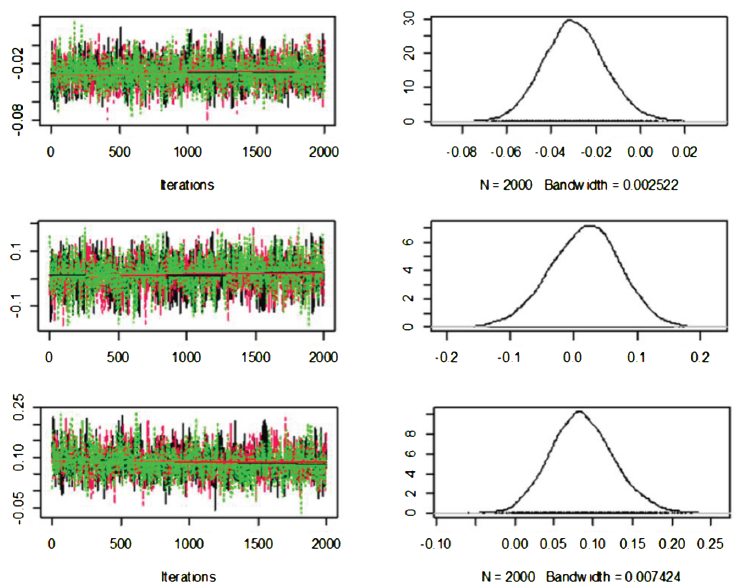
- Trace plots of the regression parameters using MCMC samples from each chain.
| Covariates | Posterior median relative risk | Credible interval (2.5% - 97.5%) | |
|---|---|---|---|
| Higher education | 1.152 | 1.043 | 1.189 |
| Age (30-49 yr) | 1.289 | 1.221 | 1.492 |
| Obesity | 1.198 | 1.165 | 1.298 |
| Richest | 1.147 | 1.113 | 1.169 |
To estimate the average temporal trend, we first estimated the average (mean) risk across the k=104 districts for each year and MCMC sample, which yielded the posterior distribution of these spatial averages for each year. Then, we computed the posterior median RR surface and 95% credible interval for the spatially averaged risk. Figure 5 displays that the estimated spatio-temporal trend shows a clear upward trend in CS delivery risk over the nine-year study period.
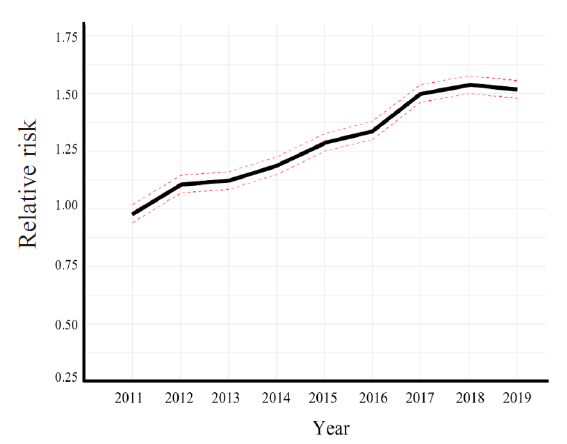
- Posterior median relative risk surface
and 95% credible interval for the spatio-temporal trend.
Discussion
This study analysed the spatio-temporal trend of CS delivery in northeastern States of India. The global trend in CS rates has been on the rise, with CS rates increasing significantly over the years. Data from various research papers show that the global CS rate has almost doubled from 12.1 per cent in 2000 to 21.1 per cent in 2015. The prevalence of CS is observed to vary greatly across the world; Latin America and the Caribbean region have notably high CS rates, with up to 44.3 per cent of births being delivered through CS10. The present study assessed the trends of CS rate for each northeastern State from 2001 to 2019. The trend in CS delivery displayed an escalating trend for all northeastern States. Previous studies attributed the increase in the use of CS delivery to better access to tertiary hospitals, safe surgical procedures, and accessible obstetric care3,11,12.
The results from the LISA analysis for the years from 2011 to 2019 enabled identify districts with a high prevalence of CS delivery surrounded by districts with higher CS delivery. The results showed three districts of Sikkim and Tripura, four districts of Manipur, and five districts of Assam had high-high LISA category in 2019. The Moran’s-I value for all years confirmed strong residual spatial autocorrelation of CS in northeastern States, India, from 2011 to 2019. The identification of high-high LISA clusters provides insights into regions with elevated CS risks. The potential reasons for these spatial patterns could be a rise in urban healthcare infrastructure in the region, particularly in districts where the healthcare facilities are located13.
The estimated RR of CS delivery is an important indicator for assessing whether the average risk of CS events is higher or lower in a particular district or standard population. This study found that the estimated RR in 2019 was higher compared to 2011-2018 in the standard population. The study also presents the estimated posterior median RR for four predictor variables after taking the type of healthcare facility for delivery, distance to health facilities, lifestyle including drinking alcohol, smokeless tobacco, etc. of the mother, and other variables such as child’s birth order, religion, social status, and place of residence as control variables. Additionally, previous studies identified prior CS, foetal weight, abnormal presentations, gestational weight gain, pre-term birth, gestational diabetes, hypertension, and preeclampsia as potential confounding factors associated with CS delivery14,15. We found more educated women in the age group 30-49 yr, obese and the richest household wealth quintile, showed a higher risk of CS delivery, which was in line with the previous studies3,16–19. Interestingly, the study observed a continuous increase in CS risk over the nine-year period from 2011 to 2019. The findings from spatio-temporal analysis are in agreement with previous studies7,20.
The results of the spatio-temporal analysis show the alarming rise of CS over the nine-year study period. Implementation of internal CS audits at healthcare facilities and interventions such as the midwifery programme in Telangana in 2017 could help reduce non-medically indicated CS delivery in the northeastern States of India. Developing and implementing evidence-based protocols and practices during labour and delivery that address the changing pattern in labour management and obstetric population (older mothers, obesity, etc.) could help prevent avoidable CS deliveries. Effective policies and interventions are required to bring down the rate of unnecessary CS deliveries. Considering the rate of CS is a lot higher among private institutions (observation from the current data), equalising fees for both vaginal delivery as well as CS delivery under government guidelines may discourage private practice institutions from unnecessarily insisting patients undergo CS delivery. Reducing the fees for normal delivery may discourage patients who demand CS delivery unnecessarily. Ensuring compulsory psycho-education and informed choices for all expecting parents offered by all practising obstetricians and gynaecologists under strict government guidelines may go a long way in terms of reduction of CS delivery rate.
The NFHS collects data from a nationally representative sample of women in the age group 15-49 yr from the community and provides reliable estimates at the district level. Hence, findings from the current study can be generalized to the general target population. The findings are crucial for policymakers for focusing on districts with higher autocorrelation of CS events. The graphical representation using spatial analysis shows progression across time, space, and concentration, which is extra informative and more straightforward to consume than traditional diagrammatic and tabular data representation. The current research also found factors significantly associated with CS, and therefore, policy-makers and healthcare workers may take advantage of this information to help mothers and their families make well-informed choices in order to save lives, health, cost, time, and resources.
However, there are some limitations, which are as follows. NFHS data is based on self-reports, so response bias, underreporting, and investigator’s reporting errors cannot be ruled out. The results of the current study are findings from quantitative data and have no provision for including qualitative variables like mental health issues, societal pressure, peer pressure, misinformation, and lack of education about delivery options. Government regulations on eligibility and certain requirements before considering a patient for CS delivery instead of clinicians deciding based on their convenience or the patient’s request also may help reduce the rate.
Overall, this study shows maternal age, maternal education, obesity, and the higher level of household well-being as factors significantly associated with CS delivery, and their intensity varies by districts in northeastern States over time. From the spatio-temporal analysis, we found a significant increase in CS risk over the nine-year period from 2011-19. The findings of this study shall awaken healthcare managers and policy-makers regarding the need for initiating adequate programmes to avert excessive dependence on the use of CS provisions in the identified districts of northeastern States. This calls for better education about the ills and benefits of CS delivery at all levels of health facilities, clinics, and in the communities through healthcare workers in places where the concentration of the hotspots is high.
Acknowledgment
Authors acknowledge all the respondents for their active participation in the nationally representative survey.
Financial support & sponsorship
The study received funding from the Indian Council of Medical Research, India (Grant number: Project-2021-14436).
Conflicts of Interest
None.
Use of Artificial Intelligence (AI)-Assisted Technology for manuscript preparation
The authors confirm that there was no use of AI-assisted technology for assisting in the writing of the manuscript and no images were manipulated using AI.
References
- Cesarean versus vaginal delivery: Whose risks? Whose benefits? Am J Perinatol. 2012;29:7-18.
- [CrossRef] [PubMed] [Google Scholar]
- WHO recommendations non-clinical interventions to reduce unnecessary caesarean sections. Geneva: WHO; 2018.
- Association between the type of provider and cesarean section delivery in India: A socioeconomic analysis of the national family health surveys 1999, 2006, 2016. PLoS One. 2021;16:e0248283.
- [CrossRef] [PubMed] [PubMed Central] [Google Scholar]
- Trends and projections of caesarean section rates: Global and regional estimates. BMJ Glob Health. 2021;6:e005671.
- [CrossRef] [PubMed] [PubMed Central] [Google Scholar]
- National Family Health Survey (NFHS 3), 2005-06: India: volume I. IIPS. Mumbai, India: IIPS; 2006.
- National Family Health Survey (NFHS-5), 2019-21. Mumbai, India: IIPS: Mumbai, India; 2021.
- Prevalence and determinants of voluntary caesarean deliveries and socioeconomic inequalities in India: Evidence from National Family Health Survey (2015-16) Clin Epidemiol Glob Health. 2020;8:335-42.
- [CrossRef] [Google Scholar]
- A tutorial on spatio-temporal disease risk modelling in R using Markov chain Monte Carlo simulation and the CARBayesST package. Spat Spatiotemporal Epidemiol. 2020;34:100353.
- [CrossRef] [PubMed] [Google Scholar]
- A spatio-temporal model for estimating the long-term effects of air pollution on respiratory hospital admissions in greater London. Spat Spatiotemporal Epidemiol. 2014;10:29-38.
- [CrossRef] [PubMed] [Google Scholar]
- Global epidemiology of use of and disparities in caesarean sections. Lancet. 2018;392:1341-8.
- [CrossRef] [PubMed] [Google Scholar]
- Rate of caesarean section is alarming in China. Lancet. 2014;383:1463-4.
- [CrossRef] [PubMed] [Google Scholar]
- Use of the Robson classification to assess caesarean section trends in 21 countries: a secondary analysis of two WHO multicountry surveys. Lancet Glob Health. 2015;3:e260-70.
- [CrossRef] [PubMed] [Google Scholar]
- Challenges experienced by health care workers during service delivery in the geographically challenging terrains of north-East India: Study involving a thematic analysis. JMIR Form Res. 2024;8:e57384.
- [CrossRef] [PubMed] [PubMed Central] [Google Scholar]
- Prediction of adverse perinatal outcome by cerebroplacental ratio in women undergoing induction of labor. Ultrasound Obstet Gynecol. 2019;53:473-80.
- [CrossRef] [PubMed] [Google Scholar]
- Exclusive breastfeeding for at least four months is associated with a lower prevalence of overweight and obesity in mothers and their children after 2–5 years from delivery. Nutrients. 2022;14:3599.
- [CrossRef] [PubMed] [PubMed Central] [Google Scholar]
- Factors affecting utilization of skilled maternity care services among married adolescents in Bangladesh. Asian Popul Stud. 2009;5:153-70.
- [CrossRef] [Google Scholar]
- Which women are at an increased risk of a caesarean section or an instrumental vaginal birth in the UK: An exploration within the millennium cohort study. BJOG. 2013;120:732-42.
- [CrossRef] [PubMed] [Google Scholar]
- Prevalence and determinants of caesarean section in private and public health facilities in underserved south asian communities: Cross-sectional analysis of data from Bangladesh, India and Nepal. BMJ Open. 2014;4:e005982.
- [CrossRef] [PubMed] [PubMed Central] [Google Scholar]
- The quality of childbirth care in China: Women’s voices: A qualitative study. BMC Pregnancy Childbirth. 2015;15:113.
- [CrossRef] [PubMed] [PubMed Central] [Google Scholar]
- Factors contributing to socio-economic inequality in utilization of caesarean section delivery among women in Indonesia: Evidence from demographic and health survey. PLoS One. 2023;18:e0291485.
- [CrossRef] [PubMed] [PubMed Central] [Google Scholar]


