Translate this page into:
Association of interleukin-10 with hepatitis B virus (HBV) mediated disease progression in Indian population
Reprint requests: Dr Jyotdeep Kaur, Department of Biochemistry, Postgraduate Institute of Medical Education & Research, Chandigarh 160 012, India e-mail: jyotdeep2001@yahoo.co.in
-
Received: ,
This is an open-access article distributed under the terms of the Creative Commons Attribution-Noncommercial-Share Alike 3.0 Unported, which permits unrestricted use, distribution, and reproduction in any medium, provided the original work is properly cited.
This article was originally published by Medknow Publications & Media Pvt Ltd and was migrated to Scientific Scholar after the change of Publisher.
Abstract
Background & objectives:
Interleukin (IL)-10, an anti-inflammatory Th2 cytokine, is one of the key coordinators of the inflammatory responses involved. The present study was designed to evaluate the impact of IL-10 (-819/-592) genotypes, haplotypes, mRNA and the protein levels with risk for hepatitis B virus (HBV) related hepatocellular carcinoma (HCC) development in India.
Methods:
A total of 390 subjects (145 controls, 62 inactive HBV-carriers, 64 chronic-active HBV patients, 60 HBV related cirrhotics and 59 HBV- HCC subjects) were enrolled in the study. Allele specific (AS)-PCR, ELISA and RT-PCR methods were used for assessing polymorphism, spontaneous blood levels and the mRNA expression, respectively of IL-10.
Results:
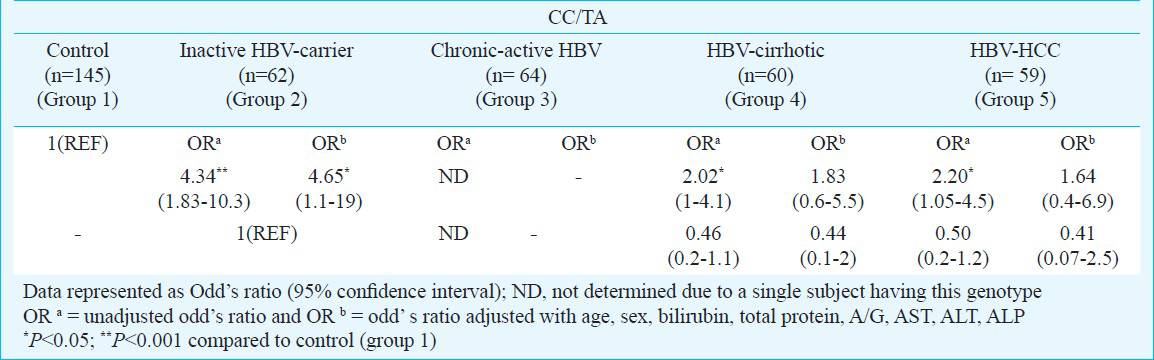
The study revealed that the CC/TA genotype acted as a risk factor for cirrhosis (ORa=2.02; P<0.05) and the subsequent HCC development (ORa=2.20; P<0.05), with controls as reference. However, no significant association was found between the two haplotypes (CC and TA) observed and HCC risk. Moreover, the IL-10 protein and mRNA levels in peripheral blood mono nuclear cells (PBMCs) showed a significant elevation as the disease progressed to cirrhosis. But, no variation was observed in the IL-10 levels in subjects with different IL-10 genotypes.
Interpretation & conclusions:
These preliminary results suggest a strong association of IL10 (-819/-592) with the HBV infection mediated disease progression, from inactive carrier state to malignancy, in Indian population.
Keywords
Cytokines
haplotype
HBV
HCC
IL-10
polymorphism

Hepatocellular carcinoma (HCC) is one of the most frequently occurring tumours worldwide, with an estimated annual incidence of over 600,0001. India is a low incidence zone for HCC with less than 5 cases per 100,000 persons per annum2. Three-quarters of all the cases worldwide are attributed to chronic infection by hepatitis B virus (HBV) and hepatitis C virus (HCV). A strong genetic component determining the outcomes of HBV infection has been established through various studies. Chronic inflammation, mainly mediated by cytokines, orchestrates a tumour-supporting microenvironment. Thus the risk for developing HCC in HBV infected individuals increases with severity of inflammation and fibrosis. Consistent to this, in our previous study, we observed a significant positive association of interleukin-1 receptor antagonist (IL-1RN) 1/2 genotype with HBV-HCC development, among controls and carriers. Besides, its 2/2 genotype acted as a potential risk factor for hepatitis and subsequent cirrhosis development, among the same groups. Moreover, proinflammatory IL-1B levels significantly elevated with the disease progression to HCC, as compared to controls in Indian population3.
IL-10, a Th2 cytokine, is mainly involved in regulation of inflammatory responses. It was originally described as a mouse Th2 cell factor, inhibiting cytokine synthesis by Th1 cells4. IL-10 is a pleiotropic cytokine produced by macrophages, T-helper 2 cells, and B lymphocytes (CD5 subset) and can both stimulate and suppress the immune response. IL-10 has been shown to inhibit various immune functions, such as antigen presentation, cytokine production, macrophage activation, and antigen-specific T-cell proliferation. By interfering with the co-stimulatory function of antigen-presenting cells (e.g. downregulation of class II MHC expression of monocytes and co-stimulatory molecule expression of macrophages), IL-10 reduces antigen-specific T-cell proliferation. IL-10 plays a key role in the oncogenetic and metastatic ability of neoplasms like cervical cancer and B-cell lymphoma56. In the upstream promoter region of the IL10 gene, the two linked biallelic single-nucleotide polymorphisms (SNPs) at the -819(C/T) and -592(C/A) positions7, have been extensively studied. In a study conducted in Japanese population8 the (-819C/-592C) CC haplotype (33%) was observed to be predominantly present in HBV carriers with HCC against the controls. In Taiwanese and Koreans, the IL-10 (-592C/C) genotype was found to be associated with an increased risk of HCC910. IL-10 levels have been shown to be significantly elevated in patients with type B and C chronic liver disease1112. However, little is reported regarding the association of IL-10 (-819/-592) with hepatitis B disease progression from chronic state to malignancy. Thus, the present study was designed to correlate the IL-10 (-819/-592) polymorphism, blood IL-10 and the mRNA levels with HCC risk in patients with HBV infection.
Material & Methods
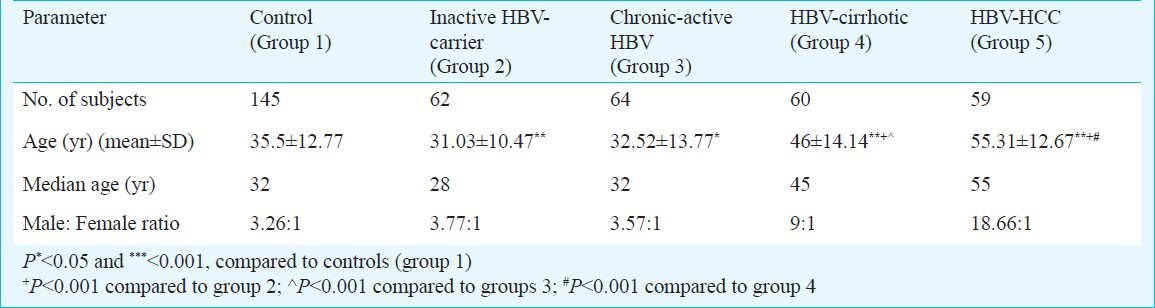
A total of 390 subjects were enrolled in this study. Group 1 included 145 healthy subjects showing no clinical signs and symptoms to suggest any form of disease and underwent HBsAg screening, so were designated as the control group. These were the relatives or the attendants of the patients attending the Hepatology OPD at the Postgraduate Institute of Medical Education and Research (PGIMER), Chandigarh, India during 2007-2012. Group 2 comprised 62 inactive HBV- carriers, HBsAg positive for a period of 6 months or more but with normal levels of transaminases, were HBeAg negative or anti-HBe positive, had serum HBV DNA less than 105 copies/ml and no clinical symptoms of liver disease along with no radiological evidence of cirrhosis or varices on endoscopy. Group 3 consisted of 64 chronic-active HBV patients characterized by HBsAg positivity for a period of 6 months or more along with raised transaminases >1.5 × upper limit of normal (ULN), had serum HBV DNA more than 105 copies/ml and imaging techniques showing no evidence of cirrhosis or no varices on endoscopy. Group 4 included 60 HBV related cirrhotics, HBsAg positive for a period of 6 months or more along with raised transaminases > 1.5 × ULN, had serum HBV DNA more than 105 copies/ml and imaging techniques showing evidence of cirrhosis or varices on endoscopy and ascites detectable by ultrasound. Group 5 included 59 HBV-HCC subjects characterized by concomitant finding of two imaging techniques showing nodule larger than 2 cm with arterial hypervascularization or by one positive imaging technique showing hypervascularization associated with α-foetoprotein levels higher than 400 ng/ml13. Patients attending the Hepatology OPD at Postgraduate Institute of Medical Education and Research, Chandigarh, India, were enrolled consecutively in groups 2, 3, 4 and 5. Based on the genotype distribution data, power of the study was found to be 95 per cent. The protocol of the study was approved by the Institute's Ethics Committee. Informed written consent was obtained from all the subjects. Venous blood (6 ml) was collected from all the subjects. The characteristics of the study are summarized in Table I.
DNA isolation: High molecular weight genomic DNA was isolated from the peripheral blood samples using the standard sodium perchlorate method as described by Daly et al14 and was suspended in TE buffer (pH 8.0; 10 mM Tris and 1 mM EDTA) and finally used for IL-10 genotyping.
Genotyping of IL-10 (-819C>T/-592C>A): The IL-10 (-819/-592) polymorphism was determined by allele-specific PCR (AS-PCR) based method15. The primers used were as follows: Generic primer (antisense): 5’-AGGATGTGTTCCAGGCTCCT-3’, Primer C (sense):5-CCCTTGTACAGGTGATGTAAC-3’ Primer T (sense): 5’-ACCCTTGTACAGGTGATGTAAT-3’; β-actin (forward: 5’-AAACTGGAACGGTGAAGGTG-3’ and reverse: 5’-TCAAGTTGGGGGACAAAAAG-3’ (Sigma-Aldrich Pvt. Ltd., Bangalore, India). Briefly, the PCR reactions were carried out in 8μl volume consisting of 50 ng genomic DNA, 1xPCR buffer (50 mM KCl, 20 mM Tris HCl, pH 8.4), 0.6U Taq DNA polymerase (MBI Fermentas, Life Sciences, USA), 2.5 μM each sequence specific primer, 1.5 μM each internal control (β-actin) primer, 2.5 mM MgCl2 and 200 μM each dNTP per tube. The PCR conditions were as follows: 95°C for 2 min; 15 cycles of 95°C for 15 sec, 61°C for 1 min, 72°C 40 sec; 95°C for 20 sec, 56°C for 50 sec, 72°C for 50 sec for 25 cycles, with a final extension of 10 min in the last cycle. PCR amplification resulted in a 233 bp (IL-10) and 350 bp (β-actin) products, when visualized on 2 per cent agarose gel.
Haplotype and LD (Linkage disequilibrium) analysis: The construction and analysis of haplotypes of each individual were inferred using the PHASE algorithm developed by Stephens et al16, which uses a Bayesian approach incorporating a priori expectations of haplotypic structure based on population genetics and coalescence theory. Haploview version 2.0.2 (Whitehead Institute for Biomedical Research, USA) was used to estimate LD. The linkage disequilibrium (LD) was expressed as Lewontin's D (ID’I) and the LD coefficient r2, between all pairs of biallelic loci.
Measurement of blood IL-10 levels: Peripheral venous blood was collected in sterile heparinized tubes and peripheral blood mononuclear cells (PBMCs) were isolated by using the standard Histopaque (Sigma, St Louis, MO, USA) density gradient centrifugation method17. Their viability was assessed by trypan dye exclusion test18 and were later stored at -80°C. For this purpose, PBMCs were lysed in PBS through repeated freeze–thaw cycles before the determination of the IL-10 levels (105 cells/well) using enzyme-linked immunosorbent assay kit (BD OptEIA™ Set Human IL-10, BD Biosciences Pharmingen, CA, USA). Sensitivity of the kit was 7.8 pg/ml. Initially, we tried to measure the circulating (serum) levels, but in majority of the samples, the IL-10 levels were found to be undetectable, which could be probably due to storage or other technical problems. Since we were interested in analyzing the comparative basal levels of IL-10 in various categories of patients, so we determined the levels in stored PBMCs. For that PBMCs were lysed and IL-10 levels were determined as done by Aceti et al19, who had studied the expression of p-STAT1 in cell lysates of chronic hepatitis C patients.
Reverse transcriptase (RT)-PCR analysis: Total RNA from all subjects was isolated from PBMCs (2 ×10⁵ cells) by using HiPurA™ Total RNA Miniprep Purification Spin kit (Hi-Media Laboratories Pvt. Ltd., Mumbai, India) and cDNA synthesis was carried out from the purified and intact total RNA (100 μg) according to manufacturer's instructions (RevertAid™ First Strand cDNA Synthesis Kit, MBI Fermentas, Life Sciences, USA). Primarily, the quality of RNA was checked on 1.5 per cent formaldehyde agarose gel electrophoresis. Analysis of RNA revealed the 28S and 18S RNA species and depicted the RNA to be in intact form. Expression of IL-10 was evaluated using sequence specific primers20. PCR was carried out in 10 μl reaction mixture consisting of 1× PCR buffer (50 mM KCl, 1.5 mM MgCl2, 20 mM Tris HCl, pH 8.4), 0.6U of Taq polymerase (MBI Fermentas, Life Sciences, USA), 1 μM of primers (Sigma-Aldrich Pvt. Ltd., Bangalore, India) along with 200 μM of each dNTP. In optimized PCR, the initial denaturation step was carried out for 2 min at 95°C. The denaturation, annealing and elongation steps were carried out respectively for 45 sec at 94°C, 45 sec at 65°C (IL-10) or 60°C (β-actin) and 45 sec @72°C for 40 cycles. The final extension step was carried out for 10 min @72°C. The primers were designed using Primer3 Input (version 0.4.0) (http://primer3.ut.ee). The sequences of the primers used were: IL-10 (5’ to 3’)- Forward: TGGTGAAACCCCGTCTCT, Reverse: CTGGAGTACAGGGGCATG; β-actin (5’ to 3’)- Forward: CACTCTTCCAGCCTTCCTT, Reverse: CGGACTCGTCATACTCCT.
The expected PCR products of size 155 and 318 bp were obtained for IL-10 and β-actin (internal control), respectively when electrophoresed on 2 per cent agarose gel. The densitometric analyses of products was determined by using ‘scion image’ software (scion-image.software.informer.com).
Statistical analysis: Genotype frequencies were calculated as the number of participants with a particular genotype divided by the total number of participants. Hardy-Weinberg equilibrium was also tested. The statistical signifigcance was depicted by using Pearson P value. Association between genotypes/haplotypes with HCC risk was calculated as odds ratios (ORs) with 95 per cent confidence intervals (CIs), and their statistical significance was determined by chi-square test using SPSS (v.15 for Windows) and PHASE v2.1 softwares, respectively. OR analysis indicates the risk association of a factor (OR>1: positive association/risk factor; OR<1: negative association/protective factor; OR=1: no association). Further, the adjustment of the OR was done by logistic regression analysis. The densitometric analysis was done by SCION Image Software. The non-parametric Kruskal-Wallis one way-ANOVA and Student's t-test were used to determine the significance of differences in continous variables using GraphPad Prism (version 5) software (graphpad-prism.software.informer.com). Multiple comparisons were done by Mann-Whitney test. Wherever, ANOVA was applied, there multiple comparisons were done by Bonferroni test (P values adjusted). Pearson's correlation analysis was used to estimate the correlations between different parameters. The association of independent variables with cytokine concentration was assessed by multivariate linear regression analysis using Statistical Package for Social Sciences (SPSS Inc., Chicago, IL, version 15.0 for Windows).
Results
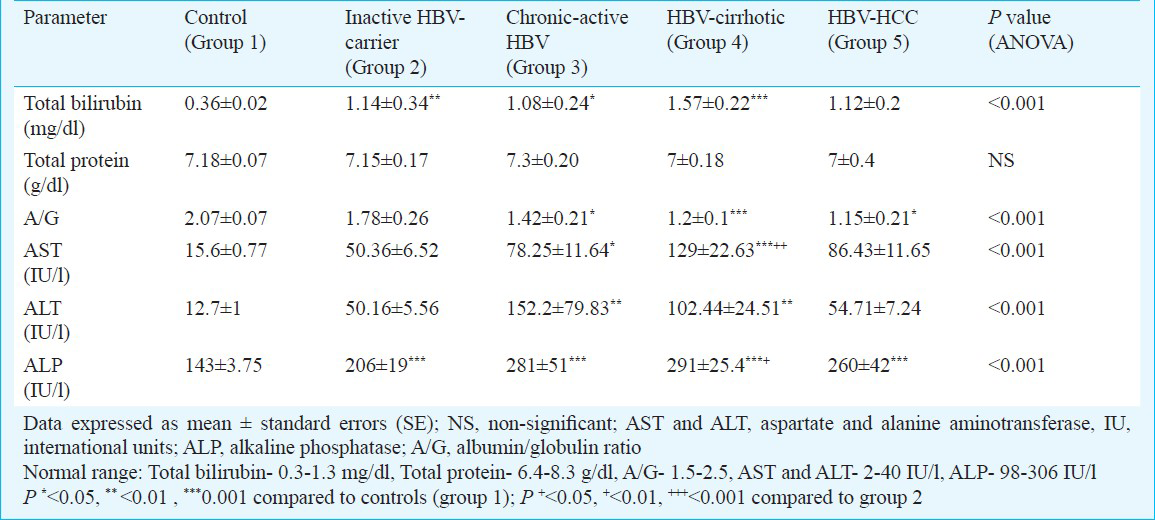
The subjects diagnosed as HBV - HCC showed the highest mean age (55.31 yr) with respect to the other categories. An increased gender ratio (male: female) revealed a distinct male preponderance for HBV - HCC in the present study in all the mentioned groups. The liver function test (LFT) profile depicted that nearly all the investigated parameters were significantly elevated as the disease progresses to cirrhosis, with reference to the controls, thus reflecting an enhancement in degree of disease severity (Table II).
Interleukin-10 (-819C>T/-592C>A) polymorphism analysis: As evident from Fig. 1, the presence of IL-10 (233 bp) band in both the lanes corresponding to wild and variant alleles (sample 1), showed the presence of the heterozygous genotype (CC/TA), while 233 bp band was present corresponding to wild allele (sample 2), depicting wild genotype (CC/CC) when the product was amplified against the variant allele alone (sample 3), that showed the variant genotype (TA/TA).
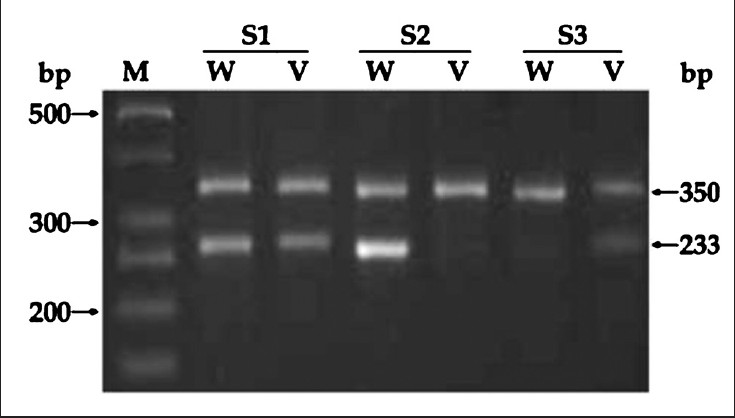
- Allele specific (AS)-PCR analysis of IL-10 (-819/-592) in some representative samples (S1-S3). Lane M: 50 bp DNA ladder; 350 bp band in all lanes: Internal control (β-actin): S1: CC/TA genotype; S2: CC/CC genotype; S3: TA/TA genotype. S: sample, W: wild allele and V: variant allele.
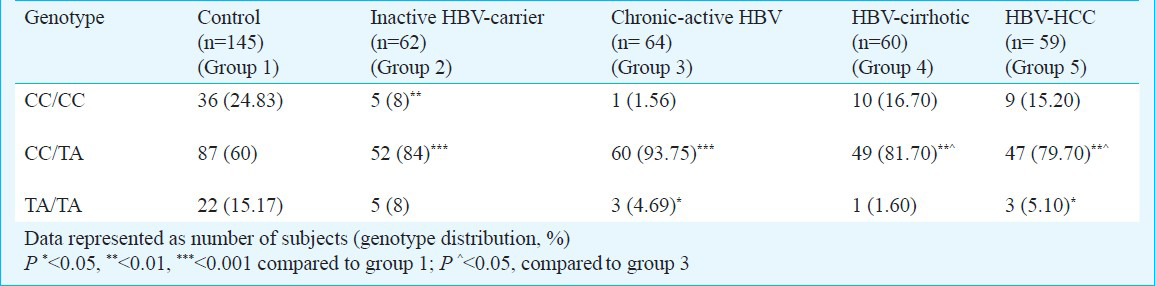
enotype distribution of IL-10 (-819C>T/-592C>A): The genotype distribution analysis of the polymorphic forms of the IL-10 (-819/-592) (Table III) showed that compared with the other categories, the wild genotype (CC/CC) was found to be predominant in the control population (24.83%). However, the CC/TA genotype was observed to be maximally present in the hepatitis category (93.75%). Further, the variant genotype (TA/TA) frequency of 15.17 per cent as observed in controls, was significantly higher, as compared to the hepatitis (4.69%; P<0.05) and the HCC (5.10%; P<0.05) categories. The findings were consistent with the Hardy-Weinberg rule.
Association of IL-10 (-819C>T/-592C>A) genotypes with HBV- HCC risk: The odd's ratio for the association between IL-10 (-819/-592) genotypes and the carcinoma progression taking wild genotype as reference Table IV showed that the heterozygous genotype (CC/TA) was significantly in positive association or a risk factor for the development of inactive HBV carrier state (unadjusted odds ratio, ORa=4.34; P<0.001), cirrhosis (ORa=2.02; P<0.05) and subsequently the HCC (ORa=2.20; P<0.05), with control population as reference.
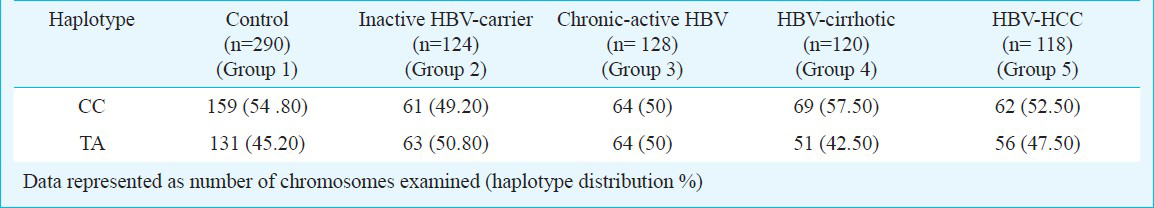
Haplotype distribution of IL-10 (-819C>T/-592C>A): The distribution analysis of IL-10 (-819/-592) haplotypes (Table V) revealed the presence of only two possible haplotypic combinations (wild CC and variant TA). Further, it was observed that all wild type haplotype (CC) was predominantly present in the HBV-cirrhotics (57.50%), while was found to be least in the inactive HBV-carrier category (49.20%). On the contrary, the variant haplotype (TT) was observed to be comparable in carriers (50.80%) and the hepatitis group (50%). Complete linkage disequilibrium (D’=1, r2 =1; P<0.007) was observed in the control group. In contrast, LD was found to be insignificant in the other categories. No significant association of TA haplotype with HCC risk during progression of the disease was observed, among the controls and carriers, with the wild (CC) haplotype as reference (data not shown).
Analysis of blood IL-10 levels: On assaying the spontaneous/unstimulated levels of IL-10 in the PBMCs (Fig. 2), the levels were found to be increased with the disease progression to cirrhosis. The median level of IL-10 was not significantly different in the HBV-carrier group (96.2 pg/ml), and the chronic-active HBV subjects (90.76 pg/ml), as compared to controls (78.31 pg/ml). However, the levels were significantly elevated (median: 102.66 pg/ml, P<0.01) in the HBV-cirrhotics and were significantly lower in HCC (85.27 pg/ml P<0.05). There was a non-significant elevation in IL-10 (median ± SEM) levels, in individuals with CC/TA genotype (80.52 ± 10.71) pg/ml when compared to the subjects with CC/CC and the TA/TA genotypes, in case of HBV-carriers (Fig. 3). The Pearson correlation analysis of IL-10, showed a positive correlation between IL-10 levels and the genotypes (r = 0.157; P<0.05). Further, on multiple regression analysis (variables assessed in this analysis included IL-10 genotype, total protein, A/G, OT, PT, billirubin, and alkaline phosphatase), genotypes were also found to significantly affect IL-10 levels.
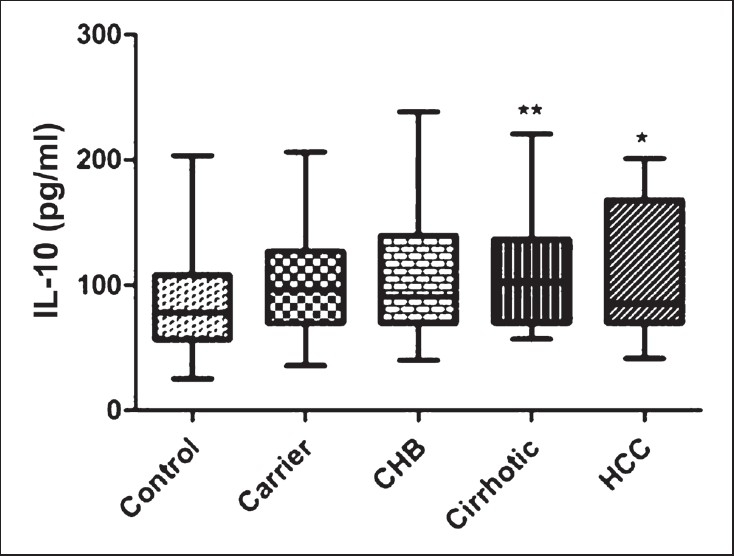
- ELISA analysis of IL-10 levels of various categories. Box and whisker plot depicting median value (middle line) and whiskers showing minimum to maximum values. P*<0.05, **<0.01 compared to controls.
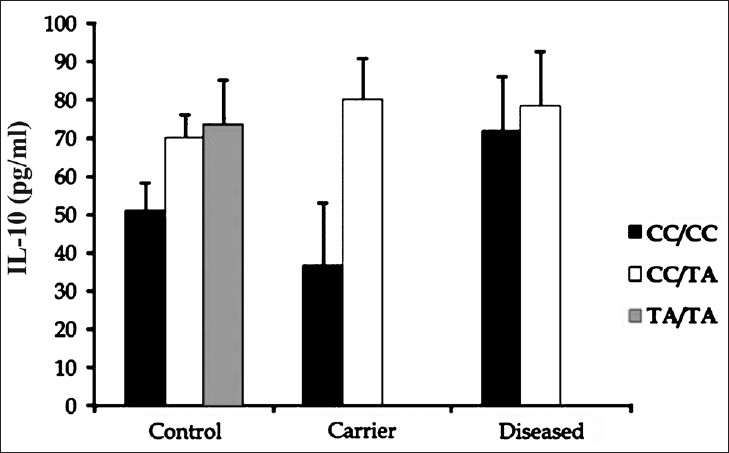
- IL-10 levels in control, carrier and the diseased groups with different IL-10 (-819C>T/-592C>A) genotypes. Data represented as (median ± SEM) pg/ml. The levels of TA/TA genotype individuals in “carriers” and “diseased” groups, were found to be undetectable.
RT-PCR analysis of IL-10: The mRNA expression (normalized with β-actin) of IL-10 revealed that the maximum relative expression was observed in cirrhotics, which was 3.4-fold higher than controls (P<0.001), 4-fold higher than carriers (P<0.001) and almost 2-fold more than that in hepatitis group (P<0.01). However, a significant decrease (3.7-fold; P<0.001) was evident, once the disease progressed to HCC (data not shown).
Discussion
Hepatitis B virus is an infectious agent, causing chronic infection, leading infected patients to various clinical conditions from asymptomatic status to liver cirrhosis, and sometimes to hepatocellular carcinoma (HCC). Since HBV is a noncytolytic virus, the most part of the pathology in HBV infection is thought to be mediated by the host immune response against the viral products21. A shift of Th1/cell-mediated immune responses (involved in viral clearance) to Th2/humoral immune responses (involved in viral persistence) has been implicated in determining the rate of HBV infection chronicity and HBV-induced liver injury. Moreover, the major Th2/anti-inflammatory cytokine includes IL-10, a potent immuno-modulatory molecule, which is produced by lymphoid cells and exerts its functions by inhibiting macrophage/monocyte and T-cell lymphocyte replication and secretion of proinflammatory cytokines (IL-1, TNF-α, TGF-β, IL-6, IL-8 and IL-12)15. Chronic liver disease provokes both inflammatory and anti-inflammatory responses, responsible for high IL-10 levels. Active inflammatory status may result in tumour appearance. Keeping this in mind, this study was planned to evaluate the association between the IL-10 (-819/-592), genotypes, haplotypes, the spontaneous blood levels and the mRNA levels of this cytokine during the progression of hepatitis B infection from the inactive carrier state to the malignancy in the north Indian population. The heterozygous genotype (CC/TA) was the predominant form in both the control and the diseased categories. This observation was found to be consistent with the study done by Roh et al22 in which the same genotype was highest in both controls and cervical cancer patients. Upon studying the association of the genotypes with HBV progression and subsequent HCC risk, the CC/TA genotype was observed to be a significant risk factor and the subsequent HCC development, with controls as reference. On the contrary, no significant association was observed for the same, with HBV-carriers as the referent group. Parallel to this, a study conducted by Nieters et al23 in Chinese population also showed no significant association of wild and the heterozygous genotypes with HCC risk. The haplotype analysis revealed that the studied single nucleotide polymorphisms (SNPs) were in strong linkage disequilibrium with each other, consistent to the other studies7101524. However, no significant association was found between the two haplotypic combinations (CC and TA) observed and the HCC risk. Similar results were obtained in a study done in the Korean women22, where no association between IL-10 promoter haplotypes (-1082/-819/-592) and cervical cancer risk was observed.
IL-10 blood levels became higher in accordance with the disease progression to cirrhosis. These observations were similar to the earlier studies where elevated serum IL-10 levels have been reported in patients with chronic hepatitis and cirrhosis25. Increased levels of IL-10 might reflect the degree of inflammation in the liver2627 and increased production of IL-10 might be contributed by many cell types such as CD4+ T cells, monocytes and macrophages. The levels of IL-10 were found to be low in the HCC patients. Our findings were consistent with a similar study done in the Japanese population21. It has been reported that the inter-individual diferences in cytokine production appear to be related to allelic polymorphisms of cytokine genes28. The cytokine levels are also influenced by various factors, such as inflammation, fibrosis, viral load, viral antigen load, and the occurrence of malignancy in the liver293031 and such factors relating to the changes of individual cytokine levels differed with the disease phases. It has been reported that when the patients with HCC are put in immuno-suppressive conditions, the cancer cells themselves may contribute to the conditions by producing immuno-suppressive agents, such as transforming growth factor beta 1 (TGF-β)32. Numerous other studies have also reported the elevated serum levels of IL-10 in HBV patients compared with controls283334. On the contrary, in a study conducted by Song et al11 in HBV-infected Vietnamese patients, the IL-10 levels were found to be a poor predictor of the disease outcome with no association with the clinical presentation of HBV. These results are in contradiction to the present study. The difference in results can be explained on the basis, that Song et al11, have determined the circulating IL-10 levels, while in our study PBMCs were used for analysis. No significant differences were observed, on correlating the genotypes with the blood levels of IL-10, consistent with the findings of Roh et al22. Further, there was increased IL-10 expression in the HBV and the cirrhotic groups, with reference to controls. A similar elevated mRNA levels were reported in the diseased group in a study done in HIV-HCV co-infected Chinese population35. In the present study, the mRNA and the protein levels of IL-10 were found to be consistent with each other indicating the increased synthesis of IL-10 in the diseased groups.
The major limitation of the study was the small sample size, which demands a further validation of the findings obtained, by carrying out studies on a larger set of population. Also, HBV genotyping and core promoter mutations were not assessed in this study, so that could be a confounder to the findings presented.
In conclusion, a positive association of IL-10 (-819/-592) CC/TA genotype with HBV related disease progression and risk of HCC development was observed. Based on the protein and mRNA levels analysis, the present study indicates that IL-10 is a potential candidate gene, strongly associated in predicting the transition of HBV related disease phases.
References
- Natural history of hepatitis-related hepatocellular carcinoma. World J Gastroenterol. 2008;14:1652-6.
- [Google Scholar]
- Epidemiology of viral hepatitis and hepatocellular carcinoma. Gastroenterology. 2012;142:1264-73.
- [Google Scholar]
- Interleukin-1 polymorphism and expression in hepatitis B virus-mediated disease outcome in India. J Interferon Cytokine Res. 2013;33:80-9.
- [Google Scholar]
- Hijacking and exploitation of IL-10 by intracellular pathogens. Trends Microbiol. 2001;9:86-92.
- [Google Scholar]
- Interleukin-10 is a potent inhibitor of tumor cytotoxicity by human monocytes and alveolar macrophages. J Leukoc Biol. 1994;55:437-42.
- [Google Scholar]
- Non-Hodgkin's B cell lymphoma in persons with acquired immunodeficiency syndrome is associated with increased serum levels of IL-10, or the IL-10 promoter -592 C/C genotype. Clin Immunol. 2003;109:119-29.
- [Google Scholar]
- Cytokine gene polymorphisms in Japanese patients with hepatitis B virus infection-association between TGF-beta1 polymorphisms and hepatocellular carcinoma. J Hepatol. 2005;42:505-10.
- [Google Scholar]
- Genetic restriction of HIV-1 pathogenesis to AIDS by promoter alleles of IL10. Proc Natl Acad Sci U S A. 2000;97:14467-72.
- [Google Scholar]
- Correlation of interleukin-10 gene haplotype with hepatocellular carcinoma in Taiwan. Tissue Antigens. 2006;67:127-33.
- [Google Scholar]
- Serum cytokine profiles associated with clinical presentation in Vietnamese infected with hepatitis B virus. J Clin Virol. 2003;28:93-103.
- [Google Scholar]
- Cytokine patterns correlate with liver damage in patients with chronic hepatitis B and C. Ann Clin Lab Sci. 2006;36:144-0.
- [Google Scholar]
- Serum tumor markers for detection of hepatocellular carcinoma. World J Gastroenterol. 2006;12:1175-81.
- [Google Scholar]
- Interleukin 10 haplotype associated with increased risk of hepatocellular carcinoma. Hum Mol Genet. 2003;12:901-6.
- [Google Scholar]
- A new statistical method for haplotype reconstruction from population data. Am J Hum Genet. 2001;68:978-89.
- [Google Scholar]
- Separation of lymphocytes, granulocytes, and monocytes from human blood using iodinated density gradient media. Methods Enzymol. 1984;108:88-102.
- [Google Scholar]
- Trypan blue exclusion assay by flow cytometry. Braz J Med Biol Res. 2014;47:307-15.
- [Google Scholar]
- Undetectable phospho-STAT1 in peripheral blood mononuclear cells from patients with chronic hepatitis C who do not respond to interferon-α therapy. Liver Int. 2005;25:987-93.
- [Google Scholar]
- Estimation of mRNA levels of interleukin (IL)-10, tumor necrosis factor (TNF) - α, IL-4 and interferon (IFN)-γ in HIV infected children in Mumbai. Indian J Clin Biochem. 2006;21:15-26.
- [Google Scholar]
- Alteration of serum cytokine balances among different phases of chronic hepatitis B virus infection. Hepatol Res. 2006;34:214-21.
- [Google Scholar]
- Interleukin-10 promoter polymorphisms and cervical cancer risk in Korean women. Cancer Lett. 2002;184:57-63.
- [Google Scholar]
- Effect of cytokine genotypes on the hepatitis B virus-hepatocellular carcinoma association. Cancer. 2005;103:740-8.
- [Google Scholar]
- Association of tumor necrosis factor alpha and IL-10 promoter polymorphisms with rheumatoid arthritis in North Indian population. Rheumatol Int. 2010;30:1211-7.
- [Google Scholar]
- Serum interleukin-10 but not interleukin-6 is related to clinical outcome in patients with resectable hepatocellular carcinoma. Ann Surg. 2000;231:552-8.
- [Google Scholar]
- Serum levels of IL-10, IL-15 and soluble tumour necrosis factor-alpha (TNF-alpha) receptors in type C chronic liver disease. Clin Exp Immunol. 1997;109:458-63.
- [Google Scholar]
- Immunoregulatory cytokines in chronic hepatitis C virus infection: pre- and posttreatment with interferon alfa. Hepatology. 1996;24:6-9.
- [Google Scholar]
- Circulating IL-2, IL-10 and TNF-alpha in chronic hepatitis B: their relations to HBeAg status and the activity of liver disease. Hepatogastroenterology. 2000;47:1675-9.
- [Google Scholar]
- Hepatitis B core antigen stimulates interleukin-10 secretion by both T cells and monocytes from peripheral blood of patients with chronic hepatitis B virus infection. Clin Exp Immunol. 2004;135:462-6.
- [Google Scholar]
- Frequencies of interferon-gamma and interleukin-10 secreting cells in peripheral blood mononuclear cells and liver infiltrating lymphocytes in chronic hepatitis B virus infection. Hepatol Res. 2003;27:109-16.
- [Google Scholar]
- Possible contribution of circulating transforming growth factor-beta1 to immunity and prognosis in unresectable hepatocellular carcinoma. Liver Int. 2004;24:21-8.
- [Google Scholar]
- Soluble interleukin-2 receptor and interleukin-10 levels in patients with chronic hepatitis B infection. Hepatogastroenterology. 2000;47:828-31.
- [Google Scholar]
- Interleukin-10 promoter polymorphisms in patients with hepatitis B virus infection or hepatocellular carcinoma in Chinese Han ethnic population. Hepatobiliary Pancreat Dis Int. 2006;5:60-4.
- [Google Scholar]
- Hepatic inflammatory cytokine mRNA expression in hepatitis C virus-human immunodeficiency virus co-infection. J Viral Hepat. 2008;15:331-8.
- [Google Scholar]


