
Translate this page into:
A machine learning approach to predict hypertension using cross-sectional & two years follow up data from a health & demographic cohort of Assam, North East India
For correspondence: Dr Prasanta Kumar Borah, Department of Epidemiology and Nutrition Section, ICMR-Regional Medical Research Centre, NE Region, Dibrugarh 786 001, Assam, India e-mail: prasant47@yahoo.com
-
Received: ,
Accepted: ,
Abstract
Background & objectives
Hypertension affects a sizable section of the world population and is being recognised as a growing problem. Its prediction using machine learning (ML) algorithms, will add to its control and prevention. The objective of the present investigation was to check the applicability of ML approaches in the prediction and detection of hypertension.
Methods
We included 53,301 participants at baseline from a health and demographic surveillance system in Dibrugarh, Assam (Dibrugarh-HDSS). We constructed two models, one at baseline and the other after two years of follow-up. Of the total participants (baseline: 29,402; follow up: 4,400), 70 per cent were randomly selected to fit seven popular classification models namely decision tree classifier (DTC), random forest classifier (RFC), support vector machine (SVM), linear discriminant analysis (LDA), logistic regression, Ada-boost classifier, and XG boost classifier. The data from the remaining 30 per cent were used to evaluate the performance of the models.
Results
In the baseline data, the Ada-boost classifier could identify hypertension with a maximum accuracy score of 87.02 per cent (CI: 86.01-88.03). The maximum area under the curve (AUC) score of 98.37 per cent (CI: 97.36-99.38) was obtained under RFC. For the prediction of risk at two years, the maximum average accuracy score of 77.57 per cent (CI: 76.6-78.54) was achieved under X-G Boost followed by RFC (77.2%, CI: 76.15-78.25) and a maximum AUC of (85.82%, CI: 84.88-86.76) was obtained under RFC.
Interpretation & conclusions
In both the identification and prediction of hypertension, RFC was found to be better than the other classifiers. ‘Waist circumference’ followed by ‘body mass index’ (BMI) were found to have maximum relative importance in the identification of hypertension, while in the case of two-year risk prediction, the baseline ‘systolic blood pressure’ (SBP), diastolic blood pressure (DBP), and ‘BMI’ had the maximum relative importance. The findings revealed the potential of predictive models in accurately identifying high-risk individuals, enabling timely interventions, and optimising clinical decision-making.
Keywords
Feature selection
HDSS
hypertension
machine learning-predictive models
relative importance

Hypertension, one of the major cardiovascular diseases, is known to be the top risk factor for mortality as well as economic burden1,2. Studies involving randomised controlled trials have found that various cardiovascular disease (CVD) events can be reduced significantly with the control of blood pressure3. Thus, with the increase in the prevalence of diabetes and hypertension, several studies have been conducted utilising machine-learning techniques for early and accurate disease detection. Evaluation of various risk factors for hypertension traditionally depends on various statistical models utilising factors such as demographic factors (age, gender, occupation, etc.), health parameters, family history, behavioural factors, and lifestyle factors, etc. The application of machine learning in medicine ranges from conventional approaches, such as logistic and linear regression, to more complex techniques, such as artificial neural networks (ANN). These machine-learning algorithms are designed to help medical professionals make clinical decisions4.
In recent years, numerous models predicting incident hypertension have emerged. However, alongside this surge in the relevant literature, a significant divergence has been observed in how study groups were structured, the variables incorporated into the models, and the methodologies employed for model construction. In a study conducted by Golino et al5, a model was developed based on a decision tree to classify the participants into pre-hypertensive and hypertensive groups based on various body composition measures, with a sensitivity of 58.38 per cent, specificity of 69.7 per cent, and an AUC of 0.688 for men. Another hybrid model based on modular neural networks and fuzzy logic was developed to diagnose a person’s hypertension risk by considering age, risk factors, and blood pressure over 24 h. For the modular neural network, the learning accuracy in the first module was 98 per cent, the second module was 97.62 per cent, and the third module was 97.83 per cent whereas for the night profile, the fuzzy system was compared to a traditional system of production rules, and it was observed that the first produced all correct outputs while the second produced only 53 per cent of the outputs6.
In the present study, we tried to predict hypertension using Dibrugarh-HDSS (health and demographic surveillance system) dataset at baseline and at two years of follow up. We included some statistically significant features of the participants and used seven classification models namely decision tree classifier (DTC), random forest classifier (RFC), support vector machine (SVM), linear discriminant analysis (LDA), logistic regression (LR), adaptive boosting (Ada-Boost) classifier and extreme gradient boosting (XG boost) classifier.
Materials & Methods
This study was undertaken by the department of Epidemilogy and Nutrition, ICMR-Regional Medical Research Centre, NE Region, Dibrugarh, Assam, India after obtaining the approval from the Institutional Ethics Committee.
Source of data
The HDSS, originally called a population laboratory, is one of the prominent sources of socio-demographic and public health data within a community. HDSS, Dibrugarh (Dibrugarh-HDSS), launched in the year 2019, included a total of 1,06,769 participants from 60 villages and 20 tea estates in Dibrugarh District, Assam, a State in north-east India7. It collects information on a wide range of characteristics of the participants (>18 yr), including socio-demographic, anthropometric, behavioural, and clinical profiles such as blood pressure (BP).To facilitate data collection, 30 well-trained field assistants were appointed. The quality of collected data, including BP measurements, was assessed during the data collection time by the respective supervisors. The collection of data was done using a mobile application specially developed for the study.
After removing the outliers and participants <18 yr, 53,301 participants were identified based on completeness of relevant information, of which 14,701 were from the hypertensive group, and 38,600 were from the normotensive group. The blood pressure categories were based on the ESC-ESH Guidelines8. An imbalanced dataset can lead to poor model performance and affect the evaluation of the model accuracy because the model may become biased towards the majority class. To handle this problem, one of the simplest methods ‘oversampling and under sampling’ technique, was used9 in the present study. The basic idea behind this strategy was to resample the original dataset randomly, either by over-sampling the smallest class or under-sampling the largest class until the sizes of the classes were approximately the same. Using under-sampling data balancing technique9, the data set was balanced, and finally, 29,402 participants (14,701 cases from the hypertensive group and 14,701 cases from the normotensive group) were used to train and evaluate the models for identification of hypertension. Again, normotensive (n=38,600) individuals were followed up after two years, of which 1,437 were found to be hypertensive. Using over-sampling and under-sampling techniques, the dataset was balanced, and finally, 4,400 cases were used for training and evaluation of the models for predicting hypertension after two years. For internal validation, the Train-Test Split method was utilised. Seventy per cent of the data set was used for model training, and the remaining 30 per cent was used for testing and evaluating the model performance for both the data sets (baseline and 2-yr follow up). Details are highlighted in figure 1.
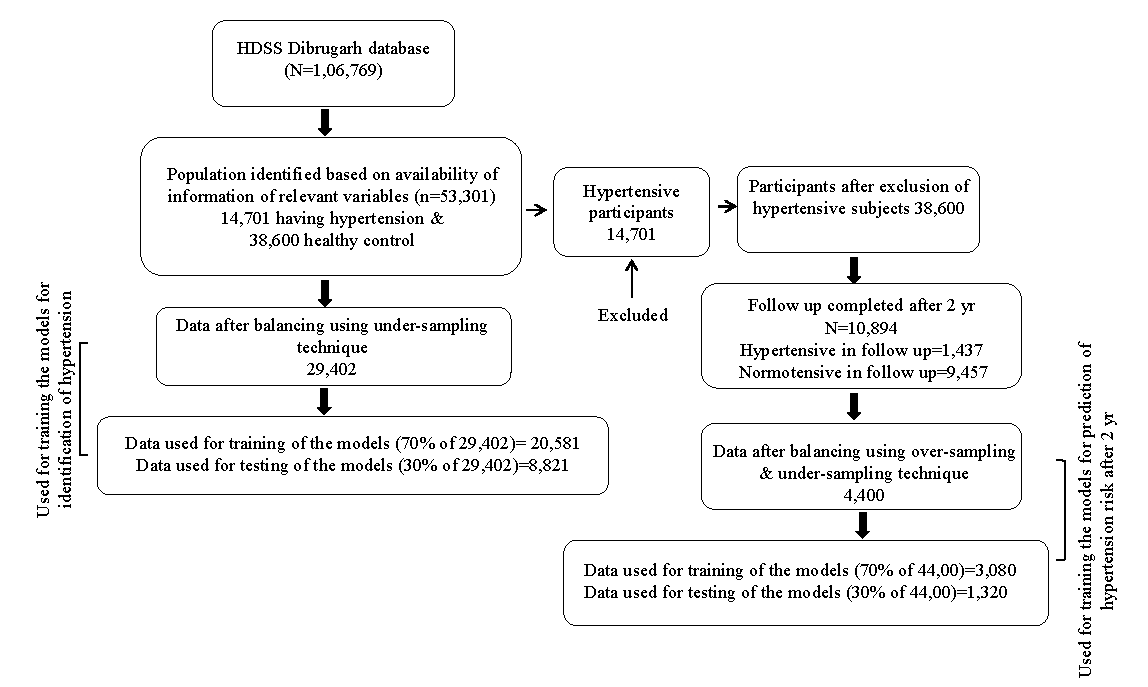
- Flow diagram showing sample sizes in different stages.
Different statistical analyses were performed using the IBM-SPSS software for Windows, Version 26.0 (IBM Corp., New York, USA). The models were developed using Python (version 3.11.5) and Scikit-learn library (version 1.4.1) within the Jupyter Notebook environment. Additional libraries used include NumPy (version 1.24.3) for numerical operations and pandas (version 2.0.3) for data manipulation, and Yellow brick for data visualisation. As our primary objective of this study was to check the applicability of the ML approach in the prediction of hypertension based on some readily available features, we utilised the default hyperparameters setting as a baseline to assess the model’s performance and generate a benchmark.
Statistical test and classification models used for prediction
To identify the significant predictors (scale variables), an independent t-test was performed between hypertensive and normotensive groups. On the other hand, for categorical predictors, the chi-square test was used to determine the degree of association between these two groups. For both identification and prediction of the risk of hypertension after two years, seven classification algorithms, namely, DTC, RFC, SVM, LDA, LR, Ada-Boost classifier, and XG boost classifier were used.
Classification models used for prediction
Decision tree classifier
The decision tree is a prominent predictive modelling technique used in statistics, machine learning, and data mining. It is a multistage classification approach organised in a tree structure, with each internal node representing an attribute test. Each branch represents the test’s outcome. Each leaf node is assigned a class label (or dependent variable)10. A decision tree is simply transformed into a categorisation rule.
Random forest classifier
RFC is an extension of the DTC. During training, it generates a large number of decision trees and then outputs the mode of the classes (classification) or the mean prediction (regression) of the individual trees. Each decision tree in the forest is trained on a random subset of the training data, and each node of the tree considers a random subset of features for splitting. This randomness helps to decorrelate the individual trees, which reduces overfitting and improves the model’s generalisation performance11. Random Forests are well-known for their robustness, scalability, and capacity to handle multidimensional data with complex interactions.
Linear discriminant analysis
Linear discriminant analysis introduced by R.A. Fisher is a popular multivariate technique for pattern recognition and classification. This technique identifies a linear combination of attributes that define two or more classes of objects. The resulting linear combination can be utilised as a linear classifier12.
Support vector machine
SVM, developed by Vladimir Vapnik with his colleagues at AT&T Bell Laboratories, is a robust and accurate classification technique. SVM has a solid theoretical foundation and requires relatively fewer training instances. It finds the optimum hyperplane in the input space that distinguishes the classes13.
Multinomial logistic regression
LR is a prominent statistical technique that models the relationship between one or more predictor factors and the probability of the outcome falling into a specific category. Unlike linear regression, LR predicts the probability of the event using the logistic function, which assures that the projected probabilities fall between 0 and 114.
AdaBoost classifier
AdaBoost gradually combines numerous weak learners (often basic decision trees), with each succeeding learner focused on the instances misclassified by the preceding ones. AdaBoost assigns weights to training instances, with more weights given to misclassified instances, emphasising the cases that are harder to categorise. It builds a powerful classifier by iteratively modifying the weights to reduce overall classification error. AdaBoost is well-known for its ability to outperform individual weak learners and resist overfitting15.
XG boost classifier
XGBoost is a very efficient and scalable machine learning technique that excels at classification, regression, and ranking problems. It falls under the umbrella of ensemble learning methods, notably gradient-boosting machines, which successively combine weak learners (usually decision trees) to construct a powerful prediction model. XGBoost minimises a regularised objective function to optimise both bias and variance, using techniques like gradient boosting and regularisation16.
Evaluation Measures used to evaluate the performance of the models
Confusion matrix and accuracy scores
A confusion matrix is the simplest method for evaluating the performance of a classification model. It visualises the prediction results by comparing the predicted labels against the actual labels. It can be used for both binary as well as multiclass classification models.
Accuracy score, which is the ratio between the number of correct predictions and the number of test sample is a simple measure to evaluate the model performance11. It is derived by (Ref:)
Where, TP=True Positive, FP=False Positive, TN=True Negative, FN=False Negative.
ROC curve (receiver operating characteristic curve), precision and recall
A receiver operating characteristic curve (ROC) is a two-dimensional graph showing the performance of a classification model at all classification thresholds. In this plot True Positive Rate (TPR) is plotted on the Y axis and False Positive Rate (FPR) is plotted on the X axis where-
With the help of the predicted outcomes of the fitted models, the precision and recall value is calculated for each instrument, where,
In machine learning, precision (also called positive predictive value) gives the value of the fraction of relevant instances among the retrieved instances, and recall (also known as sensitivity) gives the value of the fraction of relevant instances that were retrieved11. Where both false positive and false negative are equally serious, F-1 score is an effective model evaluation measure, which is the harmonic mean of precision and recall.
Since the splitting of the dataset for training and testing is purely random, the process is repeated 100 times so that the average value and the 95% confidence intervals (CI) of the average accuracy score can be calculated using the formula
where =average accuracy score, Z=1.96, s=sample standard deviation, n=sample size.
Variables considered as predictors
Of the wide range of data collected in Dibrugarh-HDSS, we included features that were relevant in the context of hypertension prediction. An independent t-test was performed to identify the variables having a significant difference in mean between hypertensive and normotensive participants. Similarly, we carried out a Chi-square test for categorical variables. Features having statistically significant differences in both the groups were finally used for training of the models (Table I and II). Following these basic analyses, we selected 19 variables in our study for prediction of hypertension at base line. For the prediction of the risk of hypertension after two yr a set of 19 features were considered, of which some features were common for constructing a prediction model at baseline.
| Variables |
Hypertensive (N=14,701); n (%) |
Normotensive (N=14,701); n (%) |
P value | ||
|---|---|---|---|---|---|
| Scale variable | BMI | 20.7056 | 17.9102 | <0.001 | |
| Waist circumference | 76.0086 | 62.8512 | <0.001 | ||
| W-H ratio | 0.9089 | 0.8537 | <0.001 | ||
| Categorical variable | Location | Village | 6711 (45.6) | 4754 (37.3) | <0.001 |
| Tea garden | 7990 (54.4) | 9947 (67.7) | |||
| Age group (yr) | 18-30 | 1950 (13.3) | 8143 (55.4) | <0.001 | |
| 30-40 | 2906 (19.8) | 3293 (22.4) | |||
| 40-50 | 3469 (23.6) | 1686 (11.5) | |||
| 50-60 | 3239 (22) | 958 (6.5) | |||
| 60< | 3137 (21.3) | 621 (4.2) | |||
| Sex | Male | 7230 (49.2) | 5133 (34.9) | <0.001 | |
| Female | 7471 (50.8) | 9568 (65.1) | |||
| Family type | Nuclear | 12089 (82.2) | 11979 (81.5) | 0.049 | |
| Joint | 2612 (17.8) | 2722 (18.5) | |||
| Religion | Hindu | 13980 (95.1) | 14136 (96.2) | <0.001 | |
| Muslim | 407 (2.7) | 240 (1.6) | |||
| Christian | 303 (2.1) | 323 (2.1) | |||
| Others | 11 (0.1) | 2 (0.1%) | |||
| Educational qualification | Illiterate | 6922 (47.1) | 5602 (38.1) | <0.001 | |
| Primary | 3121 (21.2) | 3672 (25) | |||
| Up to 10th | 3369 (22.9) | 4013 (27.3) | |||
| H.S. & above | 1289 (8.8) | 1414 (9.6) | |||
| Occupation | Daily wage earner | 5198 (35.4) | 6703 (45.6) | <0.001 | |
| Service & business | 3001 (20.4) | 2030 (13.8) | |||
| Home maker | 4200 (28.6) | 3933 (26.8) | |||
| Unemployed | 2302 (15.7) | 2035 (13.8) | |||
| Marital status | Married | 1263 (8.6) | 3736 (25.4) | <0.001 | |
| Unmarried | 10976 (74.7) | 9948 (67.7) | |||
| Widow & separated | 2462 (16.7) | 1017 (6.9) | |||
| Food habit | Vegetarian | 147 (1) | 136 (0.9) | 0.275 | |
| Non-vegetarian | 14554 (99) | 14565 (99.1) | |||
| Extra-salt | Yes | 5939 (40.4) | 5472 (37.2) | <0.001 | |
| No | 8762 (59.6) | 9229 (62.8) | |||
| Physical activity | Light | 5298 (36) | 4962 (33.8) | <0.001 | |
| Moderate | 8516 (57.9) | 8975 (61.1) | |||
| Heavy | 887 (5.2) | 764 (5.2) | |||
| Smoking habit | Yes | 804 (5.5) | 468 (3.2%) | <0.001 | |
| No | 13897 (94.5) | 14233 (96.8) | |||
| Tobacco consumption | Yes | 8207 (55.8) | 5683 (38.7) | <0.001 | |
| No | 6496 (44.2) | 9018 (61.3) | |||
| Alcohol consumption | Yes | 6434 (43.8) | 3563 (24.2) | <0.001 | |
| No | 8267 (56.2) | 11138 (75.8) | |||
| Diabetes | Yes | 475 (3.2) | 23 (0.2) | <0.001 | |
| No | 14226 (96.8) | 14678 (99.8) | |||
| Heart disease | Yes | 70 (0.5) | 15 (0.1) | <0.001 | |
| No | 14631 (99.5) | 14686 (99.9) | |||
| Stroke history | Yes | 86 (0.6) | 1 (0.01) | <0.001 | |
| No | 14615 (99.4) | 14700 (99.99) | |||
| Variables | Hypertensive (N=2,200) | Normotensive (N=2,200) | P value | ||
|---|---|---|---|---|---|
| Scale variable | BMI | 21.1 | 19.99 | <0.001 | |
| Waist circumference | 77.21 | 74.11 | <0.001 | ||
| SBP | 125.04 | 116.91 | <0.001 | ||
| DBP | 79.89 | 76.02 | <0.001 | ||
| Hip circumference | 84.93 | 82.53 | 0.063 | ||
| W-H ratio | 0.9 | 0.89 | 0.665 | ||
| Categorical variable | Location | Village | 1700 (77.3%) | 1483 (67.4%) | <0.001 |
| Tea garden | 500 (22.7%) | 717 (32.6%) | |||
| Age group (yr) | 18-30 | 494 (22.5%) | 984 (44.7%) | <0.001 | |
| 30-40 | 534 (22.4%) | 640 (29.1%) | |||
| 40-50 | 500 (22.7%) | 328 (14.9%) | |||
| 50-60 | 378 (17.2%) | 150 (6.8%) | |||
| 60< | 294 (13.4%) | 98 (4.5%) | |||
| Sex | Male | 1118 (50.8%) | 934 (42.5%) | <0.001 | |
| Female | 1082 (49.2%) | 1266 (57.5%) | |||
| Family type | Nuclear | 1880 (85.5%) | 1934 (87.9%) | 0.017 | |
| Joint | 320 (14.5%) | 266 (12.1%) | |||
| Religion | Hindu | 2123 (96.5%) | 2138 (97.2%) | 0.017 | |
| Muslim | 43 (2.0%) | 25 (1.1%) | |||
| Christian | 28 (1.3%) | 37 (1.7%) | |||
| Sikh | 2 (0.1%) | 0 | |||
| Buddhist | 4 (0.2%) | 0 | |||
| Educational qualification | Illiterate | 704 (30%) | 548 (24.9%) | <0.001 | |
| Primary | 526 (23.9%) | 491 (22.3%) | |||
| Up to 10th | 680 (30.9%) | 799 (36.3%) | |||
| H.S. & above | 290 (13.2%) | 362 (16.5%) | |||
| Occupation | Daily wage earner | 719 (32.7%) | 821 (37.3%) | 0.001 | |
| Service & business | 421 (19.1%) | 374 (17%) | |||
| Home maker | 715 (32.5%) | 729 (33.1%) | |||
| Unemployed | 345 (15.7%) | 276 (12.5%) | |||
| Marital status | Married | 1689 (76.8%) | 1654 (75.2%) | <0.001 | |
| Unmarried | 264 (12%) | 404 (18.4%) | |||
| Widow & separated | 247 (11.2%) | 142 (6.5%) | |||
| Food habit | Vegetarian | 26 (1.2%) | 24 (1.1%) | 0.776 | |
| Non-vegetarian | 2174 (98.8%) | 2176 (98.9%) | |||
| Extra-salt | Yes | 737 (33.5%) | 612 (27.8%) | <0.000 | |
| No | 1463 (66.5%) | 1588 (72.2%) | |||
| Physical activity | Light | 616 (28%) | 538 (24.5%) | <0.000 | |
| Moderate | 1258 (57.2%) | 1387 (63%) | |||
| Heavy | 326 (14.8%) | 275 (12.5%) | |||
| Smoking habit | Yes | 109 (5%) | 142 (6.5%) | 0.032 | |
| No | 2091 (95%) | 2058 (93.5%) | |||
| Tobacco consumption | Yes | 1048 (47.6%) | 861 (39.1%) | <0.001 | |
| No | 1152 (52.4%) | 1339 (60.9%) | |||
| Alcohol consumption | Yes | 763 (34.7%) | 640 (29.1%) | <0.001 | |
| No | 1437 (65.3%) | 1560 (70.9%) | |||
| Diabetes | Yes | 38 (1.7%) | 2 (0.1%) | <0.001 | |
| No | 2162 (98.3%) | 2198 (99.9%) | |||
| Heart disease | Yes | 11 (0.5%) | 1 (0.0004%) | 0.004 | |
| No | 2189 (99.5%) | 2199 (100%) | |||
Results
Predictors of hypertension
BMI, waist circumference, and waist-hip ratio were significantly higher in hypertensive than normotensive participants. The Chi-square test revealed significantly (P<0.05) higher values for the number of variables among the hypertensive participants (Table I). The variables having statistically insignificant associations were excluded from fitting the models.
Average accuracy scores
For 100 random test samples, the model accuracy scores along with the AUC values were recorded, and their average value, as well as 95 per cent confidence interval, was determined (Table III). The Adaptive Boosting Classifier performed the best with a maximum average accuracy score of 87.02 per cent (CI: 86.01-88.03) followed by XG- boosting (86.83%) and RFC (86.08%). The performance of the other models was significantly lower than these three models in terms of their average accuracy score. However, the maximum average AUC score of 98.37 per cent (CI: 97.36-99.38) was obtained under RFC followed by XG boost (96.43%) and AdaBoost classifier (94.05%).
| Classifiers | Average accuracy scores (%) | 95% confidence intervals | Average AUC (%) | 95% confidence intervals |
|---|---|---|---|---|
| Decision tree classifier | 81.69 | 80.49-82.89 | 94.02 | 93.01-95.03 |
| Random forest classifier | 86.08 | 85.03-87.13 | 98.37 | 97.36-99.38 |
| Support vector machine | 84.13 | 83.03-85.23 | 90.65 | 89.25-92.05 |
| Linear discriminant analysis | 82.52 | 81.47-83.57 | 90.22 | 89.17-91.27 |
| Logistic regression | 83.47 | 82.17-84.77 | 90.47 | 89.43-91.51 |
| XGBoost classifier | 86.83 | 85.81-87.85 | 96.43 | 95.45-97.41 |
| AdaBoost classifier | 87.02 | 86.01-88.03 | 94.05% | 93.06-95.04 |
For a specific randomly selected test sample, the performances of the models were visualised in the confusion matrices (Supplementary Fig. 1). In confusion matrices, generated for a particular randomly selected test sample of size 8,821, it was found that the total number of false positive and negative cases was lowest (1,128) in the case of the AdaBoost classifier followed by XG-boost (1,148) and RFC (1,224). The class prediction errors were visualised diagrammatically (Supplementary Fig. 2). In the case of RFC, XG boost classifier, and Ada-boost classifier, the class prediction error was comparatively lesser than the other models. For this random test sample, the lowest number of false positive cases were observed in case of Ada-boost classifier, while the lowest number of false negative cases were observed in case of XG boost classifier.
ROC curve (receiver operating characteristic curve)
For this test sample, the ROC curve was drawn for each of the models (Supplementary Fig. 3). Here, the Ada-boost classifier had the maximum AUC of 0.9351 followed by the XG-boost classifier and RFC with AUC of 0.8344 and 0.9206 respectively. However, this AUC score was based on a particular test sample. For better comparison, average AUC scores were calculated for 100 randomly selected test samples for each of the models (Table III). It was observed that the maximum average AUC of 0.9837 was observed in the case of RFC, followed by the XG boost classifier and Ada-boost classifier.
The precision and recall value, along with the F-1 are shown in figure 2 for each of the models. It is clear from the figure that the precision and recall values for the Ada-boost classifier and RFC were significantly higher compared to those in the other models.
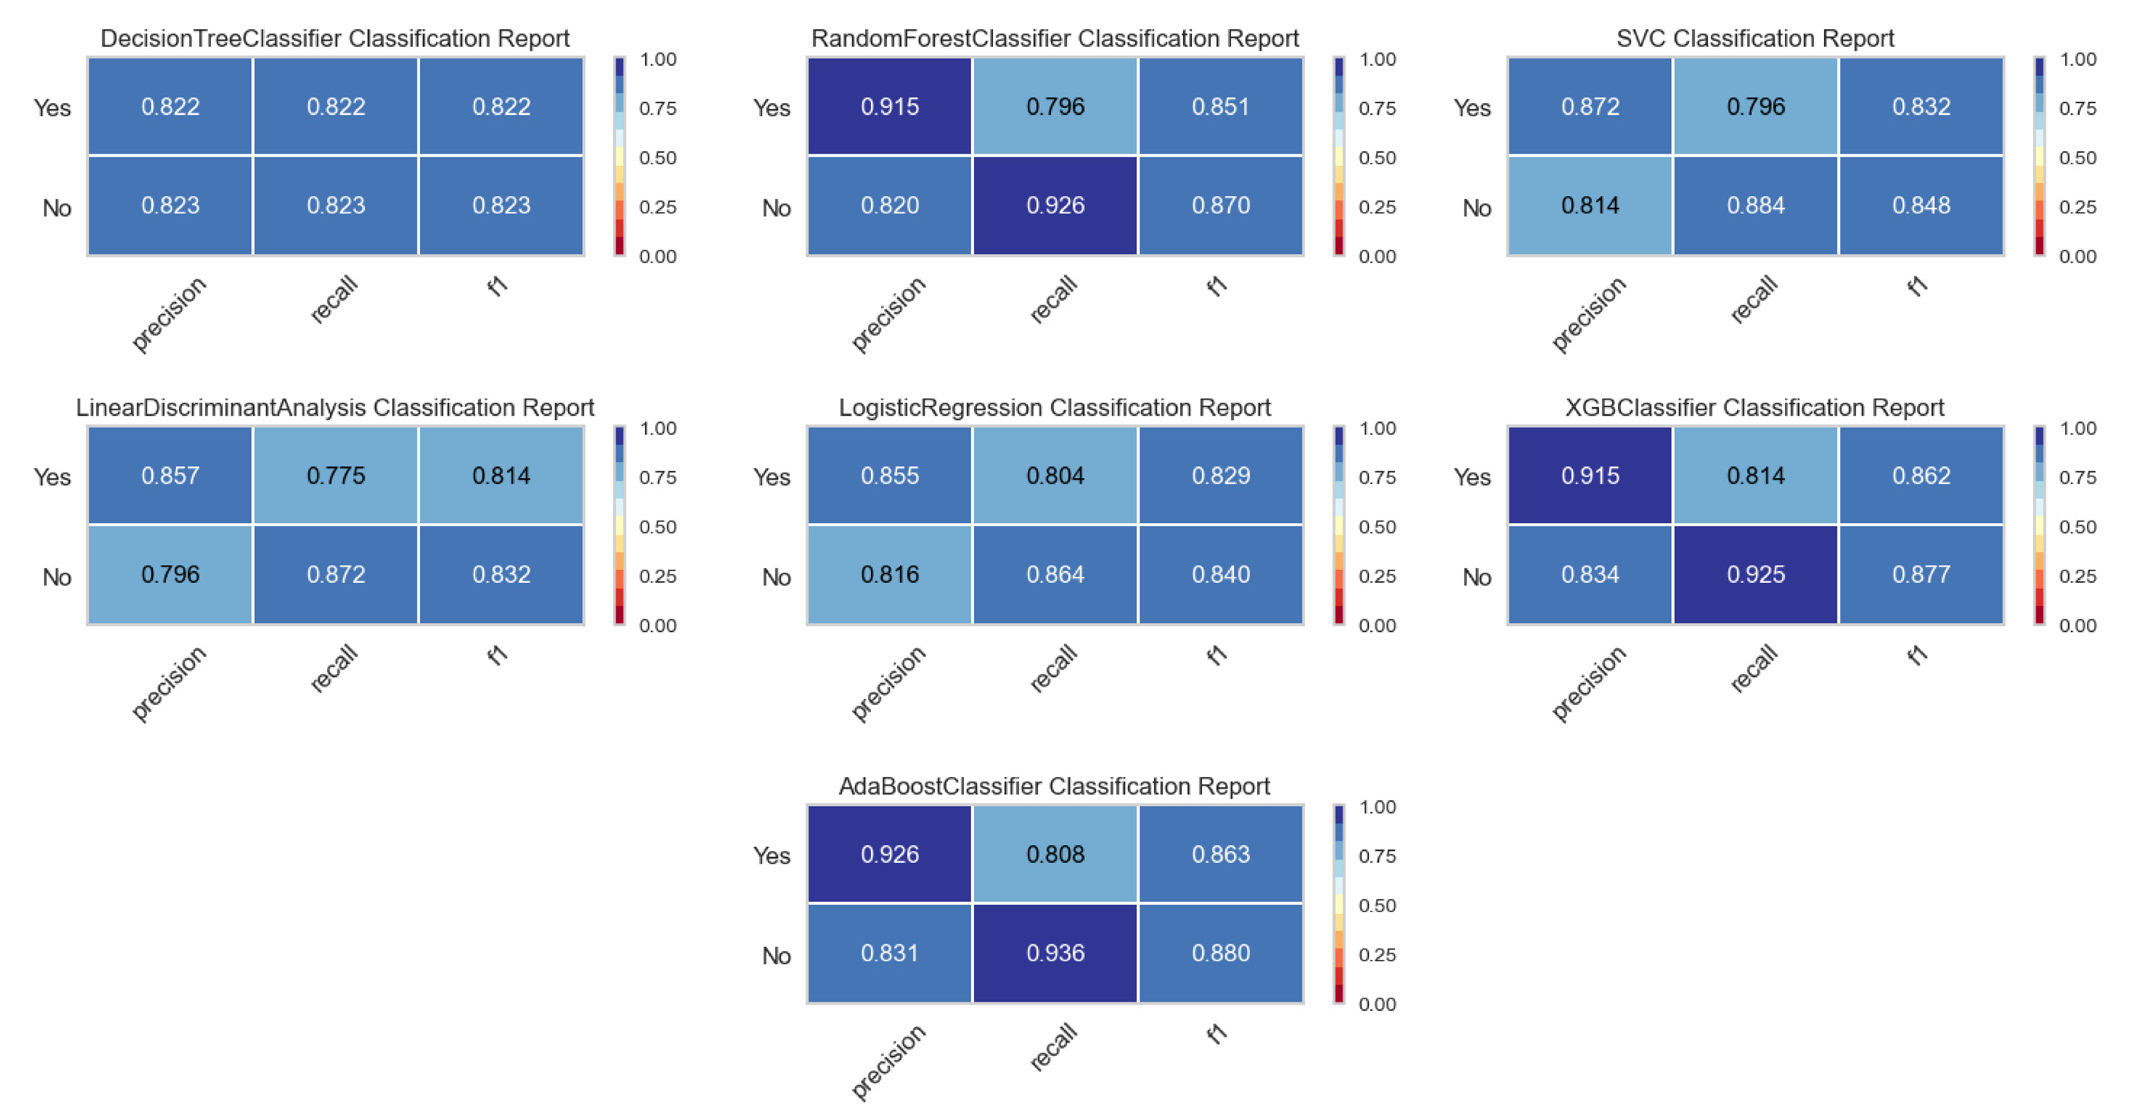
- Classification report for all the fitted models.
Relative importance of the features under consideration
Features used in developing the models, relative importances were determined using random forest (visualised diagrammatically in Supplementary Fig. 4). It reveals that the waist circumference of the participants had the maximum relative importance in the identification of hypertension followed by BMI, age group, and the waist-hip ratio. The other features were showing very low relative importance compared to the above three.
Prediction of risk of hypertension after two years
All the normotensive participants were followed for two years, and 1,437 were found to be hypertensive. Using the over-sampling and under-sampling technique, the dataset was balanced and 4,400 cases were used for the training and evaluation of the models for predicting hypertension after two years. Of the 22 relevant features considered initially, we included 19 statistically significant features for developing the models to predict hypertension after two years (Table II).
Average accuracy score
For 100 randomly selected test samples, the model’s predictability in finding risk of hypertension after two years was assessed using average accuracy score and average AUC score. Table IV reveals that the XG Boost classifier performed the best with a maximum average accuracy score of 77.57 per cent (CI: 76.45-78.11) and a maximum average AUC score of 0.8508. The performance of RFC and DTC was also good than the other models. The average accuracy score of RFC and DTC was 77.2 and 75.6 per cent, respectively. It is observed that both XG-boost classifier and RFC were performing consistently better than DTC, SVM, LDA and LR in both identification as well as prediction of hypertension after two years.
| Classifiers | Average accuracy scores (%) | 95% confidence intervals | Average AUC (%) | 95% confidence intervals |
|---|---|---|---|---|
| Decision tree classifier | 75.6 | 74.39-76.81 | 74.88 | 73.75-76.01 |
| Random forest classifier | 77.2 | 76.15-78.25 | 85.82 | 84.88-86.76 |
| Support vector machine | 69.55 | 68.02-71.08 | 68.8 | 67.48-70.12 |
| Linear discriminant analysis | 69.55 | 68.13-70.97 | 76.11 | 75.03-77.19 |
| Logistic regression | 69.92 | 68.84-71 | 75.17 | 74.11-76.23 |
| XGBoost classifier | 77.57 | 76.60-78.54 | 85.08 | 84.14-86.02 |
| AdaBoost classifier | 70.22 | 69.14-71.3 | 76.89 | 75.93-77.85 |
For a specific randomly selected test sample of size 1,320 (consisting of 659 hypertensive participants and 661 normotensive participants), the confusion matrices for all seven classification algorithms are shown in figure 3. In the prediction of hypertension after two years, the XG-boost classifier showed the lowest number of false positive and negative cases (287) followed by RFC (301). The class prediction error for the specific test sample are shown diagrammatically in supplementary figure 5.
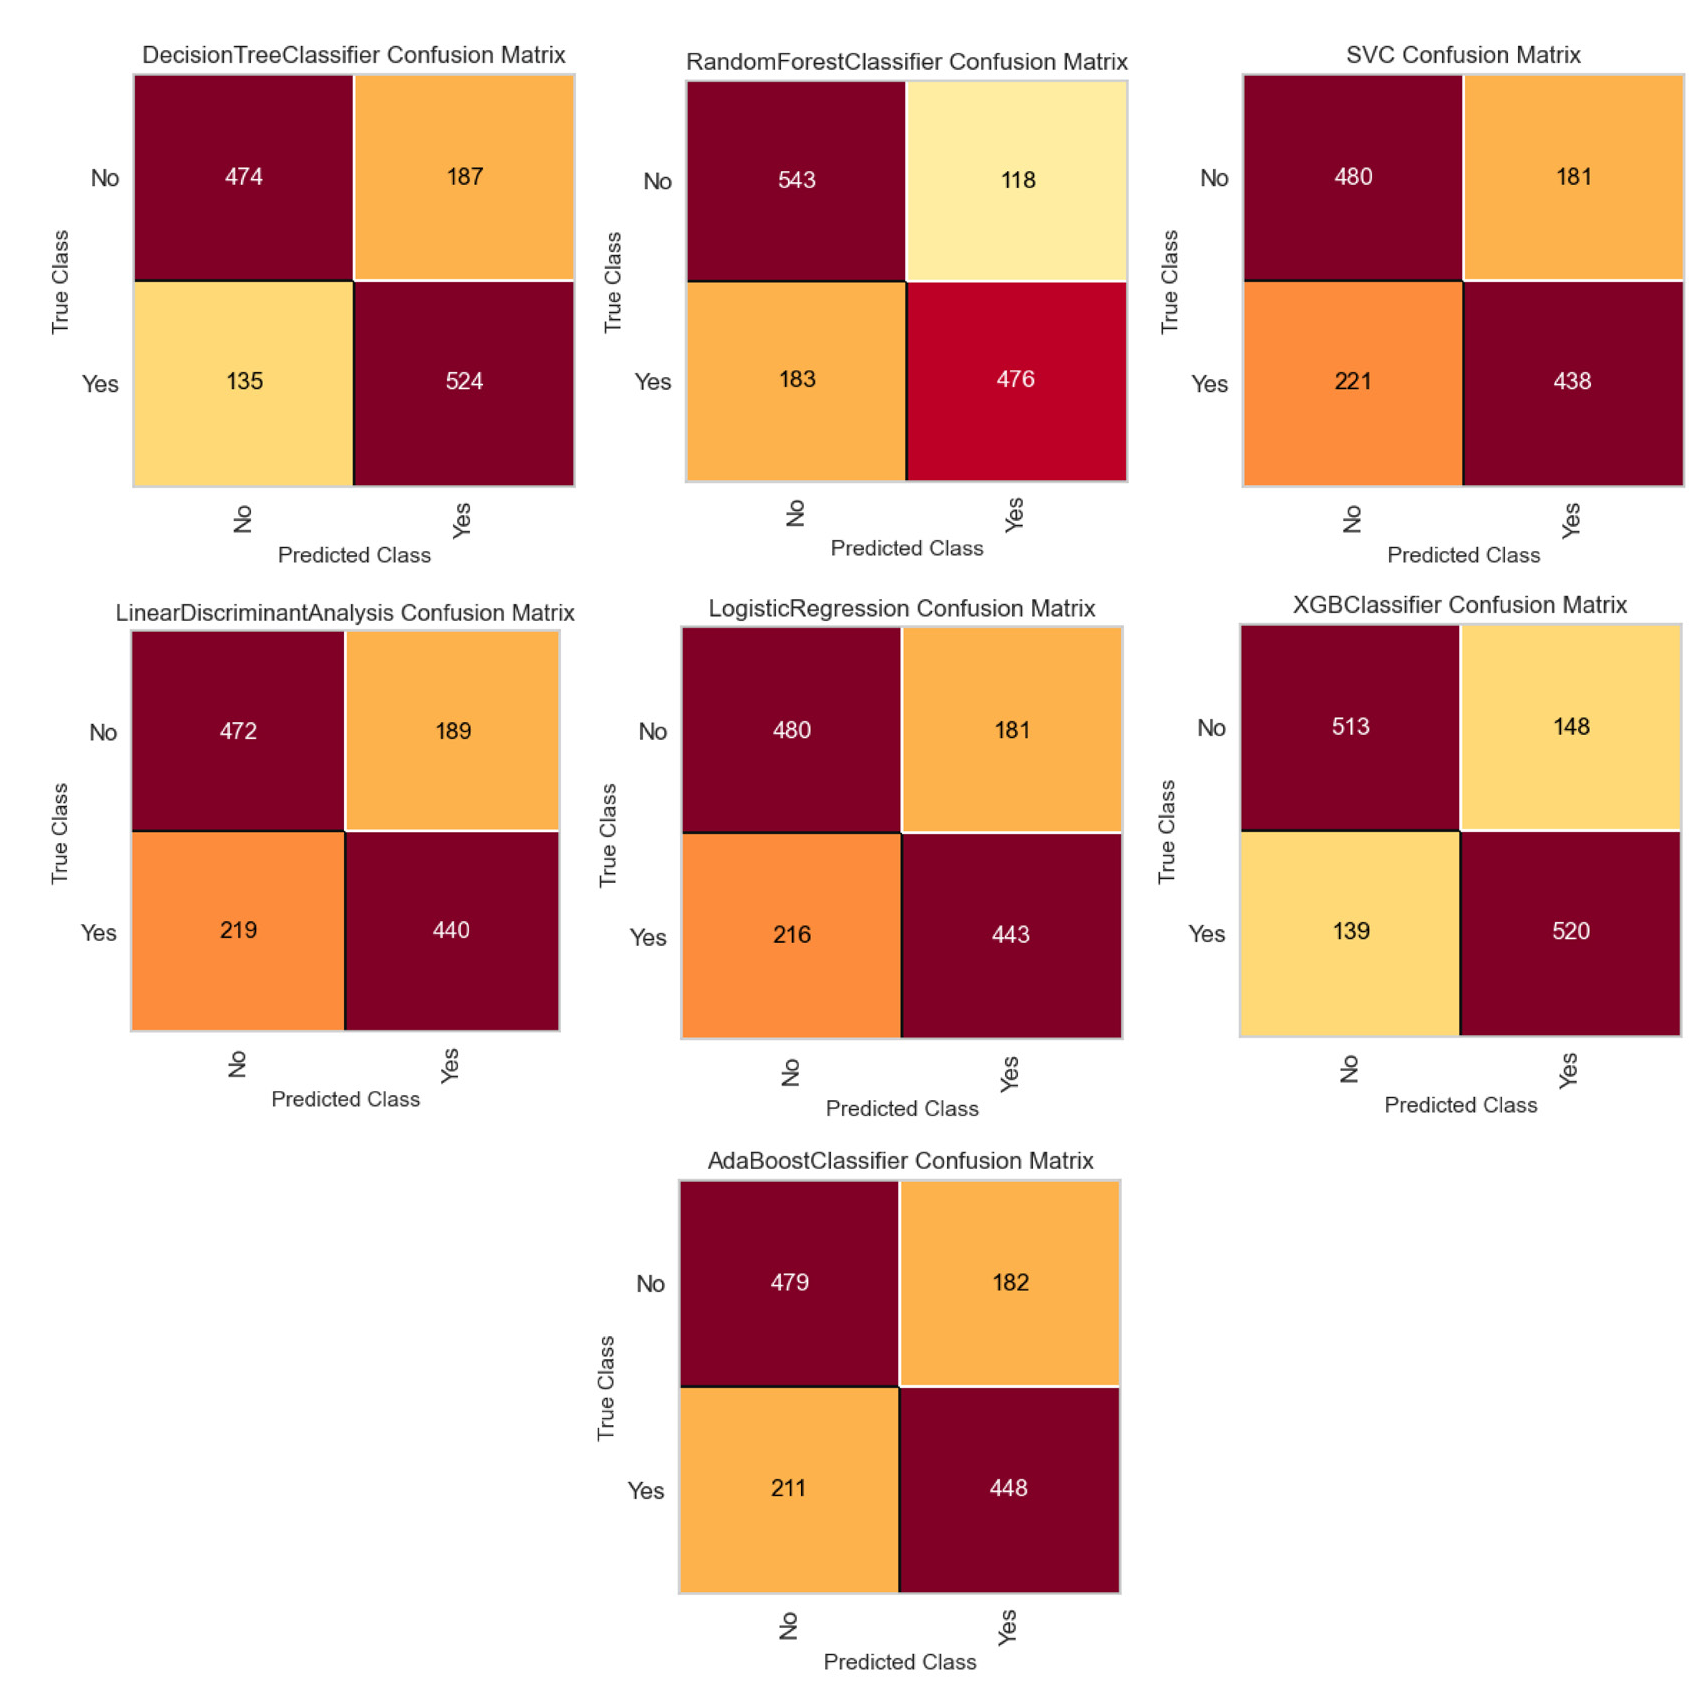
- Confusion matrices of each of the trained models for a specific randomly selected test sample of size 1,320 (consisting 659 hypertensive participants and 661 normotensive participants).
ROC curves, precision and recall
ROC curves for each of the models are shown in supplementary figure 6, where a maximum AUC of 0.8508 was observed under the XG boost classifier and lowest AUC of 0.6880 was observed under SVM. The precision, recall, and F-1 score for the models are shown in the classification report of the models in figure 4.
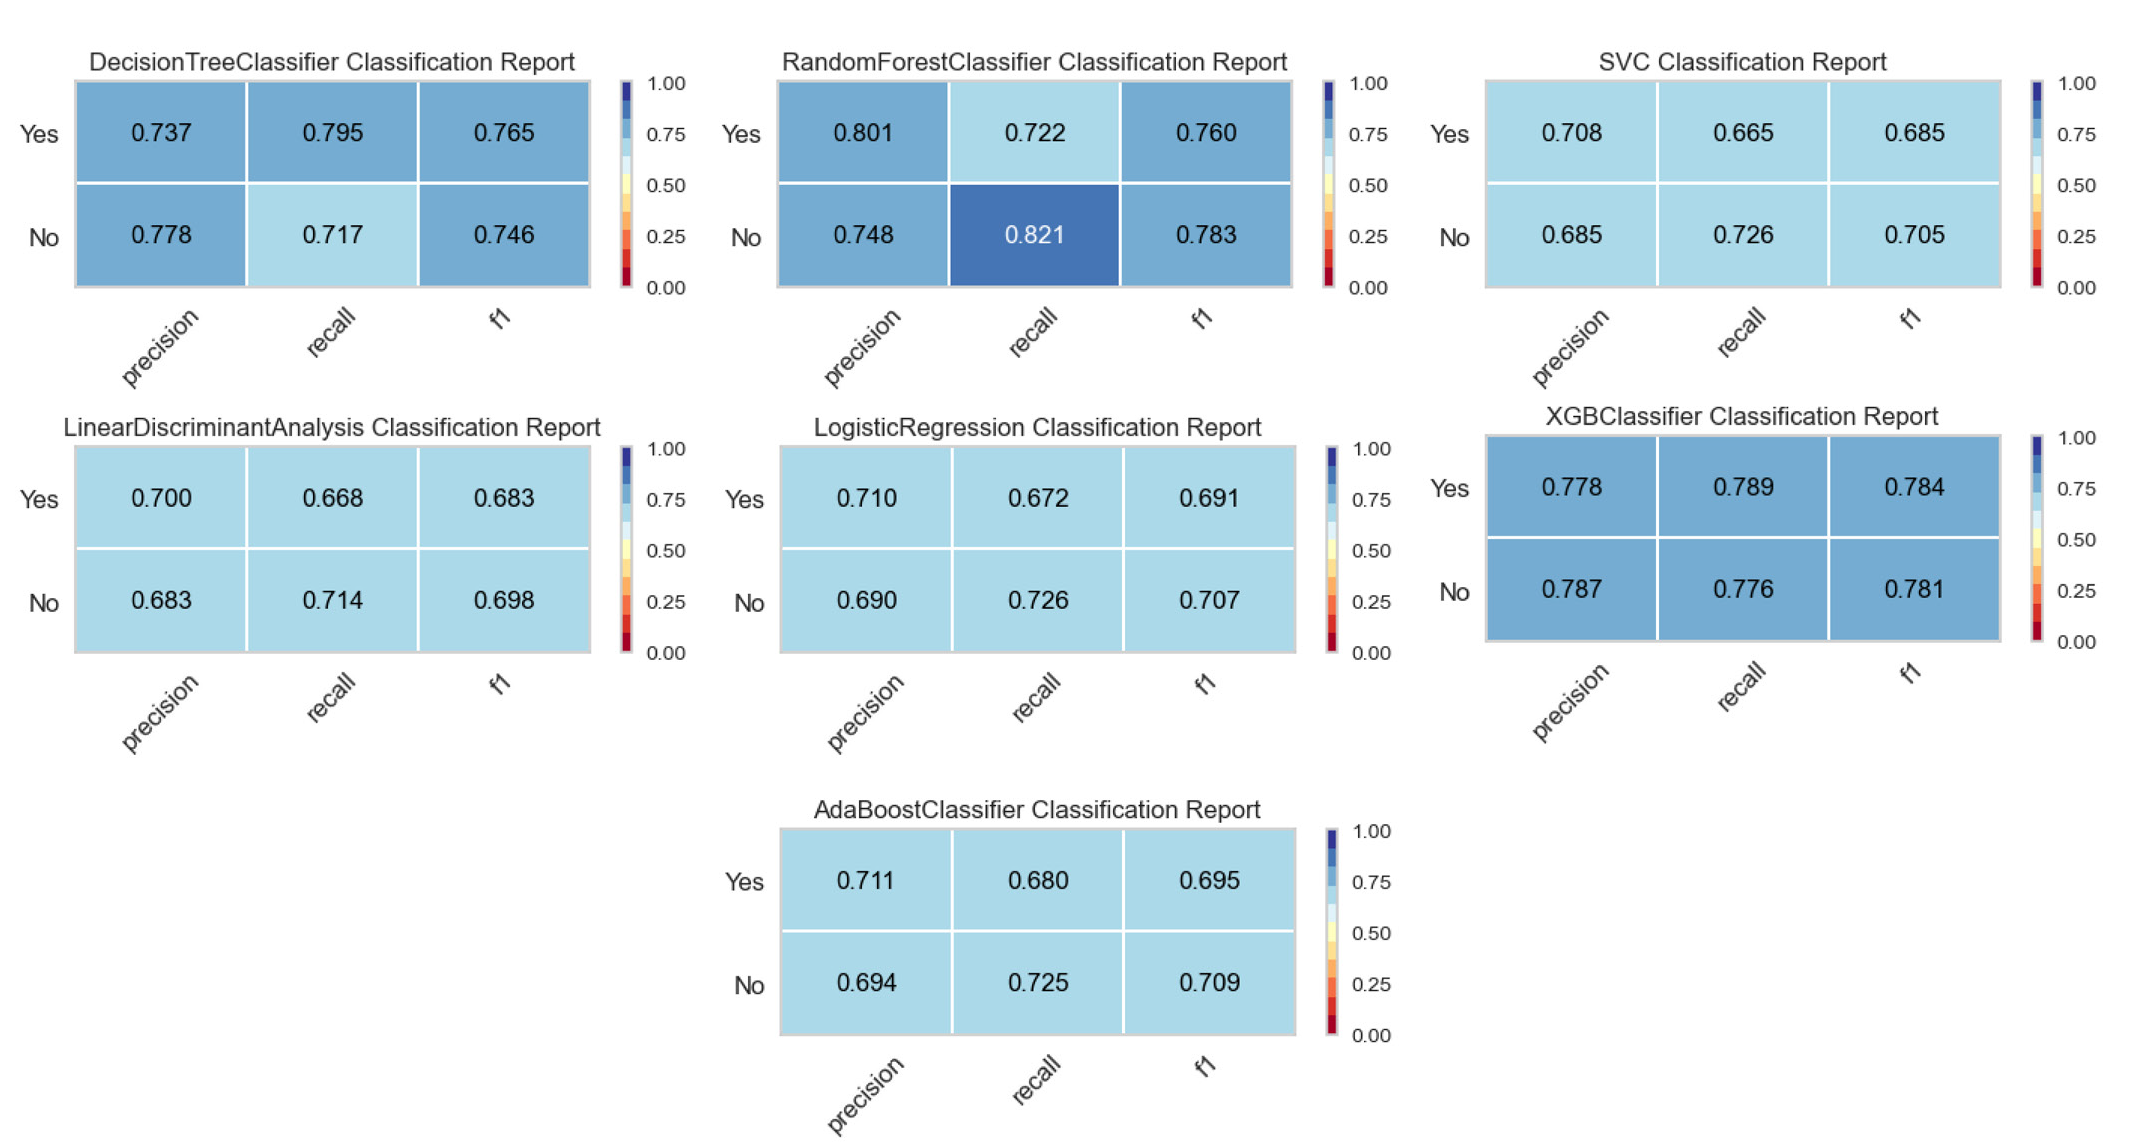
- Classification reports of the fitted models in two-year risk prediction.
Relative importance of the features
The relative importance of all the 19 statistically significant features was determined using RFC, (results visualised diacritically in Supplementary Fig. 7). It reveals that the systolic blood pressure showed the maximum relative importance followed by BMI, waist circumference, diastolic blood pressure, and age group, etc. On the other hand, smoking, religion, and diabetes showed the lowest contribution in predicting hypertension after two years.
Discussion
Predictive modelling techniques play a crucial role in disease prediction and risk estimation, treatment outcome prediction, disease type detection, public health surveillance, and epidemic forecasting. For the prediction of hypertension, a number of studies have been conducted; however, the choice of features, classification models, number of participants, etc. varies between studies. To predict the risk of hypertension for the next five years, Fang et al17 conducted a study in China where a model merging the K-Nearest Neighbor and Light Gradient Boosting Machine was used on 23 clinical features of the participants17. They achieved 86 per cent of accuracy and 92 per cent recall rate. Ren et al18 conducted a study to predict hypertension using a logistic regression model in Central China, which also provided risk factors of hypertension18. The model based on nine optimal features was identified using Logistic regression and achieved 75.81 per cent of AUC value in the test set. Similarly, physiological measures such as pulse waves have been used for predicting hypertension using the Ada-boost, Gradient Boosting, SVM, and random forest (RF) models19. For the prediction of essential hypertension, Naive Bayes (NB) classifiers, SVM, logistic regression models, random forest (RF), and multilayer perceptron (MLP) were used, where the SVM model exhibited higher accuracy, with an AUC of 0.8977 and an accuracy of 80.23 per cent20. Similarly, Fitriyani et al21 developed a disease prediction model to provide early detection of type 2 diabetes and hypertension using individual risk factor data. The suggested disease prediction model included an isolation forest (iForest)-based outlier detection method for removing outlier data, a synthetic minority oversampling technique Tomek link (SMOTETomek) for balancing data distribution, and an ensemble approach for disease prediction. The results revealed that the disease prediction model outperformed other models in terms of accuracy21. Five ML algorithms viz RFC trees, a random forest of regression trees, lasso penalised LR, boosted classification trees SVM were used by Leha et al22 to predict pulmonary hypertension. They achieve a maximum of 83 per cent (CI: 0.73-0.93) accuracy score under SVM.
In the present study, RFC was found to perform consistently better than the others (in terms of average accuracy score). However, the performance of the Ada-boost classifier and XG-boost classifiers were also found to be equally good. Among all the predictors, waist circumference was found to have maximum contribution in the identification of hypertension. An elevated waist circumference, a sign of abdominal obesity, is highly correlated with an increased risk of hypertension. BMI was the second important feature which was strongly associated with an increased risk of developing hypertension. Multiple studies have confirmed the association between a higher BMI and an increased risk of developing hypertension. Studies conducted on a sizable population from South Asian countries demonstrated that those with higher BMIs were at higher risk of developing hypertension23. According to a Korean study24, BMI is still a substantial and useful indicator for hypertension even though other anthropometric measurements, such as the waist-to-height ratio (WHtR), could be more predictive in some situations. The third important predictor was found to be age. Kokiwar et al25 found that the incidence of hypertension increased with age, with significant increases observed in middle-aged and older adults. Our results showed that the waist-hip ratio was the fourth important predictor in the identification of hypertension. To predict the risk of hypertension, systolic blood pressure (SBP) and diastolic blood pressure (DBP) measured during baseline survey were also included. Since SBP and DBP were directly related to hypertension, SBP measured in the baseline survey was found to have maximum importance. Excluding SBP and DBP in both identification and two-year risk prediction, BMI, waist circumference, and age group were found to have maximum contribution towards development of hypertension.
Despite achieving satisfactory performance of the models, our study had some limitations. All the base line participants could not be followed up after two years due to the COVID-19 pandemic. Particularly in the case of two-year risk prediction, comparatively fewer instances were discovered to have hypertension after two years following the removal of baseline hypertensive participants. Also, after using the proper data balancing technique final data set became small, which might have resulted in the reduction of the accuracy of the models.
In conclusion, the present study demonstrated the effectiveness of data-driven approaches in early risk assessment and preventive healthcare. The findings revealed the potential of predictive models in accurately identifying high-risk individuals, enabling timely interventions, and optimising clinical decision-making.
Acknowledgment
Authors acknowledge the participants and the field staffs for their enthusiastic participation in the collection process. This investigation could not be carried out without their support.
Financial support & sponsorship
This study received funding from Indian Council of Medical Research, New Delhi, India (No. 5/7/1596/2018-RBMH&CH).
Conflicts of Interest
None.
Use of Artificial Intelligence (AI)-Assisted Technology for manuscript preparation
The authors confirm that there was no use of AI-assisted technology for assisting in the writing of the manuscript and no images were manipulated using AI.
References
- Risk assessment of hypertension in steel workers based on LVQ and fisher-SVM deep excavation. IEEE Access. 2019;7:23109-1.
- [CrossRef] [Google Scholar]
- Predicting the risk of hypertension based on several easy-to-collect risk factors: A machine learning method. Frontiers in Public Health. 2021;9:619429.
- [CrossRef] [PubMed] [PubMed Central] [Google Scholar]
- An evaluation of the impact of aggressive hypertension, diabetes and smoking cessation management on CVD outcomes at the population level: A dynamic simulation analysis. BMC Public Health. 2019;19:1105.
- [CrossRef] [PubMed] [PubMed Central] [Google Scholar]
- Machine learning and electronic health records: A paradigm shift. Am J Psychiatry. 2017;174:93-4.
- [CrossRef] [PubMed] [Google Scholar]
- Predicting increased blood pressure using machine learning. J Obes. 2014;2014:637635.
- [CrossRef] [PubMed] [PubMed Central] [Google Scholar]
- A hybrid model based on modular neural networks and fuzzy systems for classification of blood pressure and hypertension risk diagnosis. Expert Systems with Applications. 2018;107:146-64.
- [CrossRef] [Google Scholar]
- Cohort profile of the largest health & demographic surveillance system (Dibrugarh-HDSS) from North-East India. Indian J Med Res. 2022;156:579-87.
- [CrossRef] [PubMed] [PubMed Central] [Google Scholar]
- What’s new in the ESC 2018 guidelines for arterial hypertension. Wien Klin Wochenschr. 2019;131:180-5.
- [CrossRef] [PubMed] [PubMed Central] [Google Scholar]
- Machine learning models and data-balancing techniques for credit scoring: What is the best combination? Risks. 2022;10:169.
- [CrossRef] [Google Scholar]
- Study and analysis of decision tree-based classification algorithms. International Journal of Computer Sciences and Engineering. 2018;6:74-8.
- [Google Scholar]
- A computational approach for identifying assamese folk music instruments. Songklanakarin J Sci Tech. 2023;45:399-406.
- [Google Scholar]
- Applied multivariate statistical analysis (6th ed). India: Person India Education Services; 2015.
- The nature of statistical learning theory. Springer science & business media; 1999.
- An introduction to statistical learning: with applications in R. Spinger; 2013.
- Explaining the success of adaboost and random forests as interpolating classifiers. Journal of Machine Learning Research. 2017;18:1-33.
- [Google Scholar]
- Exploring the power of eXtreme gradient boosting algorithm with machine learning: A review. Academic Journal of Nawroz University.. 2023;12:320-34.
- [Google Scholar]
- A hybrid machine learning approach for hypertension risk prediction. Neural Comput & Applic. 2023;35:14487-9.
- [CrossRef] [PubMed] [Google Scholar]
- A novel predicted model for hypertension based on a large cross-sectional study. Sci Rep. 2020;10:10615.
- [CrossRef] [PubMed] [PubMed Central] [Google Scholar]
- A Study of machine‐learning classifiers for hypertension based on radial pulse wave. Bio Med Res Inter. 2018;2018:2964816.
- [Google Scholar]
- Predicting the occurrence of essential hypertension using annual health records. In: Second International Conference on Advances in Electronics, Computers and Communications (ICAECC), 2018. Bangalore, India: IEEE; 2018. p. :1-5.
- [Google Scholar]
- Development of disease prediction model based on ensemble learning approach for diabetes and hypertension. IEEE Access. 2019;7:144777-89.
- [CrossRef] [Google Scholar]
- A machine learning approach for the prediction of pulmonary hypertension. PLoS One. 2019;14:e0224453.
- [CrossRef] [PubMed] [PubMed Central] [Google Scholar]
- Association between body mass index (BMI) and hypertension in south asian population: Evidence from nationally-representative surveys. Clin Hypertens. 2019;25:28.
- [CrossRef] [PubMed] [PubMed Central] [Google Scholar]
- Waist-to-height ratio index for predicting incidences of hypertension: The ARIRANG study. BMC Public Health. 2018;18:767.
- [CrossRef] [PubMed] [PubMed Central] [Google Scholar]
- Prevalence of hypertension in a rural community of central India. J Assoc Physicians India. 2012;60:26-9.
- [PubMed] [Google Scholar]


