
Translate this page into:
A clinicoepidemiological profile of lung cancers in India – Results from the National Cancer Registry Programme
For correspondence: Dr Prashant Mathur, ICMR-National Centre for Disease Informatics & Research, Nirmal Bhawan, ICMR Complex, Poojanhalli Road, Off NH-7, Adjacent to Trumpet Flyover of Bial, Bengaluru 562 110, Karnataka, India e-mail: director-ncdir@icmr.gov.in
-
Received: ,
This article was originally published by Wolters Kluwer - Medknow and was migrated to Scientific Scholar after the change of Publisher.
Abstract
Background & objectives:
Lung cancer is a significant public health concern in low- and middle-income countries such as India. The present article describes the epidemiology, and clinical profile of lung cancer in India, based on recent data from the National Cancer Registry Programme (NCRP).
Methods:
The latest data on lung cancer from the NCRP were collated from 28 population-based cancer registries and 58 hospital-based cancer registries across a five-year (2012-2016) reporting period.
Results:
The highest age-adjusted incidence rate and mortality (AAMR) was found amongst males and females in the Aizawl district of Mizoram. A significant increase in the annual per cent change of lung cancer incidence was observed in metropolitan cities from 1982 to 2016. About one-third of the cases (36.5%) in males and females (31.7%) were recorded in the age group of 55-64 yr. Adenocarcinoma accounted for about a third (34.3%) of the morphological type in males and half (52.7% ) amongst females. Out of 22,645 recorded lung cancer cases, close to half (44.8%) of the patients presented with distant spread, while over one-third (35.3%) had loco-regional spread of disease at the time of diagnosis.
Interpretation & conclusions:
Our estimates suggest that the number of cases is expected to rise sharply to 81,219 cases amongst males and 30,109 in females in 2025. The rising incidence and delayed diagnosis of lung cancer in India are grave concerns. The findings of the present study call for scaling up and intensification of lung cancer-specific preventive, early diagnosis and control measures.
Keywords
Incidence
India
lung cancer
morphology
registry

Lung cancer is the most frequently reported cancer globally, accounting for an estimated 2.2 million new cases and 1.8 million deaths in 20201. Of the new cancer cases in 2020, lung cancer contributed to 11.4 per cent and 18 per cent of the cancer-related deaths1. The highest lung cancer rate has been reported amongst males in Turkey and females in Hungary2. In the Southeast Asia Region, lung cancer accounted for eight per cent of the new cases in 20183. Lung cancer rates have remained stable over time in Finland, Norway, France and Spain4. Once diagnosed, the prognosis tends to be generally poor. Developing countries report a mean five-year survival of 15 per cent, which is three times lower than those reported from developed countries5. Inequalities in socioeconomic status and access to healthcare contribute to the differences in lung cancer burden and mortality across the countries. The survival outcomes continue to be dismal, despite the several recent advances in diagnostic methods and treatment modalities.
The National Cancer Registry Programme (NCRP) of the Indian Council of Medical Research (ICMR) is implemented by the National Centre for Disease Informatics and Research (NCDIR), Bengaluru. The NCRP plays a vital role in cancer surveillance by collecting and compiling data on cancer occurrence, patterns, outcome and projections. An earlier report from the NCRP estimated a significant increase in the age-adjusted incidence rate (AAR) of lung cancer in both the genders since the early 1980s6. Understanding the epidemiologic and clinical profile of lung cancer is of utmost importance to gauge the impact of prevention and treatment programmes. It also enables in identifying gaps in cancer care services, planning and strengthening preventive actions and service provision. This article aims to present a descriptive epidemiology and clinical profile of lung cancer in India, based on the recent NCRP findings7.
Material & Methods
The latest data from the NCRP have been collated from 28 population-based cancer registries (PBCRs) and 58 hospital-based cancer registries (HBCRs) and cover a five-year (2012-2016) reporting period. The 28 PBCRs have been grouped region wise as north, north east region (NER), east, central, west and south. The PBCRs obtain data on new cancer cases from various sources of registration such as hospitals, clinics, diagnostic centres and vital registration sources in a well-demarcated geographic area amongst persons who have been residing there for at least one year before diagnosis. The data generated from a PBCR provide vital information on the cancer incidence and changes in occurrence patterns over the time. An HBCR is based at a specific hospital and compiles data on cancer patients who avail care at different hospital departments. They furnish necessary information on the clinical presentation, treatment modalities and disease outcomes such as survivorship and mortality. The NCRP registers cancers with a behaviour code of 3 according to the definition of the International Classification of Diseases for Oncology8.
The epidemiology of lung cancer is described in terms of the median age at presentation crude incidence rate (CR), AAR and age-adjusted mortality rate (AAMR) per 100,000 population using world standard population for all the 28 PBCRs9. The AAR trends were estimated from 1982 to 2016 for six PBCRs: Delhi, bengaluru, Mumbai, Chennai, Barshi and Bhopal: which had consistent data over time. However, Barshi rural reported fewer cases (<10) among both genders, while Bhopal reported less than ten cases in females and was excluded. Annual per cent change (APC) was calculated using Joinpoint trend analysis software by the National Cancer Institute for the said periods10. Other indices include cumulative risk, which is the likelihood of developing cancer of any anatomical site in the age group of 0-74 yr, in the absence of any other cause of death. The ranking of lung cancer amongst leading anatomical sites and the proportion of one relative to the other frequently reported cancer sites are enumerated for each PBCR site. The clinical profile is explained according to the age distribution, morphologic type (IC0-0-3 classification), broad method of diagnosis and the clinical extent of the disease. The clinical extent of disease includes localized (confined to the primary site), loco-regional (with spread to regional lymph nodes) and distant metastasis (spread to different parts of the body).
The projected number of lung cancer cases has been estimated using age-specific incidence rate (ASpR) data of 28 PBCRs from 2012-2016. At first, the State or Union Territory-wise population was estimated for 2025 using census growth rate (2001-2011) by different distribution methods for estimating five-year age group population, followed by region-wise collation/representation of PBCR data for projecting the incident number of cancer cases in India. The ASpR, according to the anatomical sites and gender, was applied to the estimated population of a corresponding region to arrive at the ASpR and projected number of lung cancer cases for the year 202511.
Results
Incidence and cumulative risk of lung cancer: The highest crude incidence rate among males (27.1/100,000) was reported in Aizawl district, followed by Mizoram State (20.9/100,000), as shown in Table I. Similarly, crude incidence rate among females was highest in Aizawl district (27.9/100,000) followed by Mizoram State (18.0/100,000). The AAR and cumulative risk in both genders displayed a similar geographical trend, with the highest rates from Aizawl followed by Mizoram (Table I). Outside the NER, AAR in males was reportedly high in Kollam district (23.1/100,000), Kolkata (18.3/100,000) and Thiruvanthapuram (16.8/100,000). The lowest AAR rates were observed among males in Barshi rural (1.8/100,000) and females in Osmanabad and Beed (1.0/100,000). The cumulative risk of developing cancer was the highest in Aizawl, with every one in 22 males and one in 23 females in the 0-74 yr age group, at risk of developing cancer in any given anatomical site.
| PBCR | Male | Female | ||||||||||
|---|---|---|---|---|---|---|---|---|---|---|---|---|
| Incidence | Mortality AAMR |
Incidence | Mortality AAMR |
|||||||||
| n (%) | CR | AAR | Cumulative risk | Median age | n (%) | CR | AAR | Cumulative risk | Median age | |||
| North | ||||||||||||
| Delhi | 1083 (10.5) | 11.8 | 16.7 | 1 in 47 | 61 | 3.3 | 321 (3.3) | 4.0 | 5.1 | 1 in 161 | 60 | 1.0 |
| Patiala district | 75 (6.9) | 7.0 | 7.7 | 1 in 101 | 60 | 1.2 | 27 (2.2) | 2.8 | 2.8 | 1 in 304 | 58 | 0.6 |
| South | ||||||||||||
| Hyderabad district | 187 (10.9) | 9.2 | 12.4 | 1 in 59 | 63 | 2.4 | 87 (4.1) | 4.5 | 6.0 | 1 in 127 | 60 | 1.1 |
| Kollam district | 367 (18.5) | 29.4 | 23.1 | 1 in 33 | 65 | 15.9 | 72 (3.7) | 5.1 | 3.8 | 1 in 214 | 63 | 2.4 |
| Thiruvanathapuram district | 337 (12.5) | 21.3 | 16.8 | 1 in 47 | 63 | 8.9 | 109 (3.8) | 6.3 | 4.7 | 1 in 175 | 62 | 2.0 |
| Bengaluru | 445 (10.1) | 9.8 | 13.0 | 1 in 59 | 64 | 5.5 | 199 (3.8) | 4.7 | 5.8 | 1 in 143 | 60 | 2.3 |
| Chennai | 279 (9.7) | 11.8 | 11.9 | 1 in 66 | 63 | 4.9 | 111 (3.3) | 4.7 | 4.4 | 1 in 182 | 61 | 1.7 |
| East | ||||||||||||
| Kolkata | 510 (20.0) | 22.0 | 18.3 | 1 in 42 | 65 | 9.7 | 151 (6.6) | 7.0 | 5.9 | 1 in 142 | 62 | 2.9 |
| West | ||||||||||||
| Ahmedabad urban | 238 (8.1) | 7.3 | 8.8 | 1 in 86 | 62 | 3.2 | 62 (2.8) | 2.1 | 2.4 | 1 in 332 | 60 | 0.8 |
| Aurangabad | 43 (11.2) | 6.4 | 8.8 | 1 in 83 | 60 | 3.1 | 16 (3.9) | 2.5 | 3.2 | 1 in 243 | 60 | 1.0 |
| Osmanabad and Beed | 44 (4.9) | 1.9 | 1.9 | 1 in 421 | 65 | 0.8 | 23 (2.1) | 1.1 | 1.0 | 1 in 848 | 59 | 0.4 |
| Barshi rural | 5 (3.4) | 1.9 | 1.8 | 1 in 448 | 60 | 1.3 | 5 (3.2) | 2.1 | 1.9 | 1 in 458 | 58 | 1.5 |
| Mumbai | 639 (9.7) | 9.5 | 11.0 | 1 in 73 | 65 | 9.2 | 348 (5.1) | 6.0 | 5.9 | 1 in 143 | 65 | 4.8 |
| Pune | 147 (7.6) | 5.1 | 6.7 | 1 in 113 | 65 | 3.8 | 90 (4.2) | 3.5 | 4.0 | 1 in 204 | 61 | 2.4 |
| Central | ||||||||||||
| Wardha district | 34 (7.1) | 5.0 | 4.6 | 1 in 179 | 62 | 3.6 | 17 (3.4) | 2.6 | 2.3 | 1 in 147 | 59 | 1.8 |
| Bhopal | 98 (10.9) | 9.1 | 12.0 | 1 in 64 | 62 | 7.4 | 29 (3.2) | 2.9 | 3.6 | 1 in 220 | 58 | 2.2 |
| Nagpur | 74 (6.2) | 5.5 | 6.1 | 1 in 121 | 62 | 1.5 | 35 (2.9) | 2.7 | 2.7 | 1 in 299 | 55 | 0.5 |
| North East | ||||||||||||
| Manipur State | 140 (18.9) | 8.9 | 12.9 | 1 in 58 | 68 | 6.1 | 130 (14.4) | 8.3 | 11.8 | 1 in 63 | 65 | 5.2 |
| Imphal West district | 41 (18.2) | 15.5 | 17.8 | 1 in 46 | 70 | 7.7 | 43 (14.3) | 15.5 | 16.6 | 1 in 49 | 66 | 6.9 |
| Mizoram State | 124 (14.3) | 20.9 | 32.1 | 1 in 26 | 66 | 23.1 | 106 (14.1) | 18.0 | 27.6 | 1 in 29 | 67 | 17.2 |
| Aizawl district | 57 (13.2) | 27.1 | 38.8 | 1 in 22 | 66 | 27.9 | 61 (16.0) | 27.9 | 37.9 | 1 in 23 | 70 | 24.3 |
| Sikkim State | 17 (7.1) | 4.9 | 6.5 | 1 in 127 | 69 | 5.2 | 15 (6.5) | 4.9 | 7.1 | 1 in 118 | 66 | 5.7 |
| Tripura State | 221 (16.8) | 11.3 | 14.5 | 1 in 54 | 63 | 10.4 | 53 (5.4) | 2.8 | 3.4 | 1 in 226 | 60 | 2.3 |
| West Arunachal | 16 (6.5) | 3.7 | 7.0 | 1 in 110 | 54 | 2.1 | 9 (3.9) | 2.2 | 5.0 | 1 in 51 | 55 | 1.4 |
| Papum Pare district | 8 (8.1) | 7.6 | 20.1 | 1 in 38 | 55 | 3.6 | 4 (4.0) | 4.2 | 12.8 | 1 in 366 | 60 | 2.4 |
| Meghalaya | 57 (6.1) | 5.6 | 12.4 | 1 in 61 | 60 | 6.5 | 23 (4.1) | 2.3 | 4.3 | 1 in 186 | 61 | 2.0 |
| East Khasi Hills district | 31 (5.3) | 6.9 | 14.1 | 1 in 50 | 60 | 7.5 | 14 (4.0) | 3.1 | 5.3 | 1 in 143 | 64 | 3.1 |
| Nagaland | 17 (6.0) | 4.5 | 8.4 | 1 in 96 | 58 | 2.2 | 7 (3.7) | 2.1 | 4.3 | 1 in 174 | 60 | 1.1 |
| Pasighat | 5 (7.8) | 7.1 | 9.7 | 1 in 77 | 57 | 4.2 | 2 (3.0) | 2.6 | 4.3 | 1 in 158 | 60 | 0.5 |
| Cachar district | 80 (8.6) | 8.5 | 11.9 | 1 in 66 | 63 | 4.8 | 25 (3.2) | 2.8 | 3.9 | 1 in 218 | 60 | 1.5 |
| Dibrugarh district | 27 (5.3) | 3.9 | 5.1 | 1 in 155 | 60 | 1.6 | 10 (2.3) | 1.5 | 2.0 | 1 in 393 | 60 | 0.6 |
| Kamrup urban | 99 (7.9) | 15.1 | 18.1 | 1 in 44 | 64 | 8.0 | 36 (3.8) | 5.7 | 6.7 | 1 in 128 | 56 | 2.3 |
CR, crude incidence rate; AAR, age-adjusted incidence rate; AAMR, adjusted incidence mortality rate; PBCR, population-based cancer registry
Median age at the time of diagnosis: The median age at diagnosis among the males ranged from 54 yr in West Arunachal to 70 yr in Imphal West district (Table I). The median age of 55 yr at diagnosis was the lowest among females in Arunachal Pradesh and highest in Aizawl (70 yr).
Lung cancer mortality: The AAMR in males was highest in Aizawl (27.9 per 100,000), followed by Mizoram (23.1 per 100,000), as seen from Table I. Among females, Aizawl recorded the highest AAMR (24.3 per 100,000) followed by Mizoram (17.1 per 100,000).
Trends in age-adjusted incidence rate (AAR) over time: The change in AAR is presented for males in five PBCRs and for females in four PBCRs. The AAR for incidence was observed to increase with statistically significant APC among males in Delhi (1.35), Bengaluru (1.30) and Chennai (1.48) (Fig. 1). In Mumbai, the AAR in males showed a downward trend, with a significant APC reduction (−1.04). Among females, the AAR showed a rising trend with a significant increase in APC in Bengaluru (4.43), Chennai (4.41), Delhi (1.98) and Mumbai (1.78). The actual points as well as fitted values of the joinpoint regression model are shown in
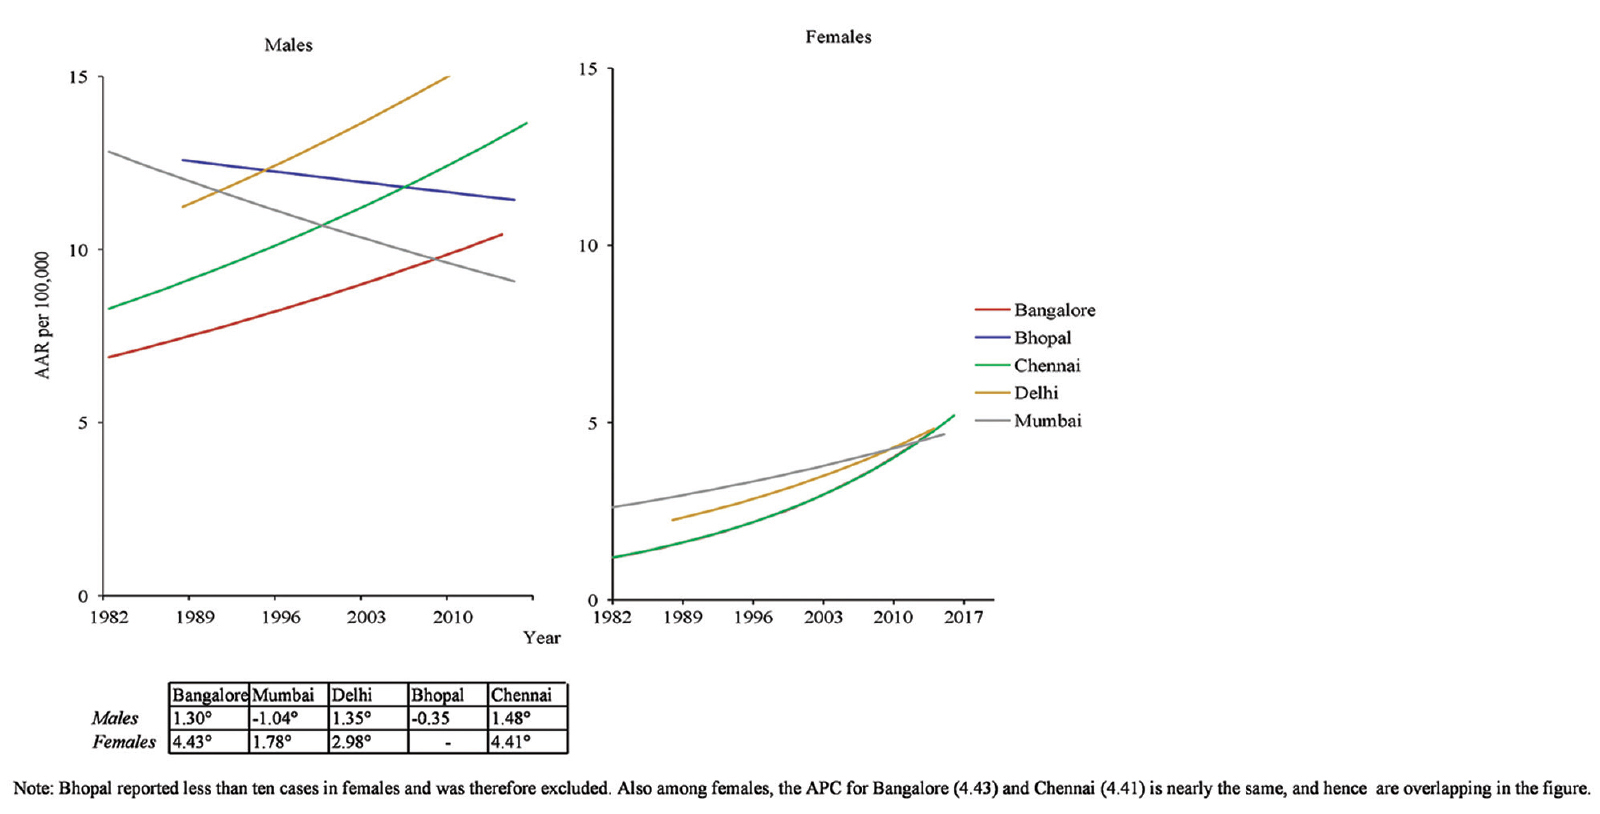
- Lung Cancer: Trends over time in age-adjusted rate 1982-2016.The annual per cent change among females, for Bengaluru (4.43) and Chennai (4.41) is nearly the same and hence is overlapping in the Figure.
Ranking of lung as a leading site cancer and relative proportion amongst tobacco-related cancers: In the NER, the lung constituted the leading site of cancer in males in Manipur (including Imphal West district) and Tripura. In other parts of the country, the lung ranked first as the leading cancer site amongst males in Delhi, Kollam, Thiruvanthapuram, Bengaluru, Chennai, Kolkata, Nagpur and Mumbai. Only Aizawl reported lung to be ranked as the first leading site in females. Lung cancers accounted for nearly two-thirds of the tobacco-related cancers amongst males in the NER and amongst females in the northern parts of the country.
Age distribution and morphologic type of lung cancer according to gender: The age-specific incidence rates of lung cancer for each of the 28 PBCRs are provided in Supplementary Tables I and II. A total of 22,645 lung cancer cases were recorded in the 58 HBCRs from 2012 to 2016, amongst which 17391 (76.7%) were reported in males. The highest proportion of cases (36.5%) in males and females (31.7%) were recorded in the age group of 55-64 yrs (Table II). Adenocarcinoma was the most frequent histologic type (34.3%), followed by squamous cell carcinoma (23.4%) in males. In females, adenocarcinoma comprised over half (52.7%) of the lung cancers and was the leading histologic type of lung cancer, while squamous cell carcinoma accounted for 11.5 per cent of the cases. Adenocarcinoma constituted the highest proportion of cancers in all the age groups up to 54 yr in males and 74 yr in females. The proportion of squamous cell carcinoma was higher beyond 75 yr as compared to adenocarcinoma in both genders. Fifteen cases were documented in the 0-14 yr age group of males, of which five (33.3%) were cases of a mesenchymal tumour. In females, only four cases were noted in the 0-14 yr age group.
| Region | Registry | Age Group | |||||||||||||||
|---|---|---|---|---|---|---|---|---|---|---|---|---|---|---|---|---|---|
| 0-4 | 5-9 | 10-14 | 15-19 | 20-24 | 25-29 | 30-34 | 35-39 | 40-44 | 45-49 | 50-54 | 55-59 | 60-64 | 65-69 | 70-74 | 75+ | ||
| North | Delhi | 0.0 | 0.0 | 0.0 | 0.0 | 0.4 | 0.5 | 1.1 | 2.9 | 6.9 | 13.6 | 33.1 | 54.1 | 85.2 | 109.5 | 126.7 | 104.6 |
| Patiala District | 0.0 | 0.2 | 0.0 | 0.0 | 0.4 | 0.4 | 0.5 | 1.9 | 2.4 | 9.5 | 23.5 | 27.7 | 44.8 | 32.9 | 53.9 | 32.3 | |
| South | Hyderabad District | 0.0 | 0.0 | 0.0 | 0.0 | 0.2 | 0.7 | 1.8 | 1.9 | 6.7 | 10.0 | 18.6 | 28.7 | 59.2 | 90.5 | 121.5 | 76.1 |
| Kollam District | 0.0 | 0.0 | 0.0 | 0.0 | 0.0 | 1.0 | 1.2 | 3.0 | 6.9 | 18.9 | 41.4 | 58.9 | 115.4 | 179.4 | 193.8 | 147.8 | |
| Thi’puram District | 0.0 | 0.0 | 0.0 | 0.0 | 0.3 | 0.9 | 1.1 | 4.0 | 6.1 | 15.8 | 29.5 | 44.7 | 91.3 | 116.0 | 122.2 | 113.8 | |
| Bengaluru | 0.1 | 0.1 | 0.1 | 0.3 | 0.2 | 0.5 | 1.0 | 2.4 | 3.6 | 8.3 | 22.5 | 40.2 | 58.0 | 100.8 | 104.6 | 92.3 | |
| Chennai | 0.0 | 0.1 | 0.0 | 0.2 | 0.4 | 0.3 | 1.6 | 0.7 | 4.5 | 10.0 | 20.4 | 38.4 | 53.3 | 85.0 | 89.7 | 86.8 | |
| East | Kolkata | 0.0 | 0.0 | 0.0 | 0.0 | 0.6 | 0.9 | 1.0 | 2.1 | 5.7 | 12.7 | 36.0 | 56.5 | 85.4 | 118.4 | 158.9 | 136.2 |
| West | Ahmedabad Urban | 0.0 | 0.0 | 0.0 | 0.1 | 0.1 | 0.3 | 0.6 | 1.6 | 3.0 | 8.5 | 16.1 | 25.1 | 43.0 | 60.7 | 73.8 | 56.9 |
| Aurangabad | 0.0 | 0.0 | 0.0 | 0.0 | 0.3 | 0.3 | 2.9 | 2.7 | 3.9 | 6.0 | 21.4 | 24.9 | 40.0 | 62.2 | 76.6 | 37.4 | |
| Osmanabad & Beed | 0.0 | 0.0 | 0.0 | 0.0 | 0.1 | 0.0 | 0.8 | 0.7 | 0.4 | 2.7 | 5.1 | 6.0 | 9.0 | 12.8 | 10.0 | 10.5 | |
| Barshi Rural | 0.0 | 0.0 | 0.0 | 0.0 | 0.0 | 0.0 | 0.0 | 0.0 | 2.5 | 3.0 | 5.2 | 9.1 | 4.4 | 12.8 | 7.7 | 7.7 | |
| Mumbai | 0.1 | 0.1 | 0.0 | 0.1 | 0.3 | 0.6 | 0.7 | 1.6 | 3.4 | 7.4 | 16.0 | 25.7 | 47.8 | 72.5 | 97.9 | 112.4 | |
| Pune | 0.0 | 0.0 | 0.0 | 0.0 | 0.1 | 0.1 | 0.5 | 0.8 | 1.8 | 4.6 | 10.3 | 17.8 | 31.0 | 51.3 | 59.0 | 50.7 | |
| Central | Wardha District | 0.0 | 0.0 | 0.0 | 0.0 | 0.0 | 1.7 | 0.4 | 0.4 | 2.0 | 5.0 | 10.1 | 12.2 | 29.6 | 17.8 | 32.7 | 32.0 |
| Bhopal | 0.0 | 0.3 | 0.0 | 0.2 | 0.2 | 0.2 | 0.9 | 2.9 | 5.3 | 12.1 | 26.8 | 44.5 | 48.6 | 76.1 | 97.7 | 67.1 | |
| Nagpur | 0.0 | 0.0 | 0.2 | 0.0 | 0.2 | 0.5 | 0.9 | 1.5 | 1.7 | 5.8 | 10.9 | 18.7 | 30.1 | 42.7 | 53.3 | 30.4 | |
| North East | Manipur State | 0.0 | 0.0 | 0.0 | 0.0 | 0.3 | 0.3 | 1.0 | 0.7 | 2.5 | 4.5 | 13.7 | 26.1 | 41.8 | 96.9 | 159.1 | 143.4 |
| Imphal West District | 0.0 | 0.0 | 0.0 | 0.0 | 0.0 | 0.0 | 1.8 | 1.9 | 2.2 | 4.9 | 13.6 | 41.2 | 61.2 | 124.0 | 192.8 | 241.3 | |
| Mizoram State | 0.3 | 0.0 | 0.0 | 0.0 | 0.0 | 0.4 | 2.4 | 3.1 | 7.5 | 16.7 | 44.3 | 78.1 | 144.4 | 224.6 | 274.8 | 343.3 | |
| Aizawl District | 1.0 | 0.0 | 0.0 | 0.0 | 0.0 | 0.0 | 2.1 | 2.7 | 12.8 | 23.7 | 50.7 | 79.6 | 187.7 | 309.7 | 277.8 | 408.0 | |
| Sikkim State | 0.0 | 0.0 | 0.0 | 0.0 | 0.0 | 0.0 | 0.6 | 1.6 | 2.8 | 6.9 | 5.3 | 7.3 | 32.2 | 29.4 | 71.7 | 81.1 | |
| Tripura State | 0.0 | 0.0 | 0.0 | 0.0 | 0.2 | 0.4 | 0.1 | 1.5 | 3.7 | 8.5 | 23.4 | 45.1 | 83.9 | 90.5 | 117.2 | 109.0 | |
| West Arunachal | 0.0 | 0.0 | 0.0 | 0.0 | 0.5 | 2.0 | 1.8 | 2.1 | 4.4 | 5.6 | 22.6 | 21.6 | 42.7 | 55.7 | 23.6 | 7.0 | |
| Papumpare District | 0.0 | 0.0 | 0.0 | 0.0 | 0.0 | 6.2 | 2.7 | 0.0 | 6.2 | 7.9 | 66.5 | 29.6 | 160.9 | 255.7 | 0.0 | 0.0 | |
| Meghalaya | 0.0 | 0.0 | 0.0 | 0.0 | 0.2 | 0.0 | 0.6 | 3.1 | 6.6 | 15.0 | 31.9 | 35.4 | 55.5 | 73.2 | 110.6 | 61.8 | |
| East Khasi Hills District | 0.0 | 0.0 | 0.0 | 0.0 | 0.0 | 0.0 | 0.0 | 2.1 | 10.2 | 16.2 | 32.8 | 41.9 | 47.6 | 68.4 | 181.1 | 76.9 | |
| Nagaland | 0.0 | 0.0 | 0.0 | 0.0 | 0.5 | 0.5 | 0.0 | 3.0 | 5.2 | 6.4 | 16.7 | 33.7 | 18.3 | 81.2 | 44.6 | 60.6 | |
| Pasighat | 0.0 | 0.0 | 0.0 | 0.0 | 0.0 | 0.0 | 0.0 | 4.2 | 0.0 | 25.0 | 25.5 | 35.4 | 42.3 | 16.1 | 112.0 | 44.5 | |
| Cachar District | 0.2 | 0.0 | 0.0 | 0.0 | 0.5 | 0.0 | 0.0 | 1.8 | 3.7 | 9.4 | 19.4 | 33.7 | 62.5 | 63.2 | 112.9 | 100.5 | |
| Dibrugarh District | 0.0 | 0.0 | 0.0 | 0.0 | 0.0 | 1.2 | 0.0 | 1.1 | 2.1 | 5.9 | 12.7 | 9.2 | 20.3 | 37.9 | 38.7 | 38.4 | |
| Kamrup Urban | 0.0 | 0.0 | 0.0 | 0.0 | 0.3 | 0.3 | 1.1 | 2.7 | 6.1 | 11.5 | 25.9 | 55.7 | 67.0 | 108.7 | 181.1 | 182.7 | |
| Region | Registry | Age Group | |||||||||||||||
|---|---|---|---|---|---|---|---|---|---|---|---|---|---|---|---|---|---|
| 0-4 | 5-9 | 10-14 | 15-19 | 20-24 | 25-29 | 30-34 | 35-39 | 40-44 | 45-49 | 50-54 | 55-59 | 60-64 | 65-69 | 70-74 | 75+ | ||
| North | Delhi | 0.0 | 0.0 | 0.0 | 0.0 | 0.1 | 0.4 | 0.9 | 1.8 | 2.8 | 6.3 | 12.6 | 16.7 | 22.5 | 31.6 | 28.8 | 28.4 |
| Patiala District | 0.0 | 0.0 | 0.0 | 0.0 | 0.0 | 0.2 | 0.8 | 1.7 | 2.7 | 2.0 | 7.5 | 16.1 | 6.8 | 15.3 | 12.9 | 17.5 | |
| South | Hyderabad District | 0.0 | 0.0 | 0.0 | 0.0 | 0.1 | 0.0 | 1.8 | 1.3 | 3.6 | 6.5 | 12.3 | 23.1 | 34.1 | 39.7 | 35.3 | 20.1 |
| Kollam District | 0.0 | 0.0 | 0.0 | 0.0 | 0.0 | 0.6 | 0.4 | 1.3 | 1.6 | 6.6 | 9.6 | 9.5 | 16.7 | 25.5 | 21.9 | 21.5 | |
| Thi’puram District | 0.0 | 0.0 | 0.0 | 0.0 | 0.1 | 0.4 | 1.4 | 1.0 | 3.3 | 6.1 | 12.1 | 13.4 | 18.8 | 28.9 | 29.4 | 28.3 | |
| Bengaluru | 0.0 | 0.0 | 0.1 | 0.0 | 0.1 | 0.4 | 0.8 | 1.8 | 3.9 | 8.3 | 13.9 | 19.5 | 23.7 | 29.4 | 38.7 | 37.7 | |
| Chennai | 0.0 | 0.0 | 0.0 | 0.0 | 0.0 | 0.3 | 1.2 | 2.2 | 2.2 | 5.2 | 10.0 | 14.1 | 19.0 | 25.7 | 30.3 | 28.0 | |
| East | Kolkata | 0.0 | 0.0 | 0.0 | 0.0 | 0.0 | 0.6 | 0.9 | 3.5 | 3.3 | 9.3 | 12.4 | 17.3 | 24.8 | 33.7 | 35.3 | 37.7 |
| West | Ahmedabad Urban | 0.1 | 0.0 | 0.1 | 0.0 | 0.1 | 0.3 | 0.6 | 0.7 | 0.9 | 2.3 | 5.1 | 6.2 | 11.9 | 18.6 | 13.5 | 11.6 |
| Aurangabad | 0.0 | 0.0 | 0.0 | 0.0 | 0.3 | 0.3 | 1.1 | 1.6 | 1.5 | 5.1 | 4.0 | 11.0 | 16.1 | 14.8 | 26.8 | 14.0 | |
| Osmanabad & Beed | 0.3 | 0.0 | 0.0 | 0.0 | 0.1 | 0.1 | 0.2 | 0.9 | 1.6 | 1.9 | 2.4 | 4.8 | 2.2 | 5.2 | 3.9 | 3.5 | |
| Barshi Rural | 0.0 | 0.0 | 0.0 | 0.0 | 0.0 | 1.1 | 1.2 | 1.2 | 3.9 | 1.6 | 5.7 | 6.7 | 5.5 | 14.0 | 2.8 | 5.3 | |
| Mumbai | 0.1 | 0.1 | 0.1 | 0.2 | 0.2 | 0.5 | 1.3 | 2.0 | 2.9 | 6.3 | 9.3 | 14.7 | 19.1 | 35.8 | 47.6 | 62.6 | |
| Pune | 0.0 | 0.1 | 0.1 | 0.1 | 0.1 | 0.3 | 0.6 | 1.9 | 3.0 | 5.8 | 7.5 | 8.2 | 20.9 | 29.1 | 20.8 | 23.3 | |
| Central | Wardha District | 0.5 | 0.0 | 0.0 | 0.4 | 0.0 | 0.0 | 1.6 | 1.5 | 2.1 | 3.0 | 5.6 | 10.5 | 8.5 | 8.8 | 12.2 | 10.4 |
| Bhopal | 0.0 | 0.0 | 0.0 | 0.0 | 0.0 | 0.2 | 1.2 | 1.3 | 2.7 | 7.4 | 9.5 | 13.5 | 14.7 | 19.3 | 21.4 | 10.0 | |
| Nagpur | 0.0 | 0.0 | 0.0 | 0.0 | 0.6 | 0.8 | 1.2 | 1.3 | 3.9 | 4.0 | 6.4 | 7.3 | 10.8 | 14.7 | 16.0 | 8.3 | |
| North East | Manipur State | 0.0 | 0.0 | 0.1 | 0.0 | 0.1 | 0.4 | 1.1 | 0.7 | 2.5 | 4.6 | 16.0 | 27.7 | 49.9 | 90.2 | 127.4 | 103.1 |
| Imphal West District | 0.0 | 0.0 | 0.0 | 0.0 | 0.8 | 0.0 | 0.8 | 0.9 | 5.2 | 9.6 | 31.5 | 39.4 | 64.5 | 104.4 | 156.7 | 179.7 | |
| Mizoram State | 0.0 | 0.0 | 0.0 | 0.4 | 0.3 | 0.0 | 2.0 | 2.1 | 5.2 | 8.1 | 30.1 | 69.4 | 107.8 | 191.7 | 290.8 | 318.6 | |
| Aizawl District | 0.0 | 0.0 | 0.0 | 1.0 | 0.0 | 0.0 | 3.9 | 3.8 | 4.7 | 7.8 | 27.9 | 94.1 | 110.6 | 252.9 | 400.6 | 569.8 | |
| Sikkim State | 0.0 | 0.0 | 0.0 | 0.0 | 0.0 | 0.0 | 0.0 | 1.8 | 0.0 | 8.1 | 9.9 | 16.2 | 26.9 | 47.3 | 60.2 | 81.4 | |
| Tripura State | 0.0 | 0.0 | 0.0 | 0.1 | 0.0 | 0.3 | 0.6 | 0.8 | 1.4 | 4.0 | 8.1 | 10.1 | 14.0 | 17.7 | 31.5 | 19.0 | |
| West Arunachal | 0.0 | 0.0 | 0.0 | 0.0 | 0.0 | 0.5 | 0.0 | 0.7 | 4.2 | 8.1 | 5.1 | 21.7 | 27.6 | 27.6 | 40.9 | 13.9 | |
| Papumpare District | 0.0 | 0.0 | 0.0 | 0.0 | 0.0 | 2.0 | 0.0 | 0.0 | 13.6 | 10.1 | 8.8 | 31.2 | 91.0 | 36.8 | 205.9 | 32.8 | |
| Meghalaya | 0.0 | 0.0 | 0.0 | 0.0 | 0.0 | 0.2 | 0.0 | 2.4 | 1.6 | 5.0 | 8.8 | 13.0 | 24.1 | 25.4 | 27.5 | 25.6 | |
| East Khasi Hills District | 0.0 | 0.0 | 0.0 | 0.0 | 0.0 | 0.0 | 0.0 | 2.7 | 0.8 | 6.0 | 4.0 | 13.5 | 34.4 | 41.2 | 37.6 | 33.7 | |
| Nagaland | 0.0 | 0.0 | 0.0 | 0.0 | 0.5 | 0.0 | 0.7 | 2.3 | 4.1 | 2.7 | 5.7 | 11.8 | 31.2 | 32.0 | 24.1 | 10.5 | |
| Pasighat | 0.0 | 0.0 | 0.0 | 0.0 | 0.0 | 0.0 | 0.0 | 0.0 | 4.8 | 0.0 | 9.1 | 14.0 | 22.8 | 50.7 | 25.5 | 0.0 | |
| Cachar District | 0.0 | 0.0 | 0.0 | 0.0 | 0.0 | 0.0 | 0.0 | 1.5 | 2.2 | 5.2 | 7.8 | 13.9 | 16.6 | 20.5 | 24.4 | 31.2 | |
| Dibrugarh District | 0.0 | 0.0 | 0.0 | 0.0 | 0.3 | 0.0 | 0.4 | 0.7 | 1.3 | 3.0 | 2.8 | 6.5 | 10.4 | 13.6 | 12.0 | 11.3 | |
| Kamrup Urban | 0.0 | 0.0 | 0.0 | 0.4 | 0.3 | 0.6 | 2.6 | 2.3 | 4.5 | 8.3 | 10.3 | 30.3 | 36.0 | 28.3 | 33.1 | 44.7 | |
| Age group (yr) | Epithelial tumours-adenocarcinoma, n (%) | Epithelial tumours-squamous cell carcinoma, n (%) | Small cell carcinoma, n (%) | Non-small cell carcinoma, n (%) | Epithelial tumours-others, n (%) | Lymph histiocytic tumours, n (%) | Mesenchymal tumours, n (%) | Others*, n (%) | Total number of lung cancers, n (%) |
|---|---|---|---|---|---|---|---|---|---|
| Males | |||||||||
| 0-14 | 5 (0.1) | 1 (0) | 0 | 0 | 0 | 1 (3.6) | 6 (13.0) | 2 (0) | 15 (0.1) |
| 15-24 | 32 (0.5) | 8 (0.2) | 2 (0.1) | 2 (0) | 1 (0) | 4 (14.3) | 3 (6.5) | 3 (0.2) | 55 (0.3) |
| 25-34 | 152 (2.5) | 22 (0.5) | 14 (0.8) | 37 (1) | 18 (2) | 4 (14.3) | 5 (10.9) | 31 (1.7) | 283 (1.6) |
| 35-44 | 412 (6.9) | 124 (3.0) | 71 (4.0) | 144 (5.3) | 65 (7) | 3 (10.7) | 2 (4.3) | 118 (6.5) | 939 (5.4) |
| 45-54 | 1293 (21.6) | 613 (15.0) | 364 (20.7) | 512 (18.8) | 186 (19) | 4 (14.3) | 7 (15.2) | 436 (24.2) | 3415 (19.6) |
| 55-64 | 2098 (35.1) | 1547 (37.9) | 701 (39.9) | 988 (36.2) | 361 (37) | 6 (21.4) | 13 (28.3) | 637 (35.3) | 6351 (36.5) |
| 65-74 | 1548 (25.9) | 1319 (32.3) | 486 (27.7) | 792 (29.0) | 259 (27) | 4 (14.3) | 9 (19.6) | 454 (25.2) | 4871 (28.0) |
| 75+ | 439 (7.3) | 449 (11.0) | 117 (6.7) | 252 (9.2) | 79 (8) | 2 (7.1) | 1 (2.2) | 121 (6.7) | 1460 (8.4) |
| Total | 5979 (100) | 4083 (100) | 1755 (100) | 2727 (100) | 970 (100) | 28 (100) | 46 (100) | 1803 (100) | 17,391 (100) |
| Females | |||||||||
| 0-14 | 1 (0.0) | 0 | 0 | 1 (0.2) | 1 (0.3) | 0 | 1 (4.5) | 0 | 4 (0.1) |
| 15-24 | 14 (0.5) | 3 (0.5) | 7 (2.2) | 4 (0.6) | 3 (0.9) | 0 | 1 (4.5) | 1 (0.2) | 33 (0.6) |
| 25-34 | 117 (4.2) | 12 (2.0) | 11 (3.5) | 21 (3.4) | 13 (4.0) | 0 | 5 (22.7) | 19 (3.3) | 198 (3.8) |
| 35-44 | 363 (13.1) | 53 (8.8) | 37 (11.7) | 56 (9.0) | 38 (11.6) | 2 (11.8) | 3 (13.6) | 82 (14.3) | 634 (12.1) |
| 45-54 | 715 (25.8) | 123 (20.4) | 72 (22.7) | 143 (23.1) | 93 (28.3) | 4 (23.5) | 6 (27.3) | 143 (25.0) | 1299 (24.7) |
| 55-64 | 877 (31.6) | 192 (31.8) | 107 (33.8) | 204 (33.0) | 88 (26.7) | 8 (47.1) | 5 (22.7) | 185 (32.3) | 1666 (31.7) |
| 64-74 | 525 (18.9) | 182 (13.1) | 63 (19.9) | 143 (23.1) | 71 (21.6) | 3 (17.6) | 1 (4.5) | 115 (20.1) | 1103 (21.0) |
| 75+ | 161 (5.8) | 39 (6.5) | 20 (6.3) | 47 (7.6) | 22 (6.7) | 0 | 0 | 28 (4.9) | 317 (6.0) |
| Total | 2773 (100) | 604 (100) | 317 (100) | 619 (100) | 329 (100) | 17 (100) | 22 (100) | 573 (100) | 5254 (100) |
*Others, bronchioalveolar; large cell; adenosquamous; mesothelioma; carcinoma NOS. NOS, not otherwise specified
Diagnostic method, clinical extent of disease at presentation and waiting time between diagnosis and treatment initiation: As many as 97.4 per cent of the lung cancers in males and 97.5 per cent in females had undergone a histopathological evaluation towards diagnosis. The proportion of those diagnosed by imaging (2.1%) and clinically (0.2%) was low. Close to half (44.8%) of the patients presented with a distant spread, while over one-third (35.3%) had loco-regional spread of the disease at the time of diagnosis (Fig. 2). Over one-third of the patients received treatment between days eight and 30 following diagnosis, regardless of the clinical extent of disease (Fig. 3).
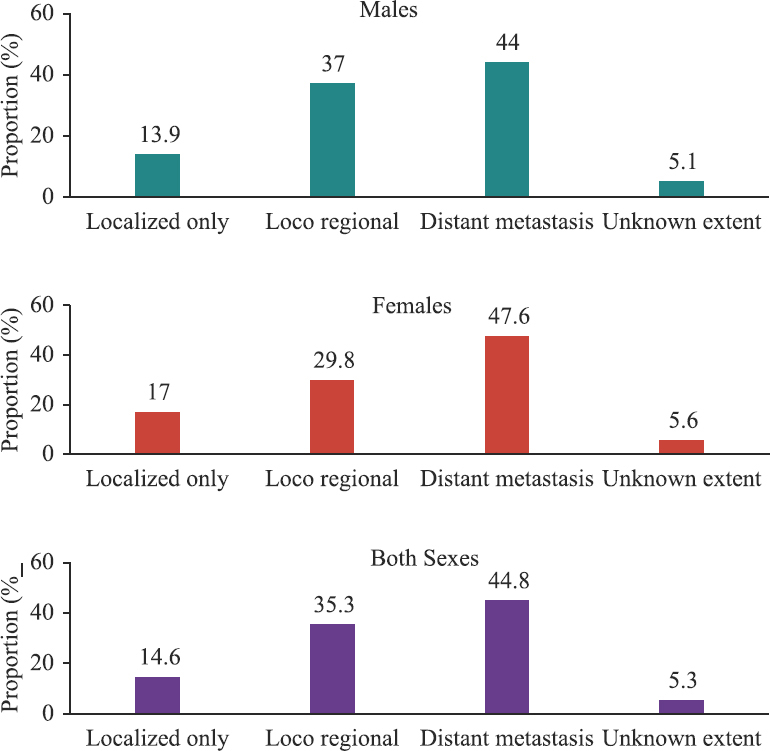
- Clinical extent of disease at presentation.
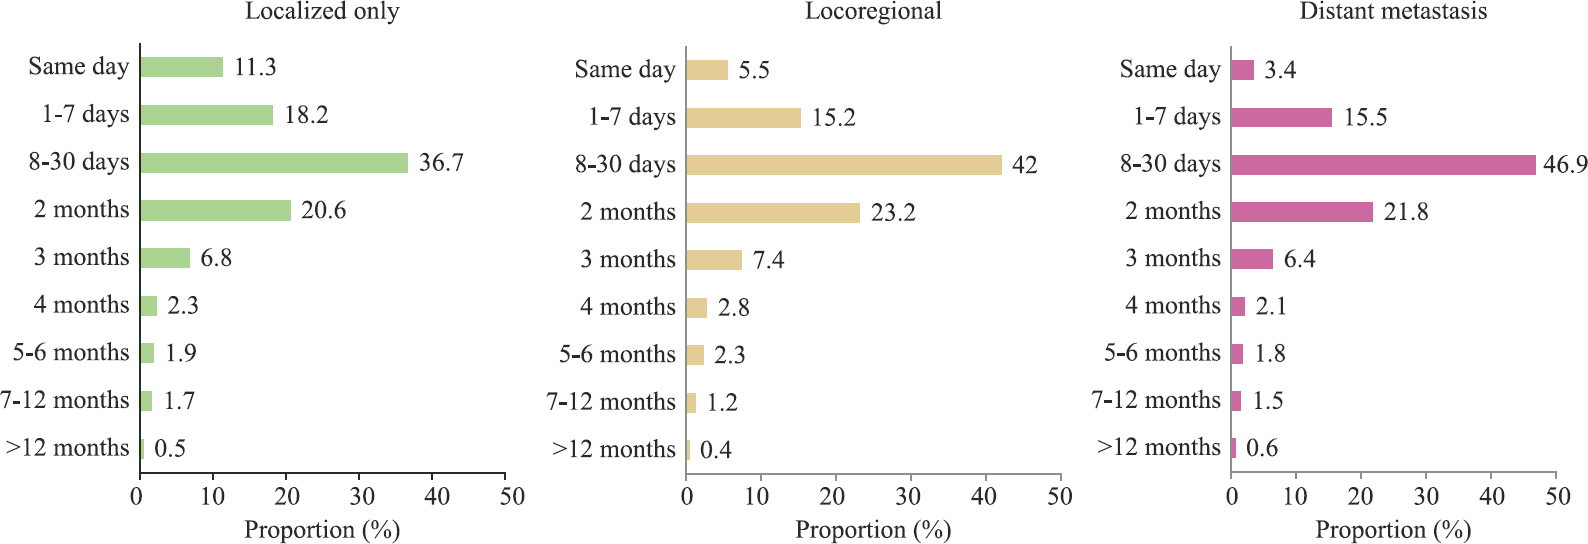
- Time between first diagnosis and commencement of cancer-directed treatment at reporting institution.
Projected number of lung cancer cases and age-specific incidence rates: The number of cases is expected to rise sharply to 812, 19 cases among males and 30109 in females by 2025 (Fig. 4). The number of cases would be the highest in the 60-64 yr age group with about 15,759 among males and 4,779 in females. The projected age-specific incidence rate for 2025 would be highest in the 70-74 yr age group in males and the 75 yr plus age group in females.
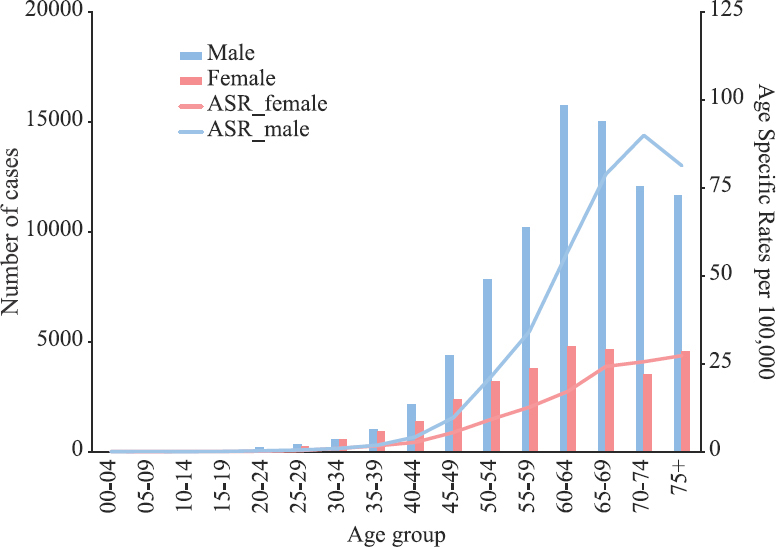
- Projected age-wise number and age specific incidence rate for Lung cancer cases (2025).
Discussion
This is a comprehensive study on the epidemiological aspects of lung cancer in India based on an analysis from an extensive cancer registry network data. Aizawl district, followed by the entire State of Mizoram in the NER, recorded the highest incidence rate of lung cancer in both genders and is in accordance with the findings from the previous report6. The reported prevalence of tobacco use in Mizoram is 58.7 per cent, with a high rate of smoked tobacco use (25.1%) than other parts of the country12. Lung cancer incidence rates were lesser in Barshi, Osmanabad and Beed district in both genders and Wardha and Dibrugarh among males. This could be attributed to a current smoked tobacco prevalence rate of 3.8 per cent in Maharashtra; however, other factors such as poor treatment-seeking resulting in less reporting of cases need further exploration12.
The use of smoked tobacco is coupled with using locally available forms such as ‘tuibur’ (tobacco smoke-infused water), which appears to have a cultural context in NER and is commonly used by women13. Results on the association between smokeless tobacco use and lung cancer are found to be inconsistent14.
The rising trend in the AAR amongst males and females in the metro cities of Delhi, Bengaluru and Chennai over three decades is of concern, signifying the role of smoked tobacco, indoor and outdoor air pollution, but also could allude to an increased health-seeking behaviour for treatment, resulting in enhanced detection. Compared to GATS (Global Adult Tobacco Survey)-1 (2009-2010), the prevalence of tobacco use has decreased in GATS-2 (2016-2017)1215. Hence, there is an increasing recognition of the role of air pollution in the causation of lung cancer1617. According to recent findings of the National Non-Communicable Disease Monitoring Survey (NNMS), almost half (48.5%) of the adults reported exposure to second-hand smoke at home, workplace or travel18. The declining trend in lung cancer incidence in males and rising trend amongst females in Mumbai and Bhopal points towards a changing aetiology, which could be due to decreased smoking rates in men and increase in solid fuel exposure amongst women. Similar findings have been corroborated by other trend analysis studies on PBCR data192021. These would, however, need further investigation to confirm the potential reasons for this pattern192021. In the NNMS survey, over one-third (37.5%) of the women reported exposure to second hand smoke; in rural areas, the exposure occurred at home for 35.2 per cent of the participants18.
The age-adjusted lung mortality rate was highest among males and females in Aizawl district, which also corresponds to the high incidence rate. Lung cancer mortality rates have been positively correlated with cigarette smoking patterns2223. This correlation is evident from the observed decline in mortality rates in the United States and the United Kingdom and rising rates in the BRIC (Brazil, Russia, India and China) countries3. Low survival rates often result from an advanced stage at presentation and deficiency in the availability and accessibility to quality healthcare24.
Our analysis indicated that the median age at presentation ranged from 54 to 70 yr in different geographic areas. Compared to the western population, our median age of presentation tends to be a decade earlier in the Indian population. The mean age of presentation in patients presenting at a tertiary care hospital in North India was 57.9±11.3 yr25.
The pathologic behaviour of lung cancer differs in males and females but lung cancer tends to display male preponderance2. In the present study, over two-third (76.7%) of the patients were males. Adenocarcinoma comprised over half of the lung cancers in females and about one-third of all cancers in males in our study. This is in tandem with other reports which have shown that the incidence of adenocarcinoma tends to be higher in females26, and it is reportedly the most frequent histopathologic type of cancer among non-smokers27.
Close to half of the patients had a distant spread of disease at the time of presentation in our analysis. Similar findings have been reported by studies from other Indian settings where most of the patients had Stage IV disease at the time of diagnosis2829. In the Indian context, misdiagnosis of lung cancer as pulmonary tuberculosis is a frequently encountered reason for delayed diagnosis30.
The present analysis was conducted on nationally representative data from 28 PBCRs and 58 HBCRs. It provides a comprehensive and descriptive profile of lung cancer epidemiology and clinical and histopathological profile of lung cancer in India through a systematic collection of robust data. However, the data on the number of cancer deaths compiled by registries are mostly insufficient. Most death certificates do not contain details on the underlying cause, which leads to under-reporting of mortality. Even if cancer is mentioned to be the cause of death, there are gaps in the information pertaining to the anatomical site and morphological type of cancer.
Overall, the findings on lung cancer and the projected increase in cases derived from the NCRP data analysis call for scaling up and intensifying lung cancer-specific preventive and control measures. It is suggested that while framing policies related to tobacco control in India, policymakers should consider the regionally relevant sociocultural factors. The role of exposure to environmental smoke in the causation of lung cancer should not be underestimated. Understanding the morphologic classification of lung cancer provides a background to explore novel treatment modalities regarding molecular targets. It is thus suggested that, capacity building of healthcare providers to ensure timely diagnosis and treatment will improve survivorship and prolong disease-free intervals. A robust mechanism of policy implementation, health system strengthening and research promotion in genetic risk factor profiling, improved diagnosis and novel targeted therapies are critical measures for lung cancer control in the country.
Supplementary Figure
Supplementary Figure Trends in age-adjusted rate showing actual points as well as fitted values.Acknowledgment:
The authors would like to acknowledge the contribution of all the investigators and staff under ICMR-NCDIR’s NCRP.
Financial support & sponsorship: The cancer registries are funded by intramural funding of ICMR-NCDIR, Bengaluru, India and the Ministry of Health and Family Welfare, Government of India.
Conflicts of Interest: None.
References
- 2020. International Agency for Research on Cancer. World Health Organization. Lung Factsheet: Globocan; Available from: https://gco.iarc.fr/today/data/factsheets/cancers/15-Lung-fact-sheet.pdf
- Global Cancer Statistics 2020:GLOBOCAN estimates of incidence and mortality worldwide for 36 cancers in 185 countries. CA Cancer J Clin (71):209-49.
- [Google Scholar]
- 2018. International Agency for Research on Cancer. World Health Organization. WHO South-East Asia Region: Globocan. Available from: https://gco.iarc.fr/today/data/factsheets/populations/995-who-south-east-asia-region-searo-fact-sheets.pdf
- ICMR-National Centre for Disease Informatics and Research. Three-year report of population-based cancer registries 2012-2014. Bengaluru, India: ICMR-NCDIR; 2016.
- ICMR-National Centre for Disease Informatics and Research.. Report of National Cancer Registry Programme 2020. Bengaluru, India: ICMR-NCDIR; 2020.
- World Health Organization. International classification of diseases for oncology (3rd ed). Geneva: WHO; 2013.
- Cancer mortality for selected sites in 24 countries (1950-1957). Nagoya, Japan: Department of Public Health, Tohoku University School of Medicine; 1960.
- National Cancer Institute. Division of Cancer Control & Population Sciences. Joinpoint Trend Analysis Software (Version 4.8.0.1). Available from: https://www.surveillance.cancer.gov/joinpoint/
- Cancer statistics, 2020:Report from national cancer registry programme, India. JCO Glob Oncol (6):1063-75.
- [Google Scholar]
- Tata Institute of Social Sciences (TISS), Mumbai and Ministry of Health and Family Welfare, Government of India. Global Adult Tobacco Survey GATS 2 India 2016-17. Available from: https://ntcp.nhp.gov.in/assets/document/surveys-reports-publications/Global-Adult-Tobacco-Survey-Second-Round-India-2016-2017.pdf
- Tobacco use and stomach cancer in Mizoram, India. Cancer Epidemiol Biomarkers Prev (14):1892-6.
- [Google Scholar]
- Centers for Disease Control and Prevention. World Health Organization. International Institute for Population Sciences, Deonar, Mumn=bai. Ministry of Health and Family Welfare, Government of India. Global Adult Tobacco Survey India 2009-2010. Available from: https://ntcp.nhp.gov.in/assets/document/surveys-reports-publications/Global-Adult-Tobacco-Survey-India-2009-2010-Report.pdf
- Indoor air pollution as a risk factor for lung cancer in women. J Assoc Physicians India (53):190-2.
- [Google Scholar]
- Central Pollution Control Board. Epidemiological study on effect of air pollution on human health (adults) in Delhi. Delhi: Chandu Press; 2012.
- ICMR-National Centre for Disease Informatics and Research. National Noncommunicable Disease Monitoring Survey (NNMS) 2017-18. Available from: https://www.ncdirindia.org/nnms/
- Clinical profile of lung cancer in North India:A 10-year analysis of 1862 patients from a tertiary care center. Lung India. 2020;37:190-7.
- [Google Scholar]
- Trends in lung cancer incidence in Delhi, India 1988-2012:Age-period-cohort and joinpoint analyses. Asian Pac J Cancer Prev (19):1647-54.
- [Google Scholar]
- Lifetime risk and trends in lung cancer incidence in greater Mumbai. Asian Pac J Cancer Prev (10):75-82.
- [Google Scholar]
- 50-year trends in smoking-related mortality in the United States. N Engl J Med. 2013;368:351-64.
- [Google Scholar]
- Outcomes in lung cancer:9-Year experience from a tertiary cancer center in India. J Glob Oncol (3):459-68.
- [Google Scholar]
- Unchanging clinico-epidemiological profile of lung cancer in north India over three decades. Cancer Epidemiol. 2010;34:101-4.
- [Google Scholar]
- The relevance of “Nonsmoking-associated lung cancer”in India:A single-centre experience. Indian J Cancer (49):82-8.
- [Google Scholar]
- Clinico-pathological profile of lung cancer at AIIMS:A changing paradigm in India. Asian Pac J Cancer Prev (14):489-94.
- [Google Scholar]
- Delays during the diagnostic evaluation and treatment of lung cancer. Asian Pac J Cancer Prev. 2009;10:453-6.
- [Google Scholar]
- A common medical error:Lung cancer misdiagnosed as sputum negative tuberculosis. Asian Pac J Cancer Prev. 2009;10:335-8.
- [Google Scholar]


