
Translate this page into:
Nutrition morbidity interactions in pre-school children
For correspondence: Dr Prema Ramachandran, Nutrition Foundation of India, C 13 Qutab Institutional Area, New Delhi 110 016, India e-mail: premaramachandran@gmail.com
-
Received: ,
This article was originally published by Wolters Kluwer - Medknow and was migrated to Scientific Scholar after the change of Publisher.
Abstract
Background & objectives:
Research studies in the 1970s reported that in pre-school children, undernutrition increased the risk of infections and infections aggravated undernutrition. Over decades, there has been a reduction in prevalence of undernutrition and improvement in access to healthcare for treatment of infections. A mixed longitudinal study was undertaken to assess whether over time there were any changes from the earlier reported effect of undernutrition prior to infection on the risk of morbidity and effect of morbidity on nutritional status in pre-school children.
Methods:
Pre-school (0-59 months of age) children from urban low- and middle-income families whose parents were willing to allow their participation in the study were enrolled. Information on sociodemographic profile of the families was collected at enrolment. Weight of all children and length in infants were recorded every month; length/height in children 12-59 months of age was recorded once in three months. Morbidity information was collected through fortnightly visits.
Results:
3888 pre-school children were followed up in 74636 home visits. Among these children, underweight and wasting were associated with a small increase in risk of infections. The odds ratio for risk of infection for underweight children was 1.09 (95% CI: 1.02 to 1.16) and for wasting was 1.18 (95% CI: 1.08 to 1.29). The deterioration in Z scores for weight-for-age and body mass index-for-age in children during illness and convalescence was small but significant (P<0.001).
Interpretation & conclusions:
The increased risk of infections in undernourished children living in overcrowded tenements in areas with poor environmental hygiene was not significant, perhaps because the risk of infection in normally nourished children was also high. The deterioration in nutritional status following infection was small because of the ready access to and utilization of health and nutrition care.
Keywords
Body mass index-for-age
effect of morbidity on nutritional status
nutritional status
pre-school children
risk of infection
weight-for-age

In India, during the 1970s, majority of the households were food insecure and the prevalence of undernutrition, morbidity due to infections and under-five mortality rates were high1. Research studies carried out between 1960 and 1980 globally2,3 and in India4 showed an association between undernutrition in pre-school children and increased risk of infections. Undernourished children had immune depression5-8 which might have been responsible for the increased risk of infection. Small-scale longitudinal studies in the 1970s reported that infections can aggravate undernutrition9. If this vicious cycle continued without intervention, it might result in child death. To cut this vicious cycle, multisectoral intervention programmes aimed at improving household food security, food supplementation to bridge the gap in dietary intake in pre-school children and improving access to essential child healthcare were initiated and implemented in the last four decades. Over years, there has been a slow but sustained reduction in prevalence of undernutrition10, but undernutrition rates are nevertheless still high11-14. Morbidity rates continue to be high, but because of better access to healthcare, there has been a substantial reduction in under-five mortality11-14. It is important to study nutrition morbidity interactions under this changed scenario. Analysis of cross-sectional data from the National Family Health Survey 3 (NFHS 2005-2006) showed that, unlike four decades ago, the increase in risk of infections in underweight and wasted Indian pre-school children was small, though significant15. Cross-sectional studies cannot document the effect of nutritional status prior to the morbidity episode on the risk of morbidity or effect of morbidity on the nutritional status of children.
This mixed longitudinal study was undertaken in urban pre-school children to assess; the effect of undernutrition prior to morbidity on risk of morbidity and to assess the impact of morbidity on the nutritional status.
The results from this study may provide useful leads for mid-course modifications in the ongoing public health interventions for accelerating the improvement in nutritional status of pre-school children.
Material & Methods
The study design is summarized schematically in Figure 1. The study was undertaken in the low- and middle-income groups because the prevalence of undernutrition, infections and adverse interactions between these two were expected to be higher in this group as compared to other income groups. A census of all the households in selected blocks in South Delhi was carried out in January 2012 and was subsequently updated in January 2013, 2014 and 2015. From these census data, low- and middle-income families with pre-school (0-59 months) children were identified and contacted. These families (families with under five children) were provided the study information sheet in Hindi, and the details of the study were discussed. Informed consent was obtained from parents of children who were likely to stay in the locality for the next year and were willing to allow participation of their children in the study. As long as the family resided in the study area, they were followed up. As and when they moved out, new tenants came; if the new tenants had under five children and were willing to participate in the study, the children were enrolled and followed up.
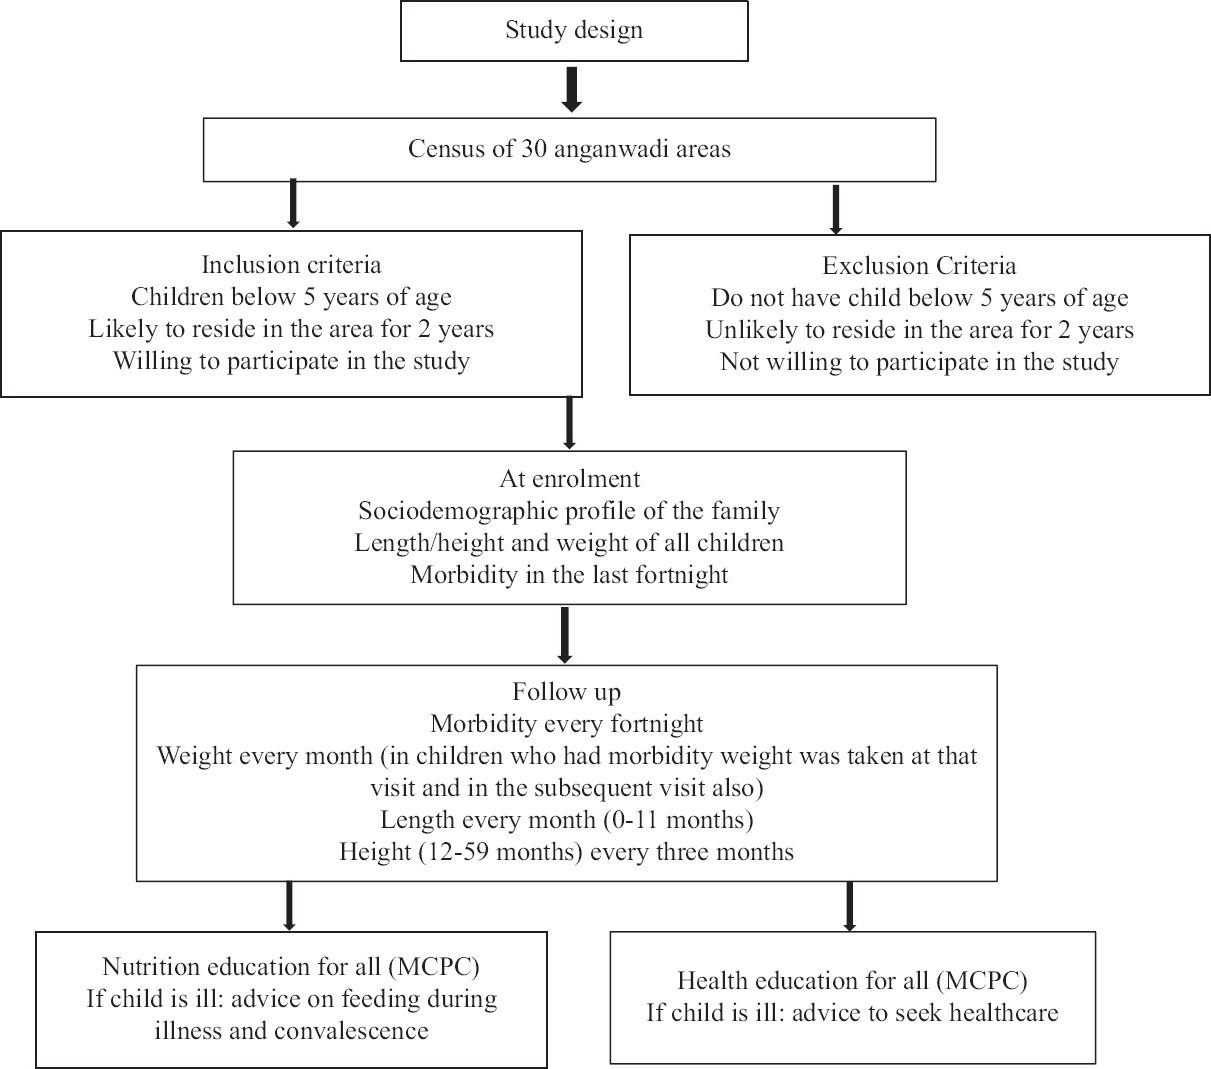
- Study design.
This study had two interlinked objectives, both of which required follow up of a large number of pre-school children. The mixed longitudinal observational study design was used because it enabled the use of the follow up of multiple groups of children for varying durations of time to obtain required large number of follow up visits in children in the 0-59 months of age. This was possible as all those children who were enrolled were from the same locality, shared similar sociodemographic, morbidity and nutritional profile. Approval to undertake the study was obtained from the Institutional Ethics Committee. Permission to conduct the study was obtained from the Department of Women and Child Development, National Capital Territory, Delhi.
Data collection in community setting: The research team consisted of postgraduates in nutrition and frontline nursing personnel predominantly auxiliary nurse midwives (ANMs). They were trained in data collection pertaining to morbidity, infant and young child feeding practices, and utilization of healthcare. The teams were provided with 100 g accurate digital balances, infantometers and stature meters with 0.1 cm accuracy. Specific training was provided to personnel to ensure accuracy of length and height measurements in under-five children; only those who achieved the required accuracy (±0.1 cm in length/height) at the end of the training programme were included in teams who undertook measurements. Once in three months, the faculty consisting of senior nutrition scientists assessed the accuracy of measurements while each team member was taking length and height measurement of pre-school children in the community setting. Persons who did not have the needed accuracy level at the time of review were given additional training till they became proficient. Balances were checked every day for accuracy. The stature meters and infantometers used in the study were checked for accuracy once a week.
Data on sociodemographic profile of the household were collected in pre-tested pre-coded proforma. Information on morbidity was collected every fortnight; data on infant and young child feeding were collected once in a month in pre-tested pre-coded proforma. Mothers of all children were given Mother and Child Protection Card (MCPC); nutrition and health education messages were explained to them using the MCPC. If the child was ill at the time of follow up, the parents were advised to seek healthcare; nutrition education on feeding during illness and convalescence was also provided.
Follow up: Every fortnight mothers were asked whether their child had any illness in the last fortnight or is currently ill; the number of times the child was ill during the fortnight was ascertained. In children who had an illness, symptoms (e.g. diarrhoea, fever and cough), duration and severity of illness, healthcare sought and treatment given were recorded and the status of the child during visit was ascertained. Duration of illness was computed from the time symptoms began and the time when symptoms disappeared.
All children were weighed every month. The length was measured and recorded every month in infants. In children in the age group of 12-59 months, length/height was measured once in every three months - length was measured in children who could not stand erect and the height in children who could stand erect. Appropriate adjustments recommended by the WHO were made for children in 12-23 months if standing height was measured. If the children were ill during the fortnightly visit, they were weighed even if it was not the scheduled visit for weighing; children who were ill were weighed again during the next fortnightly visit. This procedure was used to ensure data collection to assess the effect of morbidity on body weight during and after the episode of morbidity due to infection.
Sample size: An earlier study on calcium and vitamin D supplementation conducted by the institution in pre-school children from the same locality showed that the prevalence of morbidity was about 10 per cent and the prevalence of undernutrition [as assessed by body mass index (BMI)-for-age] in the under-five children was 10 per cent. Analysis of data from the National Family Health Survey-3 showed that the relative risk of morbidity due to infection in wasted under-five children (BMI-for-age <−2 SD) was 1.315.
The sample size for assessing number of morbidity episodes in undernourished children was computed using the method suggested by Twisk for longitudinal data analysis16 was 7710; the assumptions were: (i) 13 per cent prevalence of morbidity due to infection and a relative risk of 1.3 for morbidity due to infection in undernourished children; (ii) 20 fortnightly follow up visits per child; (iii) the allocation ratio of exposed and unexposed was 1:9; and (iv) power and level of significance of 80 and five per cent, respectively.
Data analysis: Data were entered and managed on Microsoft Excel 2007. Nutritional status of children was assessed using the World Health Organization (WHO) Anthro software (https://who-anthro.software.informer.com/3.2/). Weight was measured every month, but height in 1-5-yr-old children was measured once in three months; height values for the intervening two months were interpolated (by distributing the increment in height evenly across the intervening months) and height- weight- and BMI-for-age were computed. The data obtained from WHO Anthro software were exported to MS Excel, and the outliers in the data were checked and removed. The WHO has recommended cut-off of ±5SD for removal of outliers. Median values of height and weight in Indian children were nearly −2SD while median value of BMI was just below -1 SD of the WHO standards17. In the present study for removing the outliers, the cut off of <−7 SD for weight-for-age (WAZ) and height/length-for-age (HAZ) and <−5SD for BMI-for-age (BAZ) was used. All values lying within the cut-off levels were taken for analysis. For assessment of nutritional status and classification into undernourished and not undernourished in the present study, MGRS standards were used. Prevalence rates for morbidity were calculated in undernourished (<−2SD of HAZ, WAZ and BAZ) and not undernourished (≥−2SD of HAZ, WAZ and BAZ) children.
Statistical analysis was done using Stata 12.0 (StataCorp LP, College Station, TX 77845, USA). In this mixed longitudinal study, children were followed up every fortnight. The average number of visits/child was 19. Data analysis was based on visits and not children. The children were reported to be ill in 10.3 per cent of visits.
In this study, the recording of the presence or absence of morbidity in the under-five child was based on the mother’s reporting. Based on this information, visits were classified into non-morbid and morbid visits. The visit just prior to the illness in which anthropometric data were available was classified as pre-morbid and the visit immediately after the illness in which anthropometric data were available was classified as post-morbid (Fig. 1).
In this study, the nutritional status of the child was related across visits; hence, generalized estimating equation (GEE) was used to account for correlations. The link was identity number of the child, distribution was Gaussian and correlation matrix was exchangeable.
The anthropometric data from the visit prior to the morbidity visits were used to assess the effect of nutritional status prior to morbidity on risk of morbidity; WAZ and BAZ prior to the morbid visit were parameters for assessing nutritional status and ‘morbidity/infection’ was ‘outcome’. Morbidity rates in undernourished and not undernourished children (WAZ or BAZ<−2SD for age vs. WAZ or BAZ ≥−2SD for age prior to episode of infection) and odds ratio (OR) for risk of infection in undernourished and not undernourished children were computed.
Confounders tested were mother’s literacy, father’s literacy, availability of toilet facilities, drinking water source and crowd index (number of rooms in the house/number of family members). The unadjusted and adjusted ORs for morbidity in relation to nutritional status were computed.
Z scores in the pre-morbid, morbid and post-morbid periods in the same child were taken, and the difference in the z scores between pre-morbid, morbid and post-morbid periods was computed. From these changes in the mean z score from ‘prior to’ (‘pre-morbid’), to ‘during’ (‘at morbid’) and ‘after’ (‘post-morbid’) the episode of morbidity, the effect of morbidity on nutritional status was computed.
The results were reported either as β (95% CI) or as OR (95% CI) as appropriate. P<0.05 was considered statistically significant.
Results
3888 pre-school children were enrolled (49.4% boys and 50.6% girls) between 2012 to 2015. The mean age of these children at the time of enrolment was 22.5±16.17 months. A total of 74636 fortnightly visits were made in these children with an average of 19.2 observations made per child (Table I).
| Number of children/visits | 2012 | 2013 | 2014 | 2015 | Total |
|---|---|---|---|---|---|
| Number of children enrolled | 912 | 1113 | 610 | 1253 | 3888 |
| Number of fortnightly visits | 10,628 | 23,137 | 19,973 | 20,898 | 74,636 |
| Number of visits with weight | 4469 | 12,827 | 11,609 | 13,374 | 42,279 |
| Number of visits with height | 1526 | 4277 | 3334 | 5751 | 14,888 |
Analysis of data on sociodemographic profile of the study households showed that majority were nuclear families (80.1%) with five or less members (75.3%). Majority of fathers (70.4%) and mothers (51.8%) had secondary school education. Majority of the fathers (74.6%) worked in white collar jobs; 20 per cent were semi-skilled workers. Over 90 per cent of mothers were homemakers. Over 95 per cent of households lived in brick and mortar buildings; 30.3 per cent owned their houses; the rest were mostly migrant labourers who lived as tenants in one- or two-room tenements. Over 95 per cent had access to piped water supply at home or in the near vicinity and access to flush toilets either in their own home or shared with other households. For cooking, almost all used liquefied petroleum gas (LPG) and stainless steel utensils. Over 98 per cent owned colour TV, which they stated was their main source of entertainment. The families stated that they belonged to the low- and middle-income group because the husbands had steady employment, families were food secure and family had the needed household possessions. However, because of urban housing constraints, they lived in one- or two-room tenements in overcrowded unhygienic localities.
The nutritional and morbidity profile of these children is shown in Table II. As compared to global data, undernutrition rates (<−2 SD according to the WHO MGRS standards) in these children were high (stunting 43.4%, underweight 31.9% and wasting 12%). Prevalence of severe undernutrition (<−3 SD according to WHO MGRS standards) was lower; stunting 16 per cent, underweight 9.4 per cent and wasting 3.5 per cent. The prevalence of undernutrition in the study children was comparable to the reported data from national surveys11-14.
| Nutritional status | ||||
|---|---|---|---|---|
| Variable | n | Mean±SD | Range | |
| HAZ | 38,582 | −1.79±1.25 | −7-2.97 | |
| WAZ | 42,196 | −1.47±1.17 | −6.98-2.98 | |
| BAZ | 38,450 | −0.47±1.34 | −4.99-4.98 | |
| Prevalence of undernutrition | ||||
| Category | n | <−2SD prevalence (%) | CI (95%) | <−3SD |
| Stunted | 38,582 | 43.4 | 42.9-43.9 | 16 |
| Underweight | 42,196 | 31.9 | 31.4-32.3 | 9.4 |
| Wasted | 38,450 | 12 | 11.7-12.3 | 3.5 |
| Prevalence of morbidity | ||||
| Morbidity | n | Prevalence | CI (95%) | |
| Prevalence of morbidity | 74,636 | 10.3 | 10.1-10.6 | |
Mean duration of infection 4.0±2.44 days, per cent who accessed healthcare 92.6%. BMI, body mass index; WAZ, z scores for weight-for-age; HAZ, z scores for height/length-for-age; BAZ, z scores for BMI-for-age; SD, standard deviation; CI, confidence interval
The prevalence of morbidity was 10.3 per cent. Among those who had an illness in the last fortnight, 98.5 per cent of children had one episode and 1.5 per cent had two episodes. The mean duration of morbidity was 4.0±2.44 days (duration less than three days 55.7%, 4-7 days 38.1% and greater than seven days 6.2%). Nearly 83 per cent of the illnesses were graded as mild and 15 per cent as moderate; severe illness was reported in only 2.3 per cent. Ninety three per cent of parents accessed healthcare; most went to physicians either in the government or in the private sector for care. Majority of parents accessed healthcare within three days after onset of symptoms.
The frequency distribution of WAZ and BAZ in visits during which the children were ill and visits during which children did not have illness is plotted in Figures 2 and 3, respectively. The frequency distribution of WAZ and BAZ during visits when the children had morbidity was marginally to the left of the WAZ and BAZ during visits when the children did not have morbidity.
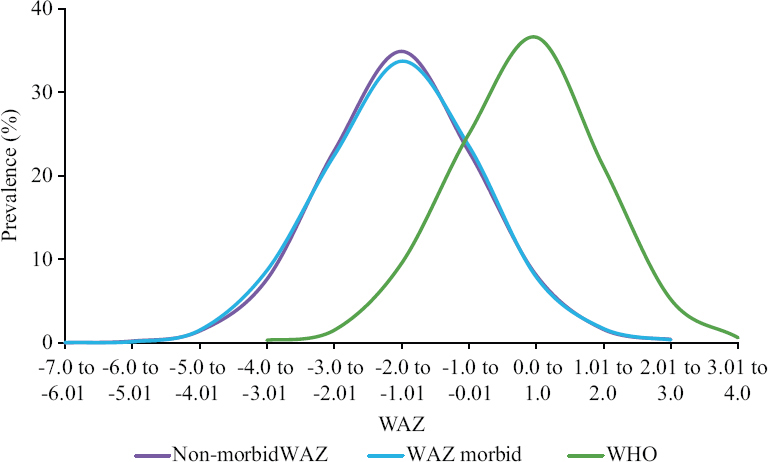
- Frequency distribution WAZ non-morbid and currently morbid. WAZ, z scores for weight-for-age.
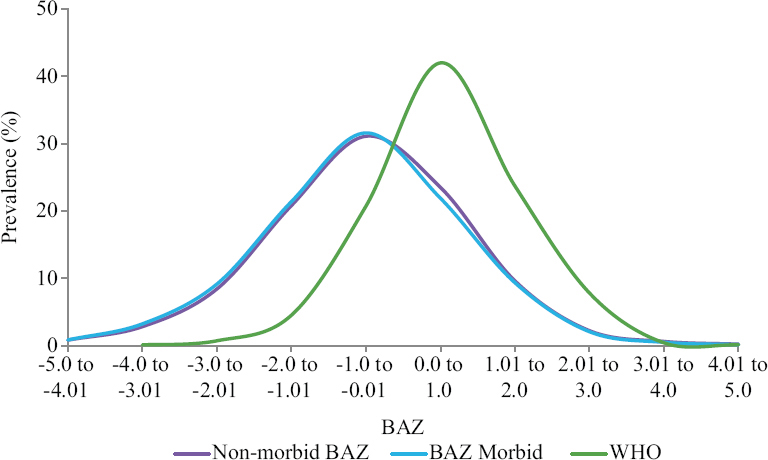
- Frequency distribution BAZ non-morbid and currently morbid. BAZ, z scores for BMI-for-age.
The mean WAZ and BAZ scores were lower in visits when children were ill as compared to visits when children did not have morbidity; the difference was found to be significant (P<0.001). The mean HAZ in morbid and non-morbid visits did not show any significant difference (Table III)16.
| Nutritional status | Total number of | Mean (95% CI) | Difference, mean (95% CI) | P | ||
|---|---|---|---|---|---|---|
| Children | Observations | Morbid | Non-morbid | |||
| HAZ | 3497 | 31,354 | −1.79 (−1.84-−1.76) | −1.81 (−1.85-−1.77) | 0.02 (−0.005-0.035) | 0.141 |
| WAZ | 3731 | 34,213 | −1.55 (−1.58-−1.51) | −1.46 (−1.49-−1.43) | −0.08 (−0.100-−0.060) | <0.001 |
| BAZ | 3488 | 31,252 | −0.59 (−0.63-−0.54) | −0.45 (−0.49-−0.42 | −0.14 (−0.150-−0.100) | <0.001 |
The OR (95% CI) for morbidity in children who were underweight and wasted vs. their non-undernourished counterparts was 1.09 (95% CI: 1.02 to 1.16) and 1.18 (CI: 1.08 to 1.29), respectively (Table IV). These data indicate that there was a small but significant increase in the risk of morbidity if the child was underweight (P=0.012) or wasted prior to morbidity (P<0.001).
| Nutritional status | Morbid, n (%) | Non-morbid, n (%) | OR (95% CI) | P |
|---|---|---|---|---|
| WAZ | ||||
| ≥−2SD | 4157 (17.9) | 19,068 (82.1) | 1.0 | 0.012 |
| <−2SD | 2025 (18.4) | 8963 (81.6) | 1.09 (1.02-1.16) | |
| BAZ | ||||
| ≥−2SD | 4832 (17.6) | 22,647 (82.4) | 1.0 | <0.001 |
| <−2SD | 733 (19.4) | 3040 (80.6) | 1.18 (1.08-1.29) |
OR, odds ratio
The comparison of frequency distribution of WAZ prior to and after the episode of morbidity is shown in Figure 4. There was deterioration in WAZ z scores from pre-morbid to at morbid as well as pre-morbid to post-morbid periods; these differences were significant (Table V).
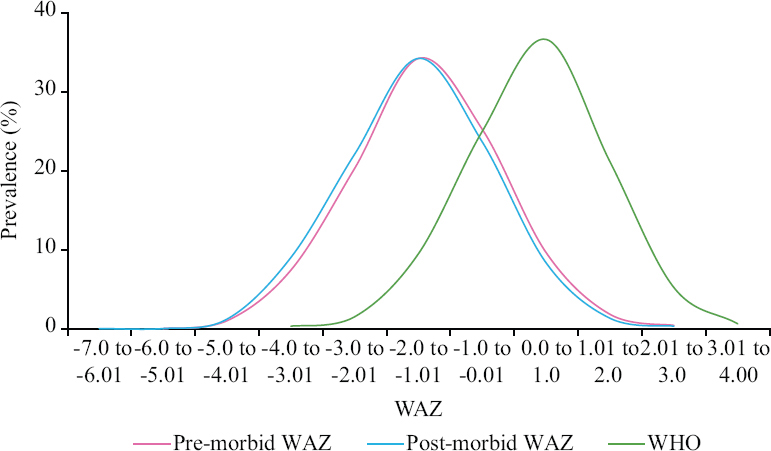
- Frequency distribution WAZ pre-morbid and post-morbid. WAZ, z scores for weight-for-age.
| Period | Mean (95% CI) | Period | Difference (95% CI) | P |
|---|---|---|---|---|
| Pre-morbid | −1.43 (−1.469-−1.382) | Pre-morbid-post-morbid | −0.082 (−1.017-−0.062) | <0.001 |
| At morbid | −1.53 (−1.572-−1.487) | Pre-morbid-at morbid | −0.104 (−0.125-−0.083) | <0.001 |
| Post-morbid | −1.51 (−1.550-−1.465) | At morbid and post-morbid | 0.022 (−0.038-−0.006) | <0.007 |
The comparison of frequency distribution of z scores for BMI-for-age prior to and after the episode of morbidity is shown in Figure 5. Irrespective of the prior nutritional status of the child, there was a shift to the left in the frequency distribution of WAZ and BAZ in the post-morbid period as compared to the pre-morbid period (Figs. 4 and 5). Z score for BAZ showed deterioration from pre-morbid to at morbid and pre-morbid to post-morbid periods; these differences were found to be significant (Table VI). However, the deterioration in mean BAZ from at morbid to post-morbid was not significant.
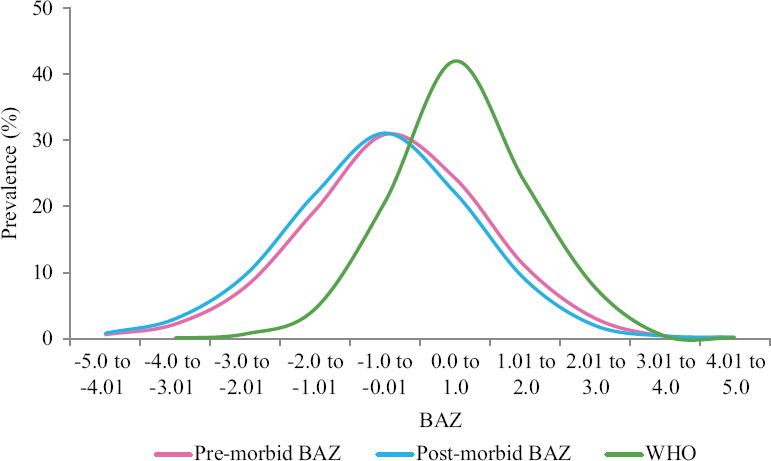
- Frequency distribution BAZ pre-morbid and post-morbid. BAZ, z scores for BMI-for-age.
| Period | Mean (95% CI) | Period | Difference (95% CI) | P |
|---|---|---|---|---|
| Pre-morbid | −0.42 (−0.473-−0.370) | Pre-morbid-post-morbid | −0.131 (−0.160-−0.101) | <0.001 |
| At morbid | −0.57 (−0.617-−0.520) | Pre-morbid-at morbid | −0.147 (−0.178-−0.116) | <0.001 |
| Post-morbid | −0.55 (−0.601-−0.503) | At morbid and post-morbid | −0.165 (−0.040-−0.007) | 0.175 |
Discussion
In India during the 1960s and 1970s, poverty, household food insecurity and undernutrition in pre-school children were widespread; under-five morbidity and mortality rates were high1. Undernutrition predisposing to infection and infections aggravating undernutrition was a vicious cycle well recognized by clinicians and public health professionals. The country initiated multisectoral intervention programmes to combat these problems10. In the last two decades, the country has been undergoing relatively rapid socioeconomic, demographic, nutrition and health transitions. The reported poverty headcount ratio in 2012 was 16.9 per cent in urban India and 10 per cent in Delhi18. India achieved the millennium development goal (MDG) target for poverty reduction by 201219. There has been a substantial improvement in household food security, sustained reduction in the prevalence of undernutrition, substantial improvement in access to healthcare and reduction in under-five mortality10,19,20,. It is possible that these changes might have brought about alterations in the earlier reported adverse nutrition-infection interactions. Analysis of data from NFHS-3 showed that the association between undernutrition (<−2SD WAZ and BAZ WHO MGRS standards) and increased risk of morbidity was small though significant15. Analysis based on cross-sectional data from national surveys cannot provide answers to the question whether undernutrition increases the risk of acute infections and whether acute morbidity aggravates undernutrition. The present study in under-five children from urban low- and middle-income group families was undertaken to answer these questions.
In these low- and middle-income families, household income was adequate to purchase essential food items needed and ensure household food security. However, the families lived in crowded one- or two-room tenements in areas with poor environmental hygiene. The relatively high morbidity rates might be attributable to the overcrowding and poor environmental hygiene. Undernutrition rates in the study children (stunting 43.4%, underweight 31.9% and wasting 12%) were comparable to the undernutrition rates in Delhi reported in the national surveys11-14. The prevalence of morbidity due to infections was comparable to national surveys11-14 and earlier studies in the area (unpublished data).
There was a small but statistically significant increase in the risk of morbidity if the child was underweight (<−2SD weight-or-age) prior to the episode of morbidity. The risk was marginally higher in children with <−2SD BMI-for-age, suggesting that current energy deficiency may be the factor predisposing to morbidity due to infections (Table IV).
Studies in the 1970s and 1980s documented that underweight children were at a higher risk of infection; currently, the risk of infection in undernourished children is small. Future research studies may investigate two hypotheses. One hypothesis is that in the presence of overwhelming adverse environmental problems many of which are associated with high morbidity rates, even normal children get ill and so the relative risk of infection in undernourished children is low. The second hypothesis is that underweight children are not a homogenous group. There may be two further sub-sets: (i) those born small and growing according to their trajectory and not having any functional decompensation, and (ii) Those born normal and growing along normal trajectory but had growth faltering, became undernourished, have immune depression and are at higher risk of infection.
It has been well documented that despite high low-birth weight rates and high under-five undernutrition rates, under-five mortality rates in Indian children are relatively low (South Asian Enigma)21 suggesting that not all small Indian under-five children have functional decompensation. Studies to assess the extent of the functional decompensation (such as immune depression) in low birth weight infants growing along lower growth trajectory vis-a-vis normal birth weight children who had become undernourished in early childhood are required to explore this possibility.
In this study, the effect of morbidity on nutritional status of children was assessed by comparing the weight-for-age and BMI-for-age Z scores prior to, during and after morbidity. There was a small but significant deterioration in Z scores for weight and BMI during illness and during convalescence irrespective of prior nutritional status (Figs 4 and 5, Tables V and VI). When children fall ill, their food intake gets reduced; nutrient absorption may be reduced; nutrient loss may be high due to fever or infection per se. As a result, there was some deterioration in nutritional status, irrespective of the nutritional status of the child.
Mothers of all under-five children in the study were given the MCPC. Majority of parents were literate and read the messages on health and nutrition care during illness given in the MCPC which were reiterated by the research team during the home visits. In addition, these families received nutrition and health education messages through all media of communication. As and when the research teams found that the child was ill, they counselled the family about the importance of accessing healthcare and nutrition support during illness. Health services were available in the vicinity and affordable. Majority (92.6%) of the educated urban low- and middle-income parents, therefore, accessed healthcare within three days after illness. As a result, most illnesses were mild or moderate and the duration of illness was relatively short22. Utilization of available healthcare within three days after illness might have played a role in limiting the duration, severity of illness and deterioration in nutritional status during illness and convalescence.
These children were from food-secure families with no economic constraints in young child feeding. The parents received nutrition education on the need for ensuring adequate and appropriate food intake during illness and convalescence. Therefore, lack of food at home and lack of knowledge of parents were not the barriers for appropriate feeding during illness and convalescence. Despite these advantages, children irrespective of their nutritional status prior to morbidity lost weight during illness and convalescence (Fig. 4). However, the magnitude of deterioration was small. In these nuclear families, time was a major constraint; the mothers often could not spend enough time with the fretful children with low appetite, coaxing them to eat. This might be one of the reasons for the deterioration in nutritional status. When children recovered from illness and regained their appetite they ate normally; in subsequent follow up, many of these children had regained the pre-morbid trajectory of growth.
Clinical and public health implications: Results from the present study have some important implications for clinical care and organization of public health interventions aimed to improve the health and nutritional status of pre-school children. Data from the study showed that moderate undernutrition is not a major factor responsible for the high prevalence of morbidity. Therefore, interventions to reduce moderate undernutrition may not result in substantial reduction in morbidity due to infection. Interventions to improve environmental sanitation, access to safe drinking water, reduction in environmental pollution and overcrowding at home and locality may be required to bring about a decline in the overall prevalence of morbidity due to infections.
Access to nutrition, health services and healthcare for treating morbidity due to infections in pre-school children are available in urban areas across the country and in peninsular India. This might be at least in part responsible for the better nutrition and health status of under-five children in these areas. Improving access to and utilization of health and nutritional services in the populous northern and eastern states may bring about substantial improvement in the health and nutritional status of pre-school children in these states.
This study had some limitations; it was carried out in children from urban low- and middle-income families who were food secure, had access to health and nutrition education and utilized health services as and when a child fell ill. Hence, these findings may not be applicable to situations where families were food insecure and had poor access to healthcare.
This large-scale longitudinal study provided vital information on:
(i) Impact of moderate undernutrition (<−2SD of the WHO MGRS standards for weight-for-age and BMI-for-age) on prevalence of morbidity in children and
(ii) Effect of morbidity on nutritional status of children by comparing the WAZ and BAZ before, during and after morbidity in the same child.
Financial support and sponsorship
The study was funded by the intramural grant (grant no. NFI/IM/2012) from Nutrition Foundation of India.
Conflicts of interest
None.
References
- Nutrition transition in India: Challenges in achieving global targets. Proc Indian Natn Sci Acad. 2018;84:821-33.
- [Google Scholar]
- Interactions of nutrition and infection. Available from:http://www.who.int/iris/handle/10665/41782
- Synergism of nutrition, infection, and immunity: An overview. Am J Clin Nutr. 1997;66:464S-77S.
- [Google Scholar]
- Functional significance of growth retardation in malnutrition. Am J Clin Nutr. 1976;29:3-7.
- [Google Scholar]
- Cell mediated immunity in protein-calorie malnutrition. J Trop Pediatr Environ Child Health. 1974;20:284-6.
- [Google Scholar]
- Macrophage function in severe protein energy malnutrition. Indian J Med Res. 1980;71:247-50.
- [Google Scholar]
- The children of Santa María Cauqué: A prospective field study of health and growth. 28 Carleton Street, Cambridge, MA 02142, USA: The MIT Press; 1978.
- Nutrition transition in India. Available from:http//www.wcd.nic.in/Schemes/research/nti1947/COVER%20PAGE.pdf
- 2015. National Family Health Survey (NFHS-4). Available from:http//www.rchiips.org/NFHS/factsheet_NFHS-4.shtm
- Undernutrition &risk of infections in preschool children. Indian J Med Res. 2009;130:579-83.
- [Google Scholar]
- Applied longitudinal data analysis for epidemiology: A practical guide. Cambridge: Cambridge University Press; 2013.
- Assessment of nutritional status in Indian preschool children using WHO 2006 growth standards. Indian J Med Res. 2011;134:47-53.
- [Google Scholar]
- 2013. Report of the expert group to review the methodology for measurement of poverty. Available from:http://planningcommission.nic.in/news/pre_pov2307.pdf
- Ministry of Statistics and Programme Implementation, Government of India. Millennium development goals – Final country report of India. Available from: http://www.mospi.gov.in/sites/default/files/publication_reports/MDG_Final_Country_report_of_India_27nov17.pdf
- Commentary: The Asian enigma. Available from:https://www.unicef.org/pon96/nuenigma.htm
- Morbidity due to infections in preschool children from urban low income households. Indian J Nutr Diet. 2018;55:488-99.
- [Google Scholar]


