
Translate this page into:
Indian food habit & food ingredients may have a role in lowering the severity & high death rate from COVID-19 in Indians: findings from the first nutrigenomic analysis
For correspondence: Dr Debmalya Barh, Institute of Integrative Omics & Applied Biotechnology, Nonakuri, Purba Medinipur 721 172, West Bengal, India e-mail: dr.barh@gmail.com
-
Received: ,
This article was originally published by Wolters Kluwer - Medknow and was migrated to Scientific Scholar after the change of Publisher.
Abstract
Background & objectives:
During the COVID-19 pandemic, the death rate was reportedly 5-8 fold lower in India which is densely populated as compared to less populated western countries. The aim of this study was to investigate whether dietary habits were associated with the variations in COVID-19 severity and deaths between western and Indian population at the nutrigenomics level.
Methods:
In this study nutrigenomics approach was applied. Blood transcriptome of severe COVID-19 patients from three western countries (showing high fatality) and two datasets from Indian patients were used. Gene set enrichment analyses were performed for pathways, metabolites, nutrients, etc., and compared for western and Indian samples to identify the food- and nutrient-related factors, which may be associated with COVID-19 severity. Data on the daily consumption of twelve key food components across four countries were collected and a correlation between nutrigenomics analyses and per capita daily dietary intake was investigated.
Results:
Distinct dietary habits of Indians were observed, which may be associated with low death rate from COVID-19. Increased consumption of red meat, dairy products and processed foods by western populations may increase the severity and death rate by activating cytokine storm-related pathways, intussusceptive angiogenesis, hypercapnia and enhancing blood glucose levels due to high contents of sphingolipids, palmitic acid and byproducts such as CO2 and lipopolysaccharide (LPS). Palmitic acid also induces ACE2 expression and increases the infection rate. Coffee and alcohol that are highly consumed in western countries may increase the severity and death rates from COVID-19 by deregulating blood iron, zinc and triglyceride levels. The components of Indian diets maintain high iron and zinc concentrations in blood and rich fibre in their foods may prevent CO2 and LPS-mediated COVID-19 severity. Regular consumption of tea by Indians maintains high high-density lipoprotein (HDL) and low triglyceride in blood as catechins in tea act as natural atorvastatin. Importantly, regular consumption of turmeric in daily food by Indians maintains strong immunity and curcumin in turmeric may prevent pathways and mechanisms associated with SARS-CoV-2 infection and COVID-19 severity and lowered the death rate.
Interpretation & conclusions:
Our results suggest that Indian food components suppress cytokine storm and various other severity related pathways of COVID-19 and may have a role in lowering severity and death rates from COVID-19 in India as compared to western populations. However, large multi-centered case−control studies are required to support our current findings.
Keywords
Caffeine
COVID-19
death rate
diet
iron
palmitic acid
severity
sphingolipid
tea
transcriptome
turmeric
zinc

Variation in the rate of deaths due to COVID-19 has been detected in different countries (https://covid19.who.int/table; accessed on May 30, 2022). Since COVID-19 is an infectious disease, presumably more cases and higher death rates should be found in densely populated countries. The population density varies between 36/km² to 92/km² in the USA, Spain and Greece, whereas, in India, it is 428/km2 (https//www.worldpopulationreview.com; accessed on May 18, 2022). Therefore, in principle, India should have had a higher number of COVID-19 cases and deaths. However, in reality, these western countries have shown five to eight times higher death rates compared to India (https://covid19.who.int/table; accessed on May 30, 2022). Therefore, identifying factors that could explain such differences remain important.
Existing comorbid conditions and their risk related to COVID-19 severity and death have been well established1. Host genetic polymorphisms are also associated with severe symptoms and deaths from COVID-192. Plant-based foods, pescatarian and Mediterranean diets and low consumption of red and processed meat have been shown to lower the susceptibility to moderate-to-severe COVID-19 disease3,4. Reported diets supplemented with vitamins and zinc may reduce COVID-19 severity5. On the other hand, higher consumption of a western diet was found to be associated with increased COVID-19 risk and severity4,6.
Gene expression profiles of SARS-CoV-2-infected individuals have been used to identify susceptibility, symptoms, severity, disease pathways and drugs for COVID-19 patients7-10. In this study, we aimed to identify specific foods, diets, metabolites or nutrients associated with the observed differences in severity and death rates due to COVID-19 in the western and Indian populations using available transcriptome data and nutrigenome approaches.
Material &Methods
Selection of datasets: RNA sequencing (RNA-Seq) data from COVID-19 patients’ blood were obtained from public domain through Gene Expression Omnibus (GEO; https://www.ncbi.nlm.nih.gov/geo/) and PubMed (https://pubmed.ncbi.nlm.nih.gov) databases and were grouped into two categories based on the country-specific death rates (death/100,000 people) from COVID-19. The USA, Greece and Spain were the selected countries with high death rates representing western samples, whereas data from India was used for a country with a low COVID-19 death rate. For the USA, 29 severe COVID-19 samples and nine healthy controls were collected from Bioproject: PRJNA6344897 and GSE18999011. For Greece, the GSE152641 dataset of 62 cases and 24 controls were included12, and for Spain, the GSE180594 dataset (18 cases and 7 controls)13 was used. Two datasets were chosen for India; the south Indian (Karnataka) dataset (GSE196822) of 49 expression profiles of four distinct COVID-19 conditions including asymptomatic (n=8), mild (n=9), moderate (n=10), severe (n=7) and control (n=9) and the north Indian (Haryana) dataset (GSE181439) had asymptomatic (n=9) and severe (n=9) cases.
Obtaining differentially expressed genes (DEGs) from RNA-Seq data: The GO2R tool (https://www.ncbi.nlm.nih.gov/geo/geo2r; accessed on May 16, 2022) was used for differentially expressed gene (DEG) profiles of cases vs. control for GSE180594 and for the south Indian dataset GSE196822. The Limma-Voom package version 4.2 (Bioconductor, Victoria, Australia) was used in R Studio14 to analyze asymptomatic vs. control, mild vs. control, moderate vs. control and severe vs. control. Other DEGs were obtained from the corresponding publications7,11,12,15. In all cases, the fold change (Log2) >1 was considered upregulated and <1 was considered downregulated at adjusted P<0.05.
DEG analysis for metabolites and pathways: A modified method of our previously established DEG analysis using only the upregulated gene sets was applied which gave us >90 per cent accuracy8-10. DEGs of each country sample were separately analyzed using Enrichr (release March 29, 2021; New York, USA)16. However, two USA samples and two Indian datasets were clubbed to make combined USA and Indian samples, respectively. Since for the other countries, only one sample was used, the two Indian samples were combined to make one combined sample for India and the two USA samples were combined to make one combined USA samples for our analysis. All western country samples were also combined for an integrated and comparative analysis with the combined Indian samples. Some analyses with the downregulated genes were also considered to cross verify the reliability of data sets. For example, while using the ‘COVID-19 Related Gene Sets 2021’ database in the Enrichr for upregulated gene sets, it required first to be enriched by giving n number of genes upregulated by SARS-CoV-2 infection. In our cross verification of data set reliability, it was found that all these DEGs were associated with SARS-CoV-2 infection and influenza. Therefore, we proceeded with our DEGs for further analysis.
In Enrichr, the ‘COVID-19 Related Gene Sets 2021’ database was first used to validate if our applied gene set was up or downregulated in COVID-19. In addition, ‘Disease perturbations from GEO up’ and ‘Disease perturbations from GEO down’ were also used to cross-verify the reliability of datasets. In the second step, the human metabolites database (HMDB) was used to identify the metabolites associated with the given gene set. Three pathway databases, WikiPathway 2021 Human, KEGG 2021 Human, and Reactome 2016 were used to identify pathways commonly enriched by at least two databases to interpret our results. The ‘Drug perturbations from GEO up’ and ‘Drug perturbations from GEO down’ databases were also used to correlate the results with identified pathways. In all enrichment analyses, top 10 enrichment results were only considered for interpretation.
Nutrigenomics analysis of DEG: NutriGenomeDB (release November 21, 2021; Madrid, Spain)17 and its phenotype-centered analysis was used for nutrigenomics analysis and selected Homo sapiens as organism. Each dataset was analyzed individually and in combination with complete DEGs (up + downregulated genes). Only the blood based gene expression signatures of different foods, nutrients and bioactive compounds from this database were considered. Furthermore, net enrichment score (NES) were used to predict the final results as NES typically gives better accuracy compared to the number of overlapping gene (NOS) calculations.
Analyses of western and Indian foods and diet: Data and literature mining approaches were used to understand the food consumption among western and Indian populations. Furthermore, various databases and corporate reports were used to understand the differences between dietary habits in the western and Indian populations (Supplementary Table I).
| Country | Dietary intakes of key foods and nutrients in adults aged 20 yr, national data, per capita g/day | Per capita g/day, for alcohol ml/day | Population de Population def |
Death from COVID-19/100,000 people Death rateg |
||||||||||
|---|---|---|---|---|---|---|---|---|---|---|---|---|---|---|
| Fruita | Vegetablea | Legumea | Nutsa | Whole grainsa | Fisha | Dairya | Red meata | Turmericb | Teac | Coffeed | Alcohole | |||
| Greece | 77 | 91.3 | 13.9 | 7.4 | 34.3 | 30.6 | 530.1 | 78.5 | 0 | 0.06 | 10.41 | 28.51 | 78 | 278.28 |
| USA | 86.8 | 128.6 | 19.5 | 11.5 | 19.6 | 11.2 | 513 | 35.7 | 0.02 | 0.41 | 12.3 | 25.75 | 36 | 300.94 |
| Spain | 64.3 | 103.4 | 21 | 8.4 | 22 | 66 | 732.7 | 56.9 | 0 | 0.63 | 11.12 | 27.4 | 92 | 224.67 |
| India | 35.8 | 167.8 | 24.9 | 3.2 | 121.8 | 9.6 | 107.8 | 3.5 | 2.5 | 1.2 | 0.03 | 15.61 | 428 | 38.02 |
| a | https://globalnutritionreport.org/resources/nutrition-profiles/, accessed on May 30, 2022 | |||||||||||||
| b | https://www.statista.com/statistics/798717/india-turmeric-consumption-share-by-region/, accessed on 30 May, 2022 | |||||||||||||
| b | https://oec.world/en/profile/hs/turmeric-curcuma, accessed on May 30, 2022 Daily intake of turmeric/curcumin in India is very high (>2 g/day) (PMID: 21338207, NBK92752) | |||||||||||||
| c | https://www.statista.com/statistics/507950/global-per-capita-tea-consumption-by-country/, ccessed on May 30, 2022 | |||||||||||||
| d | https://www.helgilibrary.com/indicators/coffee-consumption-per-capita/, accessed on May 30, 2022 | |||||||||||||
| e | https://apps.who.int/iris/bitstream/handle/10665/274603/9789241565639-eng.pdf (Accessed on May 30, 2022 | |||||||||||||
| f | https://worldpopulationreview.com/, accessed on May 30, 2022 | |||||||||||||
| g | https://covid19.who.int/table, accessed on May 30, 2022 | |||||||||||||
A flow diagram of overall study design is given in Figure 1.
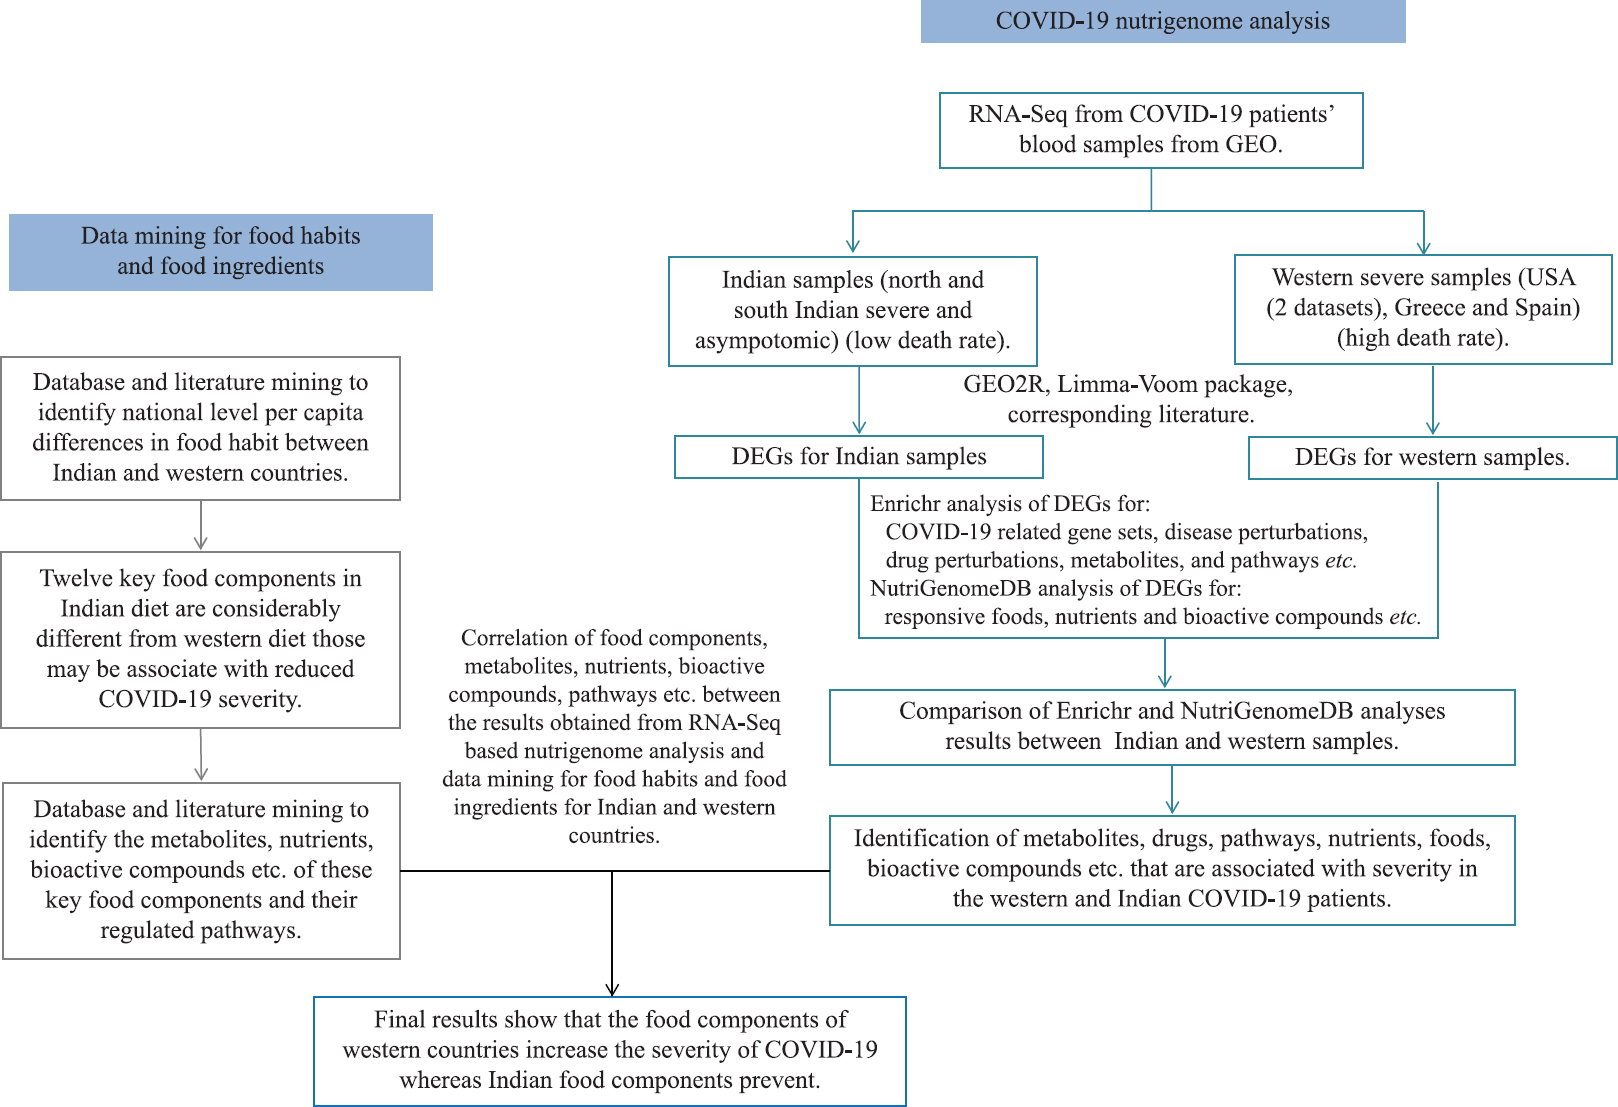
- Schematic flow chart of overall methodology or study design.
Results
Differences between Indian and western dietary intakes: Twelve key food components were found in the Indian diet, which were considerably different from that in the western populations (Supplementary Table I). At the national level (mean intake per capita, g/day), western populations consumed 10-25 times more red meat, 8-12 times more processed foods, 5-7 times more dairy products, 3-8 times more fish, 10-12 times more coffee and two times more alcohol than Indians. On the other hand, Indians used 1.5 times more legumes and vegetables and four times more whole grains than western populations. Most importantly, while western populations used nil or negligible amounts of tea and turmeric, Indians consumed an average 1.2 and 2.5 g tea and turmeric per person per day, respectively (Table I and
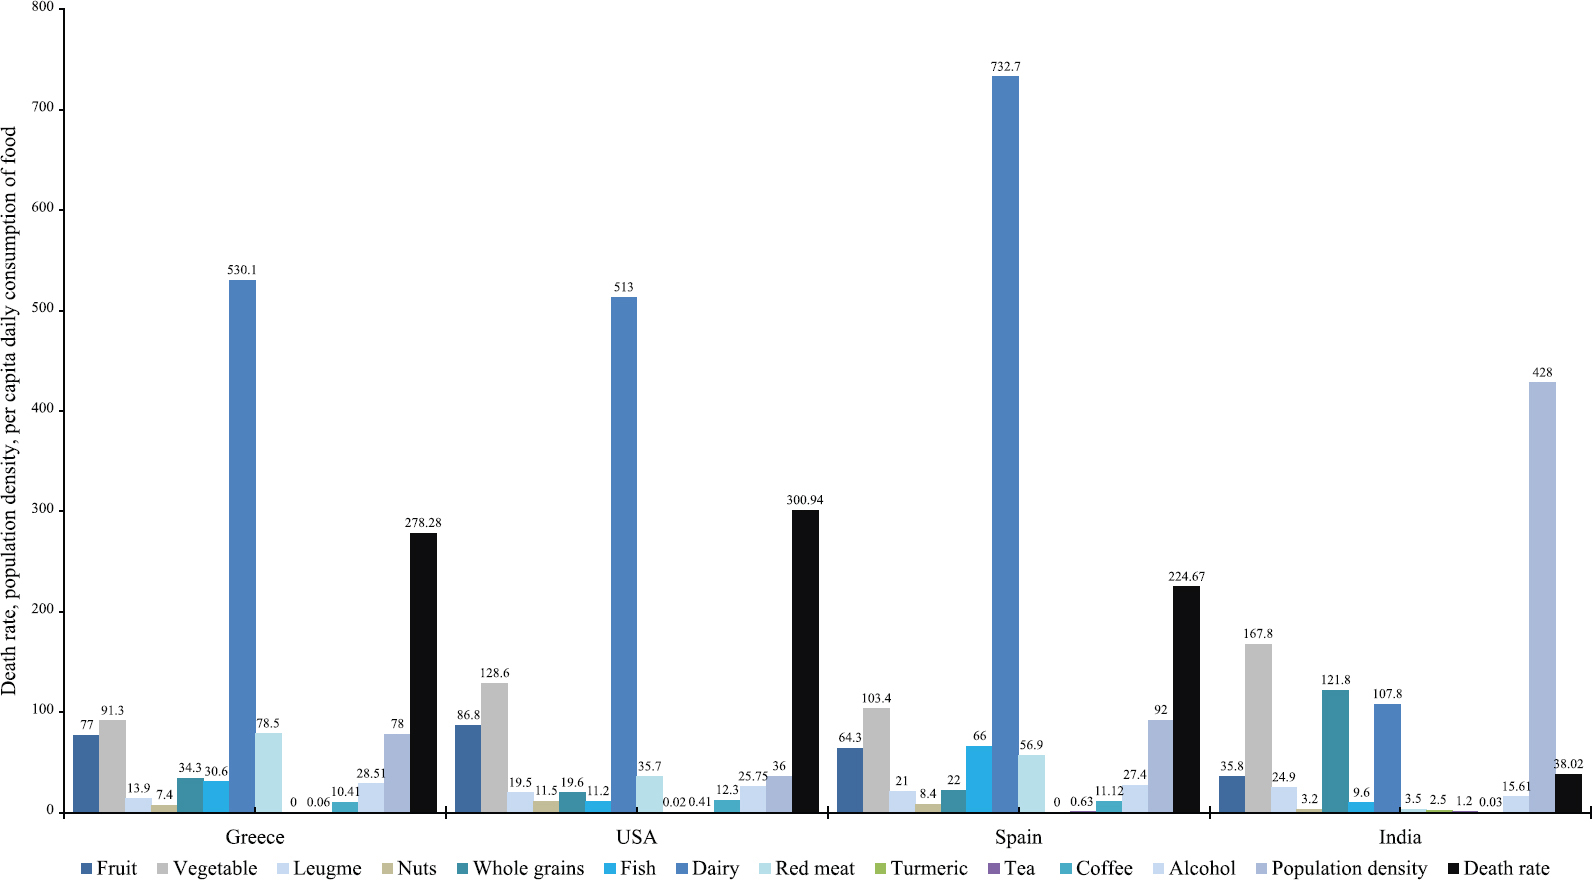
- Dietary habits in Indian and western populations. Per capita daily consumption of 12 key foods and nutrients (variables) along with the population density and death rates (person/100,000) in India and three western countries (Also shown in Supplementary Table 1).
Cytokine storm and complement related pathways are upregulated in western and Indian severe COVID-19 samples, respectively: Two pathway databases showed upregulation of interferon (IFN) (type I and II), tumour necrosis factor (TNF), cytokine, chemokine and NOD-like receptor signalling pathways in severe COVID-19 patients from Spain and Greece (Supplementary Table IIE and G). The USA samples displayed over expression of the VEGFA-VEGFR2 signaling pathway (Supplementary Table IIF). The up regulated DEG of combined western populations was associated with IFN, TNF, cytokine, chemokine, VEGFA-VEGFR2 and NOD-like receptor signalling pathways (Supplementary Table IIH). The upregulated genes of combined western countries were also associated with lipopolysaccharide (LPS) and IFN-beta responses (Supplementary Table IIE-H). In contrast, the cell cycle and vitamin D metabolism related pathways were over represented in north Indian severe and south Indian asymptomatic cases (Supplementary Table IIA and C). South Indian severe COVID-19 samples showed upregulation of complement and coagulation cascades (Supplementary Table IIB). The combined Indian severe cases showed similar results to those found for cases from south India (Supplementary Table IIB and D).
| Up-regulated genes | Down-regulated genes | ||||||||||
|---|---|---|---|---|---|---|---|---|---|---|---|
| Index | Name | P | Adjusted P | OR | Combined score | Index | Name | P | Adjusted P | OR | Combined score |
| COVID-19 Related Gene Sets 2021 | COVID-19 Related Gene Sets 2021 | ||||||||||
| 1 | COVID-19 patients PBMC up | 7.57E-38 | 3.35E-35 | 8.89 | 760.03 | 1 | COVID-19 patients PBMC down | 3.00E-33 | 1.26E-30 | 11.92 | 892.72 |
| 2 | Top 500 up genes for SARS-CoV-2 infection in Rhesus macaqu | 1.16E-35 | 2.56E-33 | 8.98 | 721.99 | 2 | SARS perturbation; 220 Down Genes from GEN3VA; Hu | 7.36E-17 | 1.55E-14 | 6.51 | 242.02 |
| 3 | 500 genes up-regulated by SARS-CoV-2 in human lung cells fr | 3.31E-28 | 4.88E-26 | 7.36 | 465.81 | 3 | Top 500 down genes for SARS-CoV-2 infection in Rhesu | 1.49E-16 | 2.10E-14 | 4.29 | 156.42 |
| 4 | Top 500 up genes for SARS-CoV-2 infection in Rhesus macaqu | 4.38E-27 | 4.84E-25 | 7.42 | 450.49 | 4 | Top 500 down genes for SARS-CoV-2 infection in Rhesu | 1.11E-12 | 1.17E-10 | 3.72 | 102.45 |
| 5 | 500 genes upregulated by SARS-CoV-2 in human lung tissue f | 4.51E-26 | 3.32E-24 | 7.2 | 420.01 | 5 | Top 500 up genes for SARS-CoV-2 infection in Rhesus m | 1.83E-12 | 1.55E-10 | 3.55 | 95.93 |
| 6 | Healthy human lung biopsy versus COVID-19-infected human lung | 4.51E-26 | 3.32E-24 | 7.2 | 420.01 | 6 | Top 500 up genes for SARS-CoV-2 infection in Rhesus m | 9.49E-12 | 6.68E-10 | 3.42 | 86.86 |
| 7 | Top 500 up genes for SARS-CoV-2 infection in Rhesus macaque | 2.68E-24 | 1.69E-22 | 6.99 | 379.62 | 7 | Top 500 up genes for SARS-CoV-2 infection in Rhesus m | 6.36E-10 | 3.84E-08 | 3.15 | 66.79 |
| 8 | Top 500 upregulated genes for SARS-CoV-2 infection in human | 6.90E-23 | 3.81E-21 | 6.46 | 329.42 | 8 | Top 500 up genes from control versus Ad5-hACE2 for SARS- | 3.08E-08 | 1.625E-06 | 3.09 | 53.45 |
| 9 | SARS Perturbation 430 Up Genes from GEN3VA Mouse Lung | 6.65E-22 | 3.27E-20 | 6.86 | 334.5 | 9 | Top 500 up genes for SARS-CoV-2 early infection in hum | 5.32E-07 | 0.00002495 | 2.6 | 37.55 |
| 10 | SARS perturbation; 280 Up Genes from GEN3VA; Human PBM | 8.91E-22 | 3.94E-20 | 8.7 | 421.92 | 10 | Top 500 up genes for SARS-CoV-2 infection in Rhesus m | 8.25E-07 | 0.00003483 | 2.62 | 36.73 |
| HMDB (human metabolome database) metabolites | |||||||||||
| 1 | Iron (HMDB00692) | 0.000211 | 0.2749 | 3.48 | 29.43 | 1 | Ubiquinol 8 (HMDB01060) | 2.09E-07 | 0.0007313 | 25.95 | 399.09 |
| 2 | Sodium (HMDB00588) | 0.00255 | 0.2749 | 2.88 | 17.2 | 2 | Ubiquinone Q1 (HMDB02012) | 0.00381 | 0.3541 | 3.83 | 21.36 |
| 3 | Ammonia (HMDB00051) | 0.006083 | 0.2749 | 4.66 | 23.77 | 3 | Sulfide (HMDB00598) | 0.02993 | 0.3541 | 3.07 | 10.78 |
| 4 | C34H34N4O4.Fe (HMDB03178) | 0.009033 | 0.2749 | 2.68 | 12.64 | 4 | A3P (HMDB00061) | 0.03442 | 0.3541 | 4.65 | 15.67 |
| 5 | C10H13N2O7P (HMDB01570) | 0.02097 | 0.2749 | 10.51 | 40.61 | 5 | QH2 (HMDB01304) | 0.04188 | 0.3541 | 2.78 | 8.83 |
| 6 | L-Carnitine (HMDB00062) | 0.02482 | 0.2749 | 9.46 | 34.95 | 6 | Coenzyme Q (HMDB06709) | 0.04456 | 0.3541 | 2.73 | 8.49 |
| 7 | Folic acid (HMDB00121) | 0.02482 | 0.2749 | 9.46 | 34.95 | 7 | Flavin Mononucleotide (HMDB01520) | 0.05798 | 0.3541 | 3.68 | 10.48 |
| 8 | Riboflavin (HMDB00244) | 0.02482 | 0.2749 | 9.46 | 34.95 | 8 | PPS (HMDB01134) | 0.06906 | 0.3541 | 3.4 | 9.08 |
| 9 | D-Mannose (HMDB00169) | 0.02893 | 0.2749 | 8.6 | 30.45 | 9 | DG (14:0/14:0/0:0) (HMDB07008) | 0.08197 | 0.3541 | 2.56 | 6.41 |
| 10 | TMP (HMDB01227) | 0.02893 | 0.2749 | 8.6 | 30.45 | 10 | DG (14:0/14:1 (9Z)/0:0) (HMDB07009) | 0.08197 | 0.3541 | 2.56 | 6.41 |
| Disease perturbations from GEO up | Disease perturbations from GEO down | ||||||||||
| 1 | H1N1 DOID-0050211 human GSE27131 sample 514 | 2.33E-98 | 1.95E-95 | 23.96 | 5386.87 | 1 | H1N1 DOID-0050211 human GSE27131 sample 514 | 4.82E-69 | 3.92E-66 | 27.2 | 4278.41 |
| 2 | Septic shock C0036983 human GSE9692 sample 307 | 2.80E-75 | 1.17E-72 | 16.41 | 2816.19 | 2 | sJIA DOID-848 hu | 1.39E-36 | 5.66E-34 | 11.1 | 916.33 |
| 3 | sJIA DOID-848 human | 8.04E-46 | 2.25E-43 | 12.87 | 1336.25 | 3 | Acute myeloid leukaemia DOID-9119 human GSE9476 sa | 2.86E-26 | 7.78E-24 | 5.8 | 341.3 |
| 4 | Sickle-cell anaemia DOID-10923 human GSE16728 sample 505 | 3.97E-36 | 8.31E-34 | 9.57 | 780.39 | 4 | Multiple sclerosis DOID-2377 human GSE23832 sample | 3.07E-23 | 6.25E-21 | 7.18 | 372.18 |
| 5 | Sickle-cell anaemia DOID-10923 human GSE16728 sample 506 | 7.65E-33 | 1.28E-30 | 8.62 | 637.43 | 5 | Schizophrenia DOID-5419 human GSE27383 sample 54 | 2.41E-19 | 3.93E-17 | 5.89 | 252.43 |
| 6 | Dengue disease DOID-12205 human GSE51808 sample 556 | 1.03E-29 | 1.43E-27 | 8.95 | 597.51 | 6 | Schizophrenia DOID-5419 human GSE27383 sample 54 | 5.70E-19 | 7.75E-17 | 5.61 | 235.76 |
| 7 | SARS C1175175 human | 7.34E-24 | 8.78E-22 | 11.57 | 616.54 | 7 | sJIA (subgroup-ex | 3.36E-18 | 3.91E-16 | 6.38 | 256.76 |
| 8 | Autism-spectrum disorder DOID-0060041 human GSE25507 s | 7.43E-23 | 7.79E-21 | 8.18 | 417.05 | 8 | Septic shock C0036983 human GSE9692 sample 307 | 5.97E-16 | 5.55E-14 | 9.89 | 346.66 |
| 9 | Monoclonal gammopathy of uncertain significance DOID-744 | 8.90E-23 | 8.29E-21 | 8.41 | 427.1 | 9 | Sarcoidosis DOID-11335 human GSE19314 sample 708 | 6.13E-16 | 5.55E-14 | 5 | 175.04 |
| 10 | Dengue haemorrhagic fever DOID-12206 human GSE51808 sa | 1.83E-22 | 1.53E-20 | 7.3 | 365.33 | 10 | Ankylosing Spondylitides C0038013 human GSE11886 s | 1.47E-11 | 1.15E-09 | 4.05 | 100.98 |
| WikiPathway (WP) 2021 human | |||||||||||
| 1 | Retinoblastoma gene in cancer WP2446 | 3.10E-09 | 0.000001018 | 9.31 | 182.35 | 1 | TCR signalling pathway WP69 | 1.10E-12 | 3.15E-10 | 9.19 | 253.12 |
| 2 | Vitamin D Receptor Pathway WP2877 | 0.00002883 | 0.004293 | 4.02 | 42.08 | 2 | Modulators of TCR signalling and T-cell activation WP50 | 8.23E-11 | 1.17E-08 | 10.67 | 247.76 |
| 3 | Cell cycle WP179 | 0.00004208 | 0.004293 | 4.85 | 48.9 | 3 | Pathogenesis of SARS-CoV-2Mediated by nsp9-nsp10 C | 3.58E-10 | 3.40E-08 | 27.08 | 588.92 |
| 4 | G1 to S cell cycle control WP45 | 0.00005235 | 0.004293 | 6.84 | 67.4 | 4 | TCR and Co-stimulatory Signalling WP2583 | 9.22E-10 | 6.57E-08 | 18.22 | 379.12 |
| 5 | Photodynamic therapy-induced HIF-1 survival signalling WP36 | 0.0001052 | 0.006898 | 9.23 | 84.55 | 5 | T-cell antigen Receptor (TCR) pathway during Staphylo | 9.02E-08 | 5.139E-06 | 7.92 | 128.53 |
| 6 | Nuclear Receptors Meta-Pathway WP2882 | 0.0001358 | 0.007422 | 2.9 | 25.8 | 6 | Selective expression of chemokine receptors during T-c | 3.095E-06 | 0.000147 | 11.31 | 143.42 |
| 7 | Fluoropyrimidine Activity WP1601 | 0.000558 | 0.02288 | 8.5 | 63.65 | 7 | Cancer immunotherapy by PD-1 blockade WP4585 | 6.316E-06 | 0.0002404 | 12.97 | 155.25 |
| 8 | Nucleotide Metabolism WP404 | 0.0005581 | 0.02288 | 12.67 | 94.88 | 8 | Allograft Rejection WP2328 | 6.748E-06 | 0.0002404 | 5.1 | 60.74 |
| 9 | Spinal Cord Injury WP2431 | 0.0008116 | 0.02958 | 3.95 | 28.12 | 9 | Arrhythmogenic Right Ventricular Cardiomyopathy WP | 0.00002896 | 0.0009171 | 5.19 | 54.28 |
| 10 | Glycolysis and Gluconeogenesis WP534 | 0.002343 | 0.07684 | 5.94 | 36 | 10 | Development and heterogeneity of the ILC family WP38 | 0.00006699 | 0.001909 | 8.3 | 79.73 |
| KEGG (Kyoto encyclopedia of genes and genomes) 2021 human | |||||||||||
| 1 | Cell cycle | 0.00005693 | 0.01412 | 4.68 | 45.74 | 1 | Th17 cell differentiation | 5.93E-13 | 1.40E-10 | 8.29 | 233.4 |
| 2 | p53 signalling pathway | 0.0008011 | 0.09933 | 5.06 | 36.09 | 2 | Haematopoietic cell lineage | 7.93E-12 | 9.36E-10 | 8.13 | 207.77 |
| 3 | Transcriptional misregulation in cancer | 0.002353 | 0.143 | 2.91 | 17.62 | 3 | T-cell receptor signalling pathway | 1.64E-10 | 1.29E-08 | 7.18 | 161.68 |
| 4 | Toxoplasmosis | 0.002372 | 0.143 | 3.67 | 22.2 | 4 | Th1 and Th2 cell differentiation | 1.00E-09 | 5.92E-08 | 7.31 | 151.49 |
| 5 | Mitophagy | 0.002884 | 0.143 | 4.61 | 26.95 | 5 | Primary immunodeficiency | 2.45E-08 | 1.155E-06 | 12.14 | 212.82 |
| 6 | Cellular senescence | 0.005448 | 0.1907 | 2.92 | 15.24 | 6 | Graft-versus-host disease | 7.72E-08 | 3.036E-06 | 10.57 | 173.17 |
| 7 | Pyrimidine metabolism | 0.006083 | 0.1907 | 4.66 | 23.77 | 7 | Natural-killer cell-mediated cytotoxicity | 3.06E-07 | 0.00001032 | 4.78 | 71.67 |
| 8 | FoxO signalling pathway | 0.006151 | 0.1907 | 3.1 | 15.79 | 8 | Cell adhesion molecules | 4.25E-07 | 0.00001254 | 4.42 | 64.87 |
| 9 | Pantothenate and CoA biosynthesis | 0.008995 | 0.2479 | 7.9 | 37.2 | 9 | Antigen processing and presentation | 1.475E-06 | 0.00003867 | 5.97 | 80.13 |
| 10 | Ferroptosis | 0.01018 | 0.2525 | 5.13 | 23.53 | 10 | Inflammatory bowel disease | 0.00000811 | 0.0001914 | 6.06 | 71.07 |
| Reactome 2016 | |||||||||||
| 1 | G1/S-Specific Transcription Homo sapiens R-HSA-69205 | 2.60E-08 | 0.00002118 | 33.5 | 585.07 | 1 | Generation of second messenger molecules Homo sapi | 1.36E-16 | 7.29E-14 | 28.43 | 1038.62 |
| 2 | E2F-mediated regulation of DNA replication Homo sapiens R- | 0.000004287 | 0.001468 | 12.87 | 159.13 | 2 | Translocation of ZAP-70 to Immunological synapse Hom | 7.67E-15 | 2.06E-12 | 48.63 | 1580.63 |
| 3 | Mitotic G1-G1/S phases Homo sapiens R-HSA-453279 | 0.000005409 | 0.001468 | 5.1 | 61.9 | 3 | Immunoregulatory interactions between a Lymphoid an | 3.71E-14 | 6.65E-12 | 6.91 | 213.68 |
| 4 | Erythrocytes take up oxygen and release carbon dioxide Homo sapiens | 0.00001209 | 0.00246 | 47.52 | 538.13 | 4 | Phosphorylation of CD3 and TCR zeta chains Homo sapiens | 2.79E-12 | 3.76E-10 | 29.87 | 794.8 |
| 5 | Cell Cycle, Mitotic Homo sapiens R-HSA-69278 | 0.0000413 | 0.005818 | 2.68 | 27.02 | 5 | PD-1 signalling Homo sapiens R-HSA-389948 | 9.39E-12 | 1.01E-09 | 25.6 | 650.14 |
| 6 | Transport of glucose and other sugars, bile salts and organic | 0.00004847 | 0.005818 | 5.28 | 52.42 | 6 | Costimulation by the CD28 family Homo sapiens R-HSA | 1.01E-08 | 8.02E-07 | 7.88 | 145.06 |
| 7 | SLC-mediated transmembrane transport Homo sapiens R-HS | 0.00005004 | 0.005818 | 3.28 | 32.5 | 7 | TCR signalling Homo sapiens R-HSA-202403 | 1.04E-08 | 8.02E-07 | 5.77 | 106.04 |
| 8 | Cell Cycle Homo sapiens R-HSA-1640170 | 0.00006012 | 0.006117 | 2.45 | 23.84 | 8 | Adaptive Immune System Homo sapiens R-HSA-128021 | 2.59E-07 | 0.00001743 | 2.3 | 34.86 |
| 9 | Erythrocytes take up carbon dioxide and release oxygen Hom | 0.00008 | 0.006512 | 23.76 | 224.11 | 9 | Chemokine receptors bind chemokines Homo sapiens R | 1.765E-06 | 0.0001055 | 7.28 | 96.43 |
| 10 | O2/CO2 exchange in erythrocytes Homo sapiens R-HSA-1480 | 0.00008 | 0.006512 | 23.76 | 224.11 | 10 | Downstream TCR signalling Homo sapiens R-HSA-20242 | 4.441E-06 | 0.0002389 | 4.92 | 60.6 |
| DisGeNET | |||||||||||
| 1 | Juvenile psoriatic arthritis | 4.59E-08 | 0.0001598 | 5.75 | 97.19 | 1 | Autoimmune diseases | 1.18E-12 | 4.71E-09 | 2.63 | 72.19 |
| 2 | Juvenile-Onset Still Disease | 8.61E-08 | 0.0001598 | 5.48 | 89.2 | 2 | Sezary syndrome | 5.79E-12 | 1.15E-08 | 6.21 | 160.79 |
| 3 | Neoplasm Metastasis | 0.000003009 | 0.002982 | 1.68 | 21.41 | 3 | Peripheral T-cell Lymphoma | 1.27E-11 | 1.69E-08 | 6.96 | 174.57 |
| 4 | Malignant neoplasm of prostate | 0.000003841 | 0.002982 | 1.73 | 21.52 | 4 | Lymphoma, T-cell, cutaneous | 1.51E-10 | 1.50E-07 | 4.28 | 96.76 |
| 5 | Breast carcinoma | 0.000004016 | 0.002982 | 1.62 | 20.15 | 5 | Lupus Erythematosus, Systemic | 2.82E-09 | 2.245E-06 | 2.26 | 44.58 |
| 6 | Juvenile arthritis | 0.000005257 | 0.003253 | 3.36 | 40.85 | 6 | T-cell lymphoma | 1.02E-08 | 6.787E-06 | 3.45 | 63.5 |
| 7 | Liver Cirrhosis, Experimental | 0.0000131 | 0.00695 | 2.33 | 26.2 | 7 | Celiac disease | 1.45E-08 | 8.242E-06 | 3.47 | 62.72 |
| 8 | Hereditary spherocytosis | 0.00001996 | 0.008697 | 13.01 | 140.82 | 8 | Lymphoma | 2.70E-08 | 0.00001347 | 2.07 | 36.08 |
| 9 | Ovarian carcinoma | 0.00002108 | 0.008697 | 1.77 | 19.1 | 9 | Multiple sclerosis | 5.46E-08 | 0.00002418 | 2.14 | 35.72 |
| 10 | Carcinogenesis | 0.00004708 | 0.01622 | 1.57 | 15.63 | 10 | Graft-versus-Host Disease | 1.30E-07 | 0.00005168 | 3.75 | 59.55 |
| Drug perturbations from GEO up | Drug perturbations from GEO down | ||||||||||
| 1 | Estradiol DB00783 human GSE46924 sample 2487 | 3.04E-18 | 1.82E-15 | 6.14 | 247.48 | 1 | Methotrexate DB00563 human GSE41831 sample 2601 | 3.71E-17 | 3.19E-14 | 5.2 | 196.83 |
| 2 | Estradiol DB00783 human GSE8597 sample 2731 | 4.02E-18 | 1.82E-15 | 6.08 | 243.65 | 2 | 5-aminosalicylic acid 4075 human GSE38713 sample 31 | 3.06E-15 | 1.15E-12 | 4.75 | 158.74 |
| 3 | Atorvastatin DB01076 human GSE11393 sample 3196 | 2.74E-14 | 8.25E-12 | 6.08 | 189.71 | 3 | Azathioprine DB00993 human GSE38713 sample 3194 | 4.01E-15 | 1.15E-12 | 5.64 | 186.84 |
| 4 | IFN beta-1a DB00060 human GSE26104 sample 3187 | 5.26E-13 | 1.19E-10 | 4.92 | 139.09 | 4 | IFN beta-1a DB00060 human GSE26104 sample | 8.19E-12 | 1.76E-09 | 5.19 | 132.58 |
| 5 | Nilotinib DB04868 human GSE19567 sample 2528 | 1.24E-12 | 2.25E-10 | 6.56 | 179.85 | 5 | LMP-420 497668 human GSE20211 sample 3222 | 1.29E-08 | 0.00000221 | 3.67 | 66.72 |
| 6 | Bleomycin DB00290 mouse GSE25640 sample 3121 | 3.70E-12 | 5.27E-10 | 4.69 | 123.37 | 6 | Atorvastatin DB01076 human GSE11393 sample 3196 | 2.58E-08 | 3.696E-06 | 3.46 | 60.47 |
| 7 | Atarax DB00557 human GSE31773 sample 2485 | 4.08E-12 | 5.27E-10 | 5.28 | 138.51 | 7 | Resveratrol DB02709 human GSE36930 sample 3497 | 2.11E-07 | 0.00002593 | 3.19 | 49.02 |
| 8 | Lipopolysaccharide 11970143 human GSE40885 sample 2475 | 9.79E-12 | 1.10E-09 | 5.08 | 128.83 | 8 | Atorvastatin DB01076 human GSE11393 sample 3401 | 3.77E-07 | 0.00003923 | 3.24 | 47.98 |
| 9 | Mesalazine DB00244 human GSE38713 sample 3289 | 3.12E-11 | 3.13E-09 | 5.84 | 141.33 | 9 | Calcitriol 5280453 human GSE52819 sample 3129 | 4.11E-07 | 0.00003923 | 3.51 | 51.59 |
| 10 | Adenosine triphosphate 5957 human GSE30903 sample 3219 | 3.82E-11 | 3.45E-09 | 5.54 | 132.82 | 10 | IFN beta-1b DB00068 human GSE26104 sample | 2.934E-06 | 0.0002523 | 3.11 | 39.65 |
| DSigDB | |||||||||||
| 1 | Retinoic acid CTD 00006918 | 2.48E-16 | 6.25E-13 | 2.39 | 85.76 | 1 | 1 AGN-PC-0JHFVD BOSS | 3.64E-07 | 0.0008624 | 3.92 | 58.09 |
| 2 | COPPER CTD 00005706 | 3.90E-15 | 4.92E-12 | 2.93 | 97.05 | 2 | 2 Isoguanine BOSS | 0.00002064 | 0.02448 | 3.29 | 35.49 |
| 3 | tretinoin HL60 UP | 2.65E-14 | 2.23E-11 | 6.85 | 214.07 | 3 | 3 diphenylpyraline BOSS | 0.00004182 | 0.03306 | 3.37 | 33.93 |
| 4 | LUCANTHONE CTD 00006227 | 5.86E-14 | 3.70E-11 | 7.24 | 220.55 | 4 | 4 methyprylon BOSS | 0.0002915 | 0.1728 | 3.39 | 27.63 |
| 5 | etoposide MCF7 DOWN | 5.79E-13 | 2.92E-10 | 20.02 | 564.27 | 5 | 5 ARSENIC CTD 00005442 | 0.0004146 | 0.1967 | 1.77 | 13.75 |
| 6 | estradiol CTD 00005920 | 9.24E-13 | 3.89E-10 | 2.14 | 59.35 | 6 | 6 Prestwick-983 HL60 UP | 0.0005429 | 0.2146 | 2.76 | 20.73 |
| 7 | calcitriol CTD 00005558 | 2.25E-12 | 8.11E-10 | 2.54 | 68.16 | 7 | 7 ajmaline HL60 UP | 0.001871 | 0.6209 | 2.18 | 13.68 |
| 8 | resveratrol CTD 00002483 | 2.74E-12 | 8.65E-10 | 2.69 | 71.66 | 8 | 8 staurosporine TTD 00011086 | 0.0022 | 0.6209 | 2.97 | 18.16 |
| 9 | fludroxycortide HL60 UP | 4.32E-12 | 1.21E-09 | 31.26 | 818.05 | 9 | 9 ZIRAM CTD 00007014 | 0.002356 | 0.6209 | 6.15 | 37.23 |
| 10 | benzo[a] pyrene CTD 00005488 | 4.85E-12 | 1.22E-09 | 2.09 | 54.34 | 10 | 10 ionomycin BOSS | 0.004986 | 0.951 | 3.63 | 19.26 |
IFN, interferon; SARS-CoV-2, severe acute respiratory syndrome coronavirus 2; OR, odd’s ratio; GEO, gene expression omnibus; PD, Parkinson’s disease; sJIA, systemic juvenile idiopathic arthritis; TCR, T-cell receptor; PBMC, peripheral blood mononuclear cells; HIF, hypoxia-inducible factor; ILC, innate lymphoid cell; TMP, thymidine monophosphate; DG, diglyceride; R-HSA, R-HSA reactome pathway ID
| Up-regulated genes | Down-regulated genes | ||||||||||
|---|---|---|---|---|---|---|---|---|---|---|---|
| Index | Name | P | Adjusted P | OR | Combined score | Index | Name | P | Adjusted P | OR | Combined score |
| COVID-19-related gene sets 2021 | |||||||||||
| 1 | SARS perturbation; 280 Up Genes from GEN3VA; Human PBM | 4.17E-77 | 1.92E-74 | 19.5 | 3430.03 | 1 | COVID-19 patients PBMC down | 3.91E-26 | 1.70E-23 | 9.78 | 572.46 |
| 2 | 500 genes up-regulated by SARS-CoV-2 in human lung cells fr | 3.37E-69 | 7.76E-67 | 10.99 | 1731.92 | 2 | Top 500 down genes for SARS-CoV-2 infection in Rhesu | 2.01E-21 | 4.18E-19 | 5.04 | 240.15 |
| 3 | 500 genes upregulated by SARS-CoV-2 in human lung tissue f | 4.02E-68 | 4.62E-66 | 11.29 | 1752.26 | 3 | SARS perturbation; 220 Down Genes from GEN3VA; Hu | 2.89E-21 | 4.18E-19 | 7.74 | 366.11 |
| 4 | Healthy human lung biopsy versus COVID-19-infected human lung | 4.02E-68 | 4.62E-66 | 11.29 | 1752.26 | 4 | Top 500 down genes for SARS-CoV-2 infection in Rhesu | 7.70E-16 | 8.35E-14 | 4.24 | 147.65 |
| 5 | COVID-19 patients PBMC up | 1.61E-46 | 1.48E-44 | 7.75 | 817.02 | 5 | Top 500 down genes for SARS-CoV-2 infection in Rhesu | 1.47E-10 | 1.27E-08 | 3.38 | 76.45 |
| 6 | Top 500 up genes for SARS-CoV-2 infection in Rhesus macaque | 6 | Top 500 up genes for SARS-CoV-2 infection in Rhesus m | 2.85E-09 | 2.06E-07 | 3.03 | 59.64 | ||||
| 7 | Top 500 up genes for SARS-CoV- 2 infection in Rhesus macaque | 7 | Top 500 up genes for SARS- CoV-2 infection in Rhesus m | 3.00E-08 | 1.86E-06 | 2.89 | 50.12 | ||||
| 8 | Top 500 down genes for SARS - CoV-2 infection in Rhesus mac | 8 | Top 500 down genes for SARS-CoV-2 infection in Rhesus | 3.90E-08 | 2.114E-06 | 2.91 | 49.6 | ||||
| 9 | Top 500 up genes for SARS-CoV- 2 infection in Rhesus macaque | 9 | Top 500 down genes for SARS-CoV-2 infection in Rhesus | 5.02E-07 | 0.00002422 | 2.68 | 38.91 | ||||
| 10 | Top 500 up genes from control versus Ad5-hACE2 for SARS-CoV- | 10 | Top 500 down genes for SARS-CoV-2 early infection in h | 1.29E-06 | 0.00005583 | 2.53 | 34.35 | ||||
| HMDB (human metabolome database) metabolites | |||||||||||
| 1 | Zinc (HMDB01303) | 0.0004604 | 0.5249 | 3.98 | 30.61 | 1 | I3P (HMDB01498) | 0.127 | 0.4455 | 3.49 | 7.2 |
| 2 | C6H12O6 (HMDB03345) | 0.0005829 | 0.5249 | 8.92 | 66.46 | 2 | PC (16:0/16:0) (HMDB00564) | 0.224 | 0.4455 | 1.89 | 2.83 |
| 3 | C6H12O6 (HMDB00516) | 0.0007451 | 0.5249 | 12.68 | 91.3 | 3 | PC (18:1 (9Z)/18:1 (9Z)) (HMDB00593) | 0.224 | 0.4455 | 1.89 | 2.83 |
| 4 | Iron (HMDB00692) | 0.0009645 | 0.5249 | 2.6 | 18.07 | 4 | DG (14:0/14:0/0:0) (HMDB07008) | 0.224 | 0.4455 | 1.89 | 2.83 |
| 5 | D-Glucose (HMDB00122) | 0.001637 | 0.5249 | 6.8 | 43.6 | 5 | DG (14:0/14:1 (9Z)/0:0) (HMDB07009) | 0.224 | 0.4455 | 1.89 | 2.83 |
| 6 | Glucose 6-phosphate (HMDB01401) | 0.002225 | 0.5249 | 8.77 | 53.59 | 6 | DG (14:0/15:0/0:0) (HMDB07010) | 0.224 | 0.4455 | 1.89 | 2.83 |
| 7 | F6P (HMDB03971) | 0.002225 | 0.5249 | 8.77 | 53.59 | 7 | DG (14:0/16:0/0:0) (HMDB07011) | 0.224 | 0.4455 | 1.89 | 2.83 |
| 8 | Ammonia (HMDB00051) | 0.002802 | 0.5249 | 4.08 | 24.01 | 8 | DG (14:0/16:1 (9Z)/0:0) (HMDB07012) | 0.224 | 0.4455 | 1.89 | 2.83 |
| 9 | C10H13N2O7P (HMDB01570) | 0.005285 | 0.5249 | 10.68 | 56 | 9 | DG (14:0/18:0/0:0) (HMDB07013) | 0.224 | 0.4455 | 1.89 | 2.83 |
| 10 | TMP (HMDB01227) | 0.008707 | 0.5249 | 8.54 | 40.53 | 10 | DG (14:0/18:1 (11Z)/0:0) (HMDB07014) | 0.224 | 0.4455 | 1.89 | 2.83 |
| Disease perturbations from GEO up | Disease perturbations from GEO down | ||||||||||
| 1 | Septic Shock C0036983 human GSE9692 sample 307 | 3.77E-162 | 3.16E-159 | 25.79 | 9587.69 | 1 | H1N1 DOID-0050211 human GSE27131 sample 514 | 1.20E-79 | 1.00E-76 | 32.69 | 5940.73 |
| 2 | H1N1 DOID-0050211 human GSE27131 sample 514 | 1.87E-83 | 7.84E-81 | 14.34 | 2732.41 | 2 | Acute myeloid leukemia DOID-9119 human GSE9476 sa | 3.08E-31 | 1.29E-28 | 6.55 | 460.32 |
| 3 | SARS C1175175 human | 7.04E-74 | 1.97E-71 | 25.47 | 4290.68 | 3 | Huntington’s disease DOID-12858 human GSE24250 sa | 1.42E-24 | 3.96E-22 | 7.02 | 385.49 |
| 4 | Overexertion C0161750 human GSE3606 sample 286 | 2.57E-70 | 5.40E-68 | 16.81 | 2693.84 | 4 | Sarcoidosis DOID-11335 human GSE19314 sample 708 | 1.02E-23 | 2.14E-21 | 6.53 | 345.69 |
| 5 | sJIA DOID-848 human | 1.50E-66 | 2.52E-64 | 13.06 | 1979.41 | 5 | Autism-spectrum disorder DOID-0060041 human GSE25 | 1.27E-22 | 2.13E-20 | 6.73 | 339.41 |
| 6 | Rheumatoid arthritis DOID-7148 human GSE15573 sample 90 | 1.88E-59 | 2.63E-57 | 14.59 | 1972.98 | 6 | Multiple sclerosis DOID-2377 human GSE23832 sample | 3.30E-19 | 4.60E-17 | 6.3 | 268.09 |
| 7 | Non-sJIA (subgroup-RF) | 1.56E-54 | 1.87E-52 | 11.15 | 1380.87 | 7 | sJIA DOID-848 hu | 5.59E-18 | 6.68E-16 | 6.47 | 256.83 |
| 8 | Polycystic ovary syndrome DOID-11612 human GSE34526 sa | 5.03E-54 | 5.28E-52 | 10.58 | 1298.64 | 8 | JRA - C0553662 human G | 2.31E-17 | 2.41E-15 | 5.67 | 217.38 |
| 9 | Multiple sclerosis DOID-2377 human GSE26484 sample 742 | 2.44E-50 | 2.28E-48 | 12.82 | 1464.35 | 9 | Rotavirus infection of children C1442797 human GSE27 | 1.38E-16 | 1.28E-14 | 5.23 | 191.13 |
| 10 | Huntington’s disease DOID-12858 human GSE8762 sample 9 | 2.97E-49 | 2.49E-47 | 9.07 | 1014 | 10 | Overexertion C0161750 human GSE3606 sample 286 | 1.66E-15 | 1.38E-13 | 4.95 | 168.59 |
| WikiPathway (WP) 2021 human | |||||||||||
| 1 | Complement system WP2806 | 9.69E-12 | 4.30E-09 | 8.06 | 204.31 | 1 | Cytoplasmic Ribosomal Proteins WP477 | 7.22E-15 | 2.23E-12 | 10.65 | 346.72 |
| 2 | Complement and Coagulation Cascades WP558 | 6.25E-09 | 0.000001388 | 9.19 | 173.69 | 2 | 2 Modulators of TCR signalling and T-cell activation WP50 | 7.57E-09 | 8.62E-07 | 8.98 | 167.96 |
| 3 | Microglia Pathogen Phagocytosis Pathway WP3937 | 6.59E-07 | 0.00008135 | 9.58 | 136.37 | 3 | Pathogenesis of SARS-CoV-2 Mediated by nsp9-nsp10 C | 8.37E-09 | 8.62E-07 | 22.48 | 418.13 |
| 4 | Metabolic reprogramming in colon cancer WP4290 | 0.000001076 | 0.00008135 | 8.98 | 123.44 | 4 | TCR signalling pathway WP69 | 2.10E-07 | 1.39E-05 | 6.03 | 92.73 |
| 5 | Signal transduction through IL1R WP4496 | 0.000001081 | 0.00008135 | 10.77 | 147.92 | 5 | TCR and Co-stimulatory Signalling WP2583 | 2.25E-07 | 0.00001393 | 13.48 | 206.37 |
| 6 | Vitamin D Receptor Pathway WP2877 | 0.000001099 | 0.00008135 | 3.79 | 51.95 | 6 | Allograft Rejection WP2328 | 1.104E-06 | 0.00005685 | 5.62 | 77.1 |
| 7 | Spinal Cord Injury WP2431 | 0.000002527 | 0.0001603 | 4.53 | 58.42 | 7 | T-Cell antigen Receptor (TCR) pathway during Staphylo | 4.685E-06 | 0.0002068 | 6.47 | 79.42 |
| 8 | IL1 and megakaryocytes in obesity WP2865 | 0.00001073 | 0.0005957 | 11.79 | 134.93 | 8 | Cancer immunotherapy by PD-1 blockade WP4585 | 6.008E-06 | 0.0002321 | 13.07 | 157.14 |
| 9 | Cori Cycle WP1946 | 0.00001368 | 0.0006075 | 15.6 | 174.74 | 9 | B-Cell receptor Signalling Pathway WP23 | 0.0003263 | 0.0112 | 3.83 | 30.76 |
| 10 | Platelet-mediated interactions with vascular and circulating c | 0.00001368 | 0.0006075 | 15.6 | 174.74 | 10 | Development and heterogeneity of the ILC family WP38 | 0.0005237 | 0.01618 | 6.88 | 51.98 |
| KEGG (Kyoto encyclopedia of genes and genomes) 2021 human | |||||||||||
| 1 | Neutrophil extracellular trap formation | 8.97E-15 | 2.37E-12 | 6.26 | 202.34 | 1 | Hematopoietic cell lineage | 5.87E-19 | 1.38E-16 | 12.14 | 509.74 |
| 2 | Osteoclast differentiation | 4.86E-11 | 6.42E-09 | 6.46 | 153.36 | 2 | Th17 cell differentiation | 6.23E-15 | 7.32E-13 | 9.34 | 305.42 |
| 3 | Complement and coagulation cascades | 4.33E-10 | 3.81E-08 | 7.8 | 168.19 | 3 | Th1 and Th2 cell differentiation | 1.51E-12 | 1.01E-10 | 9.01 | 245.13 |
| 4 | S. aureus infection | 1.96E-08 | 0.000001296 | 6.32 | 112.08 | 4 | Inflammatory bowel disease | 1.72E-12 | 1.01E-10 | 11.62 | 314.8 |
| 5 | Legionellosis | 4.54E-08 | 0.000002398 | 8.53 | 144.14 | 5 | Primary immunodeficiency | 6.52E-12 | 3.06E-10 | 17.61 | 453.6 |
| 6 | Leishmaniasis | 2.85E-07 | 0.00001253 | 6.42 | 96.69 | 6 | Intestinal immune network for IgA production | 2.40E-10 | 9.41E-09 | 12.43 | 275.2 |
| 7 | SLE | 7.76E-07 | 0.00002928 | 4.46 | 62.69 | 7 | Ribosome | 1.97E-09 | 6.62E-08 | 5.19 | 103.97 |
| 8 | Phagosome | 0.000004399 | 0.0001348 | 3.89 | 47.94 | 8 | Cell adhesion molecules | 2.97E-09 | 8.71E-08 | 5.31 | 104.27 |
| 9 | Lipid and atherosclerosis | 0.000004594 | 0.0001348 | 3.31 | 40.66 | 9 | Antigen processing and presentation | 2.88E-08 | 7.31E-07 | 7.18 | 124.74 |
| 10 | Malaria | 0.000005876 | 0.0001551 | 7.18 | 86.52 | 10 | Asthma | 3.11E-08 | 7.31E-07 | 14.29 | 247.01 |
| Reactome 2016 | |||||||||||
| 1 | Hemostasis Homo sapiens R-HSA-109582 | 4.59E-16 | 4.06E-13 | 3.77 | 133.25 | 1 | Generation of second messenger molecules Homo sapi | 1.19E-16 | 4.61E-14 | 28.66 | 1050.67 |
| 2 | Platelet degranulation Homo sapiens R-HSA-114608 | 9.76E-15 | 4.32E-12 | 9.16 | 295.66 | 2 | Translocation of ZAP-70 to Immunological synapse Hom | 1.31E-16 | 4.61E-14 | 60.43 | 2210.09 |
| 3 | Response to elevated platelet cytosolic Ca2+Homo sapiens R | 3.10E-14 | 9.16E-12 | 8.62 | 268.23 | 3 | Viral mRNA Translation Homo sapiens R-HSA-192823 | 1.81E-15 | 2.84E-13 | 11.52 | 391.16 |
| 4 | Platelet activation, signaling and aggregation Homo sapiens R | 1.75E-12 | 3.87E-10 | 4.75 | 128.53 | 4 | Peptide chain elongation Homo sapiens R-HSA-156902 | 1.81E-15 | 2.84E-13 | 11.52 | 391.16 |
| 5 | Immune System Homo sapiens R-HSA-168256 | 2.86E-11 | 5.06E-09 | 2.21 | 53.56 | 5 | Phosphorylation of CD3 and TCR zeta chains Homo sapiens | 2.02E-15 | 2.84E-13 | 42.3 | 1431.16 |
| 6 | Cell surface interactions at the vascular wall Homo sapiens R- | 1.68E-10 | 2.34E-08 | 7.19 | 161.76 | 6 | Selenocysteine synthesis Homo sapiens R-HSA-2408557 | 4.20E-15 | 4.22E-13 | 10.98 | 363.52 |
| 7 | Extracellular matrix organization Homo sapiens R-HSA-14742 | 1.85E-10 | 2.34E-08 | 4.02 | 90.19 | 7 | Eukaryotic Translation Termination Homo sapiens R-HS | 4.20E-15 | 4.22E-13 | 10.98 | 363.52 |
| 8 | Metabolism of carbohydrates Homo sapiens R-HSA-71387 | 4.42E-07 | 0.00004891 | 3.22 | 47.09 | 8 | Eukaryotic Translation Elongation Homo sapiens R-HSA | 7.22E-15 | 5.64E-13 | 10.65 | 346.72 |
| 9 | Innate Immune System Homo sapiens R-HSA-168249 | 0.000001824 | 0.0001796 | 2.12 | 28.06 | 9 | NMD independent of the E | 7.22E-15 | 5.64E-13 | 10.65 | 346.72 |
| 10 | Regulation of Complement cascade Homo sapiens R-HSA-977 | 0.00001922 | 0.001703 | 10.55 | 114.56 | 10 | PD-1 signaling Homo sapiens R-HSA-389948 | 9.36E-15 | 6.58E-13 | 35.24 | 1138.46 |
| DisGeNET | |||||||||||
| 1 | Sepsis | 4.86E-22 | 2.75E-18 | 4.62 | 226.84 | 1 | Autoimmune diseases | 1.06E-13 | 4.45E-10 | 2.73 | 81.65 |
| 2 | Rheumatoid arthritis | 1.04E-21 | 2.89E-18 | 2.77 | 133.96 | 2 | Celiac disease | 5.51E-11 | 1.16E-07 | 4.02 | 95.08 |
| 3 | Arteriosclerosis | 1.53E-21 | 2.89E-18 | 3.32 | 159.14 | 3 | Immune System Diseases | 3.68E-09 | 5.15E-06 | 4.02 | 77.98 |
| 4 | Atherosclerosis | 1.12E-19 | 1.58E-16 | 3.12 | 136.22 | 4 | Chronic Lymphocytic Leukaemia | 1.36E-08 | 1.43E-05 | 2.2 | 39.77 |
| 5 | Arthritis | 5.05E-19 | 5.71E-16 | 3.91 | 164.56 | 5 | Peripheral T-cell lymphoma | 1.86E-08 | 0.00001564 | 5.54 | 98.53 |
| 6 | Septicaemia | 2.98E-18 | 2.80E-15 | 4.39 | 176.99 | 6 | Sezary syndrome | 2.86E-08 | 0.00002004 | 4.83 | 83.87 |
| 7 | Liver cirrhosis, Experimental | 1.30E-17 | 1.05E-14 | 3.38 | 131.44 | 7 | Multiple sclerosis | 4.03E-08 | 0.00002414 | 2.15 | 36.69 |
| 8 | Acute coronary syndrome | 1.71E-17 | 1.21E-14 | 5.9 | 227.63 | 8 | Grave’s disease | 6.52E-08 | 0.00003421 | 3.23 | 53.5 |
| 9 | Infection | 3.23E-17 | 2.03E-14 | 4.14 | 157.1 | 9 | Rheumatoid arthritis | 2.14E-07 | 0.00009531 | 1.83 | 28.18 |
| 10 | Juvenile arthritis | 4.72E-17 | 2.67E-14 | 5.06 | 190.18 | 10 | Immunologic deficiency syndromes | 2.27E-07 | 0.00009531 | 2.44 | 37.39 |
| Drug perturbations from GEO up | Drug perturbations from GEO down | ||||||||||
| 1 | Etanercept DB00005 human GSE7524 sample 3295 | 6.65E-45 | 6.00E-42 | 13.58 | 1381.37 | 1 | Azathioprine DB00993 human GSE38713 sample 3194 | 3.29E-19 | 1.90E-16 | 6.67 | 283.91 |
| 2 | Atorvastatin DB01076 human GSE11393 sample 3196 | 5.67E-36 | 2.56E-33 | 9.06 | 735.01 | 2 | IFN beta-1a DB00060 human GSE26104 sample | 4.22E-19 | 1.90E-16 | 7.28 | 308.13 |
| 3 | Soman 7305 rat GSE13428 sample 2635 | 1.11E-32 | 3.34E-30 | 6.25 | 459.72 | 3 | 5-aminosalicylic acid 4075 human GSE38713 sample 31 | 1.79E-17 | 5.37E-15 | 5.2 | 200.41 |
| 4 | Soman 7305 rat GSE13428 sample 2639 | 1.93E-31 | 4.35E-29 | 6.04 | 426.98 | 4 | 4 LMP-420 497668 human GSE20211 sample 3222 | 3.01E-15 | 6.78E-13 | 5.23 | 174.88 |
| 5 | Soman 7305 rat GSE13428 sample 2633 | 8.03E-31 | 1.45E-28 | 5.89 | 408.2 | 5 | 1,2,4-BENZENETRIOL 10787 human GSE7664 sample 3 | 1.77E-14 | 3.19E-12 | 5.67 | 179.55 |
| 6 | Soman 7305 rat GSE13428 sample 2640 | 1.94E-30 | 2.92E-28 | 5.65 | 386.41 | 6 | Methotrexate DB00563 human GSE41831 sample 2601 | 3.84E-13 | 5.76E-11 | 4.42 | 126.36 |
| 7 | Promyelocytic leukemia DB00755 human GSE5007 sample 24 | 2.93E-30 | 3.78E-28 | 7.73 | 525.92 | 7 | Etanercept DB00005 human GSE7524 sample 3295 | 1.26E-12 | 1.62E-10 | 3.98 | 109.09 |
| 8 | Soman 7305 rat GSE13428 sample 2637 | 1.40E-29 | 1.59E-27 | 6.12 | 406.27 | 8 | Resveratrol DB02709 human GSE36930 sample 3497 | 1.12E-09 | 1.26E-07 | 3.72 | 76.68 |
| 9 | Mycophenolic acid DB01024 human GSE14630 sample 3302 | 6.67E-28 | 6.69E-26 | 6.89 | 430.86 | 9 | Estradiol 5757 human GSE12446 sample 3203 | 2.60E-09 | 2.60E-07 | 3.76 | 74.37 |
| 10 | Soman 7305 rat GSE13428 sample 2632 | 1.13E-27 | 1.02E-25 | 5.64 | 349.71 | 10 | Atorvastatin DB01076 human GSE11393 sample 3196 | 5.94E-09 | 5.35E-07 | 3.62 | 68.59 |
| DSigDB | |||||||||||
| 1 | Tretinoin HL60 UP | 3.47E-26 | 1.14E-22 | 8.15 | 477.79 | 1 | AGN-PC-0JHFVD BOSS | 0.00001726 | 0.04434 | 3.34 | 36.58 |
| 2 | Retinoic acid CTD 00006918 | 1.16E-24 | 1.90E-21 | 2.37 | 130.44 | 2 | 2-Fluoroadenosine BOSS | 0.00005038 | 0.06471 | 4.85 | 47.99 |
| 3 | Mebendazole HL60 UP | 1.42E-22 | 1.55E-19 | 5.88 | 295.77 | 3 | Fluoride CTD 00005982 | 0.0003925 | 0.3361 | 5.09 | 39.88 |
| 4 | Etynodiol HL60 UP | 1.78E-19 | 1.46E-16 | 18.06 | 779.66 | 4 | Isoguanine BOSS | 0.0005942 | 0.3816 | 2.73 | 20.29 |
| 5 | Pergolide HL60 UP | 2.58E-19 | 1.70E-16 | 5.62 | 240.44 | 5 | Diphenylpyraline BOSS | 0.001278 | 0.6566 | 2.73 | 18.16 |
| 6 | Alprostadil HL60 UP | 4.84E-19 | 2.65E-16 | 4.81 | 203.02 | 6 | ALW-II-38-3 LINCS | 0.001938 | 0.8296 | 6.47 | 40.43 |
| 7 | Aspirin CTD 00005447 | 1.70E-17 | 7.98E-15 | 3.93 | 151.69 | 7 | Orciprenaline HL60 UP | 0.002299 | 0.8438 | 4.97 | 30.17 |
| 8 | Tetryzoline HL60 UP | 3.56E-17 | 1.46E-14 | 9.5 | 359.93 | 8 | (-)-isoprenaline HL60 UP | 0.002704 | 0.8684 | 2.5 | 14.77 |
| 9 | Tetradioxin CTD 00006848 | 4.25E-17 | 1.55E-14 | 2.09 | 78.84 | 9 | Beta-D-allopyranose BOSS | 0.004483 | 1 | 3.05 | 16.51 |
| 10 | Tamibarotene CTD 00002527 | 2.18E-16 | 7.16E-14 | 3.79 | 136.8 | 10 | Dasatinib TTD 00007441 | 0.005056 | 1 | 4.16 | 21.98 |
IFN, interferon; NMD, nonsense-mediated decay; OR, odds ratio; SARS-CoV-2, severe acute respiratory syndrome coronavirus 2; GEO, gene expression omnibus; sJIA, systemic juvenile idiopathic arthritis; JRA, juvenile rheumatoid arthritis; TCR, T-cell receptor; S. aureus, Staphylococcus aureus; SLE, systemic lupus erythematosus; PD, Parkinson’s disease; PBMC, peripheral blood mononuclear cells; DG, diglyceride; TMP, thymidine monophosphate; RF, rheumatoid factor; ILC, Innate lymphoid cell; R-HSA, R-HSA reactome pathway ID; ZAP, zeta-chain-associated protein kinase 70 CTD, comparative toxicogenomics database
| Up regulated genes (440) | Down regulated genes (490) | ||||||||||
|---|---|---|---|---|---|---|---|---|---|---|---|
| Index | Name | P | Adjusted P | OR | Combined score | Index | Name | P | Adjusted P | OR | Combined score |
| COVID-19-related gene sets 2021 | |||||||||||
| 1 | SARS Perturbation; 348 Up Genes from GEN3VA Mouse Lung | 0.0622 | 0.9999 | 1.7000 | 4.7100 | 1 | 500 genes down-regulated by SARS-CoV-2 in mouse Lu | 6.74E-02 | 1.00E+00 | 1.55 | 4.18 |
| 2 | 500 genes down-regulated by MERS-CoV in Calu-3 cells from | 0.0664 | 0.9999 | 1.5500 | 4.2100 | 2 | Top 500 downregulated genes in mouse lung with SARS | 6.74E-02 | 1.00E+00 | 1.55 | 4.18 |
| 3 | COVID19-Orf8 protein host PPI from Krogan | 0.0844 | 0.9999 | 3.0400 | 7.5300 | 3 | SARS-CoV perturbation; 231 Up Genes from GEN3VA; H | 6.94E-02 | 1.00E+00 | 1.82 | 4.87 |
| 4 | 499 genes down-regulated by SARS-CoV-2 in Calu-3 cells from | 0.1042 | 0.9999 | 1.4900 | 3.3600 | 4 | SARS-CoV perturbation; 217 up genes from GEN3VA; H | 1.03E-01 | 1.00E+00 | 1.73 | 3.94 |
| 5 | 500 genes down-regulated by SARS-CoV-2 in human Calu3 ce | 0.1193 | 0.9999 | 1.4300 | 3.0400 | 5 | 500 genes downregulated by SARS-CoV-2 in A549-ACE | 2.28E-01 | 1.00E+00 | 1.27 | 1.88 |
| 6 | Top 500 down genes for SARS-CoV-2 infection 48 hpi in huma | 0.1297 | 0.9999 | 1.4300 | 2.9200 | 6 | 500 genes downregulated by SARS-CoV-1 in human int | 2.31E-01 | 1.00E+00 | 1.27 | 1.86 |
| 7 | 7 SARS Perturbation 320 up genes from GEN3VA mouse lung; | 0.1373 | 0.9999 | 1.5200 | 3.0200 | 7 | 500 genes downregulated by SARS-CoV-2 in human Ca | 3.06E-01 | 1.00E+00 | 1.19 | 1.41 |
| 8 | Top 500 downregulated genes in mouse D1 cardiomyocytes | 0.1479 | 0.9999 | 1.3900 | 2.6600 | 8 | Top 500 up genes for SARS-CoV-2 infection in Mesocric | 3.20E-01 | 1 | 1.2 | 1.37 |
| 9 | SARS perturbation; 112 down genes from GEN3VA; human a | 0.1571 | 0.9999 | 1.9600 | 3.6300 | 9 | SARS coronavirus formerly known as growth-factor-like | 3.28E-01 | 1 | 2.66 | 2.97 |
| 10 | Top 500 up genes for SARS-CoV-2 infection in Rhesus macaqu | 0.1602 | 0.9999 | 1.3700 | 2.5100 | 10 | SARS coronavirus hypothetical protein sars9b from Viru | 3.28E-01 | 1 | 2.66 | 2.97 |
| HMDB metabolites | |||||||||||
| 1 | 1,4-Naphthalenedione, 2-methyl- (HMDB01892) | 0.0091 | 0.7183 | 7.8900 | 37.0600 | 1 | Formyl-CoA (HMDB03419) | 0.039 | 0.724 | 7.26 | 23.55 |
| 2 | L-Proline (HMDB00162) | 0.0170 | 0.7183 | 6.1000 | 24.8500 | 2 | 1-(1Z-hexadecenyl)-sn-glycero - 3-phosphoethanolamine | 0.1581 | 0.724 | 2.96 | 5.45 |
| 3 | Hydroxyproline (HMDB00725) | 0.0233 | 0.7183 | 9.9200 | 37.2900 | 3 | 1-hexadecyl-2-(9Z-octadecenoyl) - sn-glycero-3-phospho | 0.1581 | 0.724 | 2.96 | 5.45 |
| 4 | Sulfide (HMDB00598) | 0.0290 | 0.7183 | 3.6500 | 12.9300 | 4 | PE (P-16:0/14:0) (HMDB11335) | 0.1581 | 0.724 | 2.96 | 5.45 |
| 5 | QH2 (HMDB01304) | 0.0387 | 0.7183 | 3.3100 | 10.7800 | 5 | PE (P-16:0/14:1 (9Z)) (HMDB11336) | 0.1581 | 0.724 | 2.96 | 5.45 |
| 6 | Coenzyme Q (HMDB06709) | 0.0408 | 0.7183 | 3.2500 | 10.4100 | 6 | PE (P-16:0/15:0) (HMDB11337) | 0.1581 | 0.724 | 2.96 | 5.45 |
| 7 | Ubiquinone Q1 (HMDB02012) | 0.0452 | 0.7183 | 3.1400 | 9.7200 | 7 | PE (P-16:0/16:1 (9Z)) (HMDB11339) | 0.1581 | 0.724 | 2.96 | 5.45 |
| 8 | Androstenedione (HMDB00053) | 0.1874 | 0.7183 | 2.6200 | 4.3900 | 8 | PE (P-16:0/18:0) (HMDB11340) | 0.1581 | 0.724 | 2.96 | 5.45 |
| 9 | FAD (HMDB01197) | 0.2171 | 0.7183 | 4.4500 | 6.8000 | 9 | PEP-16:0/18:1 (11Z)) (HMDB11341) | 0.1581 | 0.724 | 2.96 | 5.45 |
| 10 | 4’- Phosphopantetheine (HMDB01416) | 0.2171 | 0.7183 | 4.4500 | 6.8000 | 10 | PE (P-16:0/18:1 (9Z)) (HMDB11342) | 0.1581 | 0.724 | 2.96 | 5.45 |
| Disease perturbations from GEO up | Disease perturbations from GEO down | ||||||||||
| 1 | Simian acquired immune deficiency syndrome C0080151 hu | 0.0022 | 1.0000 | 2.3000 | 14.0300 | 1 | ALS C0002736 human G | 1.76E-01 | 1.00E+00 | 1.47 | 2.55 |
| 2 | Squamous cell carcinoma of lung C0149782 human GSE3268 | 0.0333 | 1.0000 | 1.9500 | 6.6300 | 2 | ALS DOID-332 human GSE833 | 1.87E-01 | 1.00E+00 | 1.44 | 2.42 |
| 3 | Ulcerative colitis DOID-8577 human GSE38713 sample 810 | 0.0506 | 1.0000 | 1.8700 | 5.5800 | 3 | Down syndrome DOID-14250 human GSE19681 sample | 2.04E-01 | 1.00E+00 | 1.41 | 2.24 |
| 4 | Huntington’s disease DOID-12858 mouse GSE3248 sample 72 | 0.0690 | 1.0000 | 1.6300 | 4.3500 | 4 | Juvenile dermatomyositis UMLS CUI-C0263666 human | 2.14E-01 | 1.00E+00 | 1.72 | 2.65 |
| 5 | Neurofibromatosis DOID-8712 mouse GSE1482 sample 665 | 0.0692 | 1.0000 | 1.7600 | 4.7000 | 5 | Sjogren’s syndrome DOID-12894 human GSE23117 samples | 2.25E-01 | 1.00E+00 | 1.34 | 2 |
| 6 | Alcohol poisoning C0392620 rat GSE3311 sample 288 | 0.0719 | 1.0000 | 1.7500 | 4.6000 | 6 | Setleis syndrome C1744559 human GSE16524 sample 2 | 2.46E-01 | 1.00E+00 | 1.4 | 1.96 |
| 7 | Turner syndrome C0041408 mouse GSE1606 sample 218 | 0.0777 | 1.0000 | 1.7200 | 4.3900 | 7 | Mytonic dystrophy Type 1 DOID-11722 human GSE717 | 2.52E-01 | 1.00E+00 | 1.3 | 1.8 |
| 8 | Progressive myoclonus epilepsy DOID-891 mouse GSE47516 | 0.0839 | 1.0000 | 1.5200 | 3.7700 | 8 | Kidney disorder associated with type 2 diabetes mellitus | 2.56E-01 | 1.00E+00 | 1.32 | 1.79 |
| 9 | Huntington’s disease DOID-12858 mouse GSE3248 sample 72 | 0.0852 | 1.0000 | 1.6900 | 4.1500 | 9 | Rheumatoid arthritis DOID-7148 human GSE15573 samples | 2.64E-01 | 1.00E+00 | 1.29 | 1.71 |
| 10 | Cancer of the intestine C0346627 mouse GSE3915 sample 90 | 0.0999 | 1.0000 | 1.6300 | 3.7600 | 10 | SLE DOID-9074 human GSE1 | 2.66E-01 | 1.00E+00 | 1.3 | 1.73 |
| WikiPathway (WP) 2021 Human | |||||||||||
| 1 | Estrogen receptor pathway WP2881 | 0.0026 | 0.7006 | 13.4200 | 80.0600 | 1 | Mevalonate arm of cholesterol biosynthesis pathway W | 2.85E-02 | 9.98E-01 | 8.88 | 31.61 |
| 2 | ATM signalling pathway WP2516 | 0.0113 | 0.8858 | 4.9800 | 22.3000 | 2 | Biomarkers for pyrimidine metabolism disorders WP45 | 5.10E-02 | 9.98E-01 | 6.15 | 18.3 |
| 3 | ATM signalling network in development and disease WP3878 | 0.0169 | 0.8858 | 4.3700 | 17.8200 | 3 | Cholesterol biosynthesis pathway WP197 | 5.10E-02 | 9.98E-01 | 6.15 | 18.3 |
| 4 | miRNA regulation of DNA damage response WP1530 | 0.0200 | 0.8858 | 3.3900 | 13.2800 | 4 | Mitochondrial CIV assembly WP4922 | 5.37E-02 | 9.98E-01 | 3.75 | 10.97 |
| 5 | Electron transport chain (OXPHOS system in mitochondria) | 0.0263 | 0.8858 | 2.7700 | 10.1000 | 5 | Cells and molecules involved in local acute inflammator | 6.39E-02 | 0.998 | 5.33 | 14.65 |
| 6 | MFAP5-mediated ovarian cancer cell motility and invasiveness | 0.0321 | 0.8858 | 8.1100 | 27.9100 | 6 | Pyrimidine metabolism and related diseases WP4225 | 0.06393 | 0.998 | 5.33 | 14.65 |
| 7 | Mitochondrial complex I assembly model OXPHOS system W | 0.0346 | 0.8858 | 3.4400 | 11.5800 | 7 | Small ligand GPCRs WP247 | 0.07787 | 0.998 | 4.7 | 12 |
| 8 | p38 MAPK signalling pathway WP400 | 0.0383 | 0.8858 | 4.3200 | 14.1100 | 8 | 8miRNA regulation of DNA damage response WP1530 | 0.09641 | 0.998 | 2.39 | 5.59 |
| 9 | Leptin insulin overlap WP3935 | 0.0528 | 0.8858 | 5.9500 | 17.5000 | 9 | Purine metabolism and related disorders WP4224 | 0.1003 | 0.998 | 3.99 | 9.18 |
| 10 | Nsp1 from SARS-CoV-2 inhibits translation initiation in the ho | 0.0528 | 0.8858 | 5.9500 | 17.5000 | 10 | Cholesterol metabolism (includes both Bloch and Kandu) | 0.1026 | 0.998 | 2.79 | 6.35 |
| KEGG 2021 Human | |||||||||||
| 1 | Non-alcoholic fatty liver disease | 0.0558 | 0.9996 | 2.1200 | 6.1200 | 1 | Vibrio cholerae infection | 3.38E-02 | 9.99E-01 | 3.48 | 11.8 |
| 2 | Diabetic cardiomyopathy | 0.0805 | 0.9996 | 1.8400 | 4.6300 | 2 | Spliceosome | 7.64E-02 | 9.99E-01 | 1.96 | 5.05 |
| 3 | Glycosaminoglycan biosynthesis | 0.1110 | 0.9996 | 2.6800 | 5.8900 | 3 | Vasopressin-regulated water reabsorption | 9.27E-02 | 9.99E-01 | 2.93 | 6.96 |
| 4 | Vitamin B6 metabolism | 0.1250 | 0.9996 | 8.9100 | 18.5300 | 4 | Terpenoid backbone biosynthesis | 1.00E-01 | 9.99E-01 | 3.99 | 9.18 |
| 5 | Thermogenesis | 0.1409 | 0.9996 | 1.6000 | 3.1300 | 5 | p53 signaling pathway | 1.04E-01 | 9.99E-01 | 2.32 | 5.25 |
| 6 | Sulfur relay system | 0.1631 | 0.9996 | 6.3600 | 11.5400 | 6 | Malaria | 1.24E-01 | 9.99E-01 | 2.55 | 5.33 |
| 7 | Tight junction | 0.1696 | 0.9996 | 1.6500 | 2.9200 | 7 | Caffeine metabolism | 1.38E-01 | 9.99E-01 | 7.98 | 15.78 |
| 8 | Homologous recombination | 0.2278 | 0.9996 | 2.2900 | 3.3800 | 8 | Pyrimidine metabolism | 1.58E-01 | 9.99E-01 | 2.26 | 4.18 |
| 9 | Huntington diseases | 0.2337 | 0.9996 | 1.3500 | 1.9700 | 9 | RNA polymerase | 1.76E-01 | 9.99E-01 | 2.75 | 4.79 |
| 10 | Spliceosome | 0.2355 | 0.9996 | 1.5400 | 2.2300 | 10 | Mineral absorption | 1.82E-01 | 9.99E-01 | 2.1 | 3.58 |
| Reactome 2016 | |||||||||||
| 1 | G2/M DNA replication checkpoint R-HSA-69478 | 0.0046 | 1.0000 | 29.7700 | 160.0600 | 1 | Conjugation Of benzoate with glycine R-HSA-177135 | 8.42E-03 | 1.00E+00 | 19.99 | 95.48 |
| 2 | Signaling by leptin R-HSA-2586552 | 0.0233 | 1.0000 | 9.9200 | 37.2900 | 2 | 2 TP53 regulates metabolic genes R-HSA-5628897 | 1.45E-02 | 1.00E+00 | 3.21 | 13.6 |
| 3 | Complex I biogenesis R-HSA-6799198 | 0.0256 | 1.0000 | 3.8100 | 13.9600 | 3 | Phosphate bond hydrolysis by NTPDase proteins R-HSA | 1.52E-02 | 1.00E+00 | 13.32 | 55.77 |
| 4 | Vitamin D (Calciferol) metabolism R-HSA-196791 | 0.0276 | 1.0000 | 8.9300 | 32.0600 | 4 | Conjugation of salicylate with glycine R-HSA-177128 | 1.52E-02 | 1.00E+00 | 13.32 | 55.77 |
| 5 | Tight junction interactions R-HSA-420029 | 0.0277 | 1.0000 | 4.9700 | 17.8200 | 5 | BB some-mediated cargo-targeting to cilium R-HSA-56 | 1.80E-02 | 1.00E+00 | 6 | 24.12 |
| 6 | Citric acid (TCA) cycle and respiratory electron transport | 0.0281 | 1.0000 | 2.3200 | 8.2900 | 6 | Amino acid conjugation R-HSA-156587 | 1.92E-02 | 1.00E+00 | 11.42 | 45.11 |
| 7 | Respiratory electron transport, ATP synthesis by chemiosmo | 0.0374 | 1.0000 | 2.5400 | 8.3400 | 7 | Folding of actin by CCT/TriC R-HSA-390450 | 2.37E-02 | 1.00E+00 | 9.99 | 37.4 |
| 8 | Regulation of innate immune responses to cytosolic DNA R- | 0.0420 | 1.0000 | 6.8700 | 21.7700 | 8 | Triglyceride biosynthesis R-HSA-75109 | 4.49E-02 | 1.00E+00 | 6.66 | 20.67 |
| 9 | Meiosis R-HSA-1500620 | 0.0448 | 1.0000 | 2.7000 | 8.3800 | 9 | Nucleotide Catabolism R-HSA-8956319 | 5.37E-02 | 1.00E+00 | 3.75 | 10.97 |
| 10 | Respiratory electron transport R-HSA-611105 | 0.0485 | 1.0000 | 2.6300 | 7.9700 | 10 | Cooperation of PDCL (PhLP1) and TRiC/CCT In G-protein | 6.15E-02 | 1.00E+00 | 3.53 | 9.84 |
| DisGeNET | |||||||||||
| 1 | Central retinal vein occlusion | 0.0026 | 0.9819 | 13.4200 | 80.0600 | 1 | Myeloid metaplasia | 5.70E-03 | 1.00E+00 | 26.65 | 137.69 |
| 2 | Transient ischemic Attack | 0.0033 | 0.9819 | 2.7800 | 15.8400 | 2 | Congenital amegakaryocytic thrombocytopenia | 8.42E-03 | 1.00E+00 | 19.99 | 95.48 |
| 3 | Angina, unstable | 0.0041 | 0.9819 | 4.2800 | 23.5400 | 3 | Retinoic acid syndrome | 1.06E-02 | 1.00E+00 | 7.51 | 34.14 |
| 4 | Speech sound disorders | 0.0046 | 0.9819 | 29.7700 | 160.0600 | 4 | Absence of scalp hair | 1.16E-02 | 1.00E+00 | 15.99 | 71.26 |
| 5 | Familial thrombotic thrombocytopenic Purpura | 0.0046 | 0.9819 | 29.7700 | 160.0600 | 5 | Loss of scalp hair | 1.16E-02 | 1 | 15.99 | 71.26 |
| 6 | Haemophilic arthropathy | 0.0046 | 0.9819 | 29.7700 | 160.0600 | 6 | Dysglycaemia | 1.52E-02 | 1 | 13.32 | 55.77 |
| 7 | Somnolence | 0.0067 | 0.9819 | 8.9500 | 44.7100 | 7 | Hunger | 1.59E-02 | 1 | 6.32 | 26.16 |
| 8 | Spinal muscular atrophy, Jerash type | 0.0068 | 0.9819 | 22.3200 | 111.3100 | 8 | Tinnitus | 1.59E-02 | 1 | 6.32 | 26.16 |
| 9 | Cataract and cardiomyopathy | 0.0068 | 0.9819 | 22.3200 | 111.3100 | 9 | Ragged-red muscle fibers | 1.76E-02 | 1 | 4.33 | 17.49 |
| 10 | Hypodysfibrinogenaemia | 0.0068 | 0.9819 | 22.3200 | 111.3100 | 10 | Xerocytosis | 1.92E-02 | 1 | 11.42 | 45.11 |
| Drug perturbations from GEO up | Drug perturbations from GEO down | ||||||||||
| 1 | Coenzyme Q10 5281915 mouse GSE15129 sample 3454 | 0.0042 | 0.9998 | 2.3600 | 12.9100 | 1 | Androstanolone 10635 human GSE7868 sample 3411 | 6.68E-02 | 1.00E+00 | 1.72 | 4.66 |
| 2 | Sevoflurane DB01236 human GSE4386 sample 2816 | 0.0061 | 0.9998 | 2.0700 | 10.5500 | 2 | 2 imatinib DB00619 human GSE1922 sample 2520 | 8.52E-02 | 1.00E+00 | 1.6 | 3.95 |
| 3 | Phosgene 6371 mouse GSE2565 sample 3613 | 0.0194 | 0.9998 | 1.9300 | 7.6200 | 3 | Soman 7305 rat GSE13428 sample 2633 | 9.92E-02 | 1.00E+00 | 2.11 | 4.87 |
| 4 | Rosiglitazone DB00412 mouse GSE2431 sample 2808 | 0.0229 | 0.9998 | 2.1600 | 8.1700 | 4 | Imatinib DB00619 human GSE1922 sample 2516 | 1.15E-01 | 1.00E+00 | 1.48 | 3.2 |
| 5 | Ubiquinol 9962735 mouse GSE15129 sample 3451 | 0.0236 | 0.9998 | 2.1500 | 8.0700 | 5 | Imatinib DB00619 human GSE1922 sample 2457 | 1.46E-01 | 1.00E+00 | 1.47 | 2.82 |
| 6 | Estradiol DB00783 human GSE11352 sample 2729 | 0.0266 | 0.9998 | 1.8100 | 6.5500 | 6 | 3,3’,4,4’- Tetrachlorobiphenyl 36187 human GSE6878 sa | 1.46E-01 | 1.00E+00 | 1.47 | 2.82 |
| 7 | Resveratrol DB02709 mouse GSE7111 sample 3496 | 0.0365 | 0.9998 | 1.8100 | 5.9800 | 7 | Imatinib DB00619 human GSE1922 sample 2512 | 1.48E-01 | 1.00E+00 | 1.46 | 2.79 |
| 8 | Bisphenol A 6623 human GSE17624 sample 2658 | 0.0438 | 0.9998 | 1.6500 | 5.1700 | 8 | EPZ004777 56962336 human GSE29828 sample 2649 | 1.58E-01 | 1.00E+00 | 1.42 | 2.62 |
| 9 | Puromycin, EC50, 1 d 439530 human GSE6930 sample 3268 | 0.0518 | 0.9998 | 1.8600 | 5.5200 | 9 | Imatinib DB00619 human GSE1922 sample 2517 | 1.60E-01 | 1.00E+00 | 1.41 | 2.59 |
| 10 | RPI-1 1749978 human GSE49414 sample 3173 | 0.0525 | 0.9998 | 1.8000 | 5.3000 | 10 | Hypochlorous acid 24341 mouse GSE15457 sample | 1.62E-01 | 1.00E+00 | 1.5 | 2.72 |
| DSigDB | |||||||||||
| 1 | Alvespimycin MCF7 up | 0.0117 | 1.0000 | 3.9300 | 17.5000 | 1 | Benzidine CTD 00001406 | 0.002727 | 1 | 13.35 | 78.81 |
| 2 | Apigenin MCF7 down | 0.0124 | 1.0000 | 3.3200 | 14.6000 | 2 | 2-acetamidofluorene CTD 00007023 | 0.002992 | 1 | 7.64 | 44.39 |
| 3 | Tanespimycin MCF7 up | 0.0124 | 1.0000 | 3.3200 | 14.6000 | 3 | Propanil CTD 00004257 | 0.005339 | 1 | 10.01 | 52.37 |
| 4 | Diallyl disulfide CTD 00001321 | 0.0145 | 1.0000 | 4.5900 | 19.4400 | 4 | 2,4-dichlorophenoxyacetic acid CTD 00007028 | 0.006453 | 1 | 9.24 | 46.59 |
| 5 | Vitamin B12 BOSS | 0.0169 | 1.0000 | 4.3700 | 17.8200 | 5 | 2,4-Diisocyanato-1-methylbenzene CTD 00006908 | 0.007433 | 1 | 5.73 | 28.07 |
| 6 | 2H-1-Benzopyran-2-one, 7-[(3,7-dimethyl- 2,6-octadienyl) oxy | 0.0170 | 1.0000 | 6.1000 | 24.8500 | 6 | Betamethasone CTD 00005504 | 0.007695 | 1 | 8.58 | 41.75 |
| 7 | Geldanamycin PC3 UP | 0.0182 | 1.0000 | 4.2600 | 17.0800 | 7 | 76180-96-6 CTD 00001374 | 0.009068 | 1 | 8.01 | 37.65 |
| 8 | Geldanamycin MCF7 UP | 0.0185 | 1.0000 | 3.0200 | 12.0800 | 8 | Tyrphostin AG-825 MCF7 UP | 0.01022 | 1 | 5.17 | 23.7 |
| 9 | 0297417-0002B PC3 DOWN | 0.0212 | 1.0000 | 3.3400 | 12.9000 | 9 | p-Phenylenediamine CTD 00001400 | 0.01101 | 1 | 4.01 | 18.09 |
| 10 | Okadaic acid CTD 00007275 | 0.0231 | 1.0000 | 2.8600 | 10.7800 | 10 | Diethyl phthalate CTD 00000348 | 0.01222 | 1 | 7.06 | 31.11 |
SARS-CoV-2, severe acute respiratory syndrome coronavirus 2; MERS, middle east respiratory syndrome coronavirus; OR, odd’s ratio; ALS, amyotrophic lateral sclerosis; SLE, systemic lupus erythematosus; R-HSA, R-HSA Reactome Pathway ID; TCA, citric acid ATP, adenosine triphosphate; PDCL, phosducin-like protein; CCT, chaperonin containing TCP1; CTD, comparative toxicogenomics database
| Up-regulated genes (1114) | Down-regulated genes (1138) | ||||||||||
|---|---|---|---|---|---|---|---|---|---|---|---|
| Index | Name | P | Adjusted P | OR | Combined score | Index | Name | P | Adjusted P | OR | Combined score |
| COVID-19-related gene sets 2021 | |||||||||||
| 1 | SARS perturbation; 280 up genes from GEN3VA; human PBM | 3.83E-58 | 1.77E-55 | 11.3 | 1493.62 | 1 | 1 COVID-19 patients PBMC down | 4.57E-18 | 2.05E-15 | 5.64 | 225.16 |
| 2 | 500 genes up-regulated by SARS-CoV-2 in human lung cells fr | 1.34E-47 | 2.98E-45 | 6.28 | 677.82 | 2 | Top 500 down genes for SARS-CoV-2 infection in Rhesu | 1.10E-13 | 2.48E-11 | 3.09 | 92.22 |
| 3 | 500 genes upregulated by SARS-CoV-2 in human lung tissue f | 2.58E-47 | 2.98E-45 | 6.48 | 695.65 | 3 | SARS perturbation; 220 Down Genes from GEN3VA; Hu | 2.26E-13 | 3.38E-11 | 4.34 | 126.48 |
| 4 | Healthy human lung biopsy versus COVID-19 infected human lun | 2.58E-47 | 2.98E-45 | 6.48 | 695.65 | 4 | Top 500 down genes for SARS-CoV-2 infection in Rhesu | 1.16E-08 | 1.30E-06 | 2.5 | 45.75 |
| 5 | COVID-19 patients PBMC up | 9.33E-33 | 8.62E-31 | 4.76 | 351.25 | 5 | Top 500 down genes for SARS-CoV-2 infection in Rhesu | 9.68E-07 | 8.69E-05 | 2.24 | 31.02 |
| 6 | Top 500 up genes for SARS-CoV-2 infection in Rhesus macaqu | 2.61E-27 | 2.01E-25 | 4.46 | 272.99 | 6 | Top 500 down genes for SARS-CoV-2 infection in Rhesu | 2.41E-05 | 1.81E-03 | 2.01 | 21.39 |
| 7 | Top 500 down genes for SARS-CoV-2 infection in Rhesus mac | 1.18E-20 | 7.77E-19 | 3.84 | 176.18 | 7 | 7Top 500 up genes for SARS-CoV-2 infection in Rhesus m | 6.11E-05 | 3.92E-03 | 1.92 | 18.58 |
| 8 | Top 500 up genes for SARS-CoV-2 infection in Rhesus macaqu | 5.20E-20 | 3.00E-18 | 3.77 | 167.31 | 8 | Top 500 down genes for SARS-CoV-2 infection in Rhesu | 1.49E-04 | 0.008365 | 1.88 | 16.54 |
| 9 | Top 500 up genes for SARS-CoV-2 early infection in human m | 2.42E-16 | 1.24E-14 | 3.26 | 117.4 | 9 | Top 500 up genes for SARS-CoV-2 infection in Rhesus m | 3.79E-04 | 0.01892 | 1.8 | 14.21 |
| 10 | Top 500 up genes for SARS-CoV-2 infection in Rhesus macaqu | 1.71E-15 | 7.43E-14 | 3.28 | 111.42 | 10 | Top 500 down genes in human lung AT2 cells organoids | 2.12E-03 | 0.09522 | 1.69 | 10.43 |
| HMDB metabolites | |||||||||||
| 1 | 1,4-naphthalenedione, 2-methyl- (HMDB01892) | 0.0005809 | 0.8304 | 7.3 | 54.39 | 1 | 1-(1Z-hexadecenyl)-sn-glycero-3 - phosphoethanolamine | 0.080 | 0.3953 | 2.66 | 6.71 |
| 2 | Glucose 6-phosphate (HMDB01401) | 0.001873 | 0.8304 | 7.09 | 44.54 | 2 | 1-hexadecyl-2-(9Z-octadecenoyl) - sn-glycero-3-phospho | 0.07995 | 0.3953 | 2.66 | 6.71 |
| 3 | C10H13N2O7P (HMDB01570) | 0.002304 | 0.8304 | 9.72 | 59.03 | 3 | PE (P-16:0/14:0) (HMDB11335) | 0.07995 | 0.3953 | 2.66 | 6.71 |
| 4 | Iron (HMDB00692) | 0.002596 | 0.8304 | 2.09 | 12.45 | 4 | PE (P-16:0/14:1 (9Z)) (HMDB11336) | 0.07995 | 0.3953 | 2.66 | 6.71 |
| 5 | C6H12O6 (HMDB00516) | 0.004564 | 0.8304 | 7.56 | 40.74 | 5 | PE (P-16:0/15:0) (HMDB11337) | 0.07995 | 0.3953 | 2.66 | 6.71 |
| 6 | TMP (HMDB01227) | 0.004564 | 0.8304 | 7.56 | 40.74 | 6 | PE (P-16:0/16:1 (9Z)) (HMDB11339) | 0.07995 | 0.3953 | 2.66 | 6.71 |
| 7 | C6H12O6 (HMDB03345) | 0.005115 | 0.8304 | 5.32 | 28.05 | 7 | 7PE (P-16:0/18:0) (HMDB11340) | 0.07995 | 0.3953 | 2.66 | 6.71 |
| 8 | Zinc (HMDB01303) | 0.005658 | 0.8304 | 2.64 | 13.68 | 8 | PEP-16:0/18:1 (11Z)) (HMDB11341) | 0.07995 | 0.3953 | 2.66 | 6.71 |
| 9 | Hexadecanoyl-CoA (HMDB01338) | 0.01111 | 0.8304 | 4.25 | 19.14 | 9 | PE (P-16:0/18:1 (9Z)) (HMDB11342) | 0.07995 | 0.3953 | 2.66 | 6.71 |
| 10 | Ammonia (HMDB00051) | 0.01189 | 0.8304 | 2.84 | 12.58 | 10 | PE (P-16:0/18:2 (9Z,12Z)) (HMDB11343) | 0.07995 | 0.3953 | 2.66 | 6.71 |
| Disease perturbations from GEO up | Disease perturbations from GEO down | ||||||||||
| 1 | Septic shock C0036983 human GSE9692 sample 307 | 5.97E-121 | 5.01E-118 | 13.71 | 3794.19 | 1 | H1N1 DOID-0050211 human GSE27131 sample 514 | 2.59E-60 | 2.17E-57 | 17.64 | 2420.53 |
| 2 | H1N1 DOID-0050211 human GSE27131 sample 514 | 1.33E-65 | 5.58E-63 | 8.78 | 1311.73 | 2 | Acute myeloid leukaemia DOID-9119 human GSE9476 sa | 4.18E-19 | 1.75E-16 | 3.73 | 157.84 |
| 3 | SARS C1175175 human | 1.39E-55 | 3.87E-53 | 14.41 | 1820.39 | 3 | Huntington’s disease DOID-12858 human GSE24250 sa | 1.97E-16 | 5.51E-14 | 4.16 | 150.49 |
| 4 | Overexertion C0161750 human GSE3606 sample 286 | 3.86E-53 | 8.09E-51 | 9.91 | 1196.61 | 4 | Autism-spectrum disorder DOID-0060041 human GSE25 | 6.31E-14 | 1.32E-11 | 3.83 | 116.36 |
| 5 | sJIA DOID-848 human | 3.42E-47 | 5.74E-45 | 7.5 | 802.88 | 5 | Sarcoidosis DOID-11335 human GSE19314 sample 708 | 1.05E-13 | 1.76E-11 | 3.61 | 107.75 |
| 6 | Rheumatoid arthritis DOID-7148 human GSE15573 sample 90 | 9.83E-42 | 1.38E-39 | 8.25 | 778.8 | 6 | sJIA DOID-848 hu | 1.60E-12 | 2.03E-10 | 3.97 | 107.92 |
| 7 | Polycystic ovary syndrome DOID-11612 human GSE34526 sa | 6.08E-38 | 7.29E-36 | 6.23 | 533.44 | 7 | JRA - C0553662 human G | 1.69E-12 | 2.03E-10 | 3.63 | 98.37 |
| 8 | Multiple sclerosis DOID-2377 human GSE26484 sample 742 | 2.19E-37 | 2.29E-35 | 7.72 | 651.32 | 8 | Multiple sclerosis DOID-2377 human GSE23832 sample | 2.22E-12 | 2.33E-10 | 3.72 | 99.78 |
| 9 | Non-sJIA (subgroup-RF) | 3.65E-37 | 3.40E-35 | 6.38 | 534.97 | 9 | Purpura, Idiopathic Thrombocytopenic C0043117 huma | 1.51E-11 | 1.41E-09 | 7.89 | 196.62 |
| 10 | Huntington’s disease DOID-12858 human GSE8762 sample 9 | 6.61E-35 | 5.54E-33 | 5.48 | 431.65 | 10 | Septic Shock C0036983 human GSE9692 sample 307 | 1.59E-10 | 1.34E-08 | 5.49 | 123.84 |
| WikiPathway 2021 human | |||||||||||
| 1 | Complement and coagulation cascades WP558 | 9.54E-09 | 4.61E-06 | 7.12 | 131.55 | 1 | Cytoplasmic ribosomal proteins WP477 | 9.56E-11 | 3.77E-08 | 6.23 | 143.73 |
| 2 | Complement system WP2806 | 6.60E-08 | 0.00001595 | 4.76 | 78.62 | 2 | Pathogenesis of SARS-CoV-2 mediated by nsp9-nsp10 C | 6.78E-08 | 1.34E-05 | 15.19 | 250.78 |
| 3 | Spinal cord Injury WP2431 | 7.74E-06 | 0.0009509 | 3.5 | 41.25 | 3 | Modulators of TCR signalling and T-cell activation WP50 | 1.15E-06 | 1.51E-04 | 5.46 | 74.72 |
| 4 | Signal transduction through IL1R WP4496 | 0.000007875 | 0.0009509 | 7.43 | 87.3 | 4 | TCR and Co-stimulatory Signalling WP2583 | 2.15E-05 | 1.92E-03 | 7.51 | 80.71 |
| 5 | Vitamin D receptor pathway WP2877 | 0.00002759 | 0.0024 | 2.74 | 28.75 | 5 | Cancer immunotherapy by PD-1 blockade WP4585 | 2.44E-05 | 0.001921 | 8.9 | 94.49 |
| 6 | IL1 and megakaryocytes in obesity WP2865 | 0.00002981 | 0.0024 | 8.53 | 88.9 | 6 | Allograft Rejection WP2328 | 0.0001395 | 0.008935 | 3.39 | 30.11 |
| 7 | Extracellular vesicles in the crosstalk of cardiac cells WP4300 | 0.00004549 | 0.003049 | 9.95 | 99.44 | 7 | TCR signaling pathway WP69 | 0.0001587 | 0.008935 | 3.35 | 29.27 |
| 8 | Microglia pathogen phagocytosis pathway WP3937 | 0.0000505 | 0.003049 | 5.69 | 56.33 | 8 | T-Cell antigen receptor (TCR) pathway during staphylo | 0.0006741 | 0.0332 | 3.6 | 26.29 |
| 9 | Metabolic reprogramming in colon cancer WP4290 | 0.00007919 | 0.00425 | 5.34 | 50.4 | 9 | Development and heterogeneity of the ILC family WP38 | 0.001819 | 0.07963 | 4.66 | 29.42 |
| 10 | Glycolysis in senescence WP5049 | 0.0001851 | 0.008623 | 14.19 | 121.93 | 10 | FOXP3 in COVID-19 WP5063 | 0.008588 | 0.3384 | 6.04 | 28.76 |
| KEGG 2021 human | |||||||||||
| 1 | Neutrophil extracellular trap formation | 3.00E-10 | 8.64E-08 | 3.95 | 86.52 | 1 | Hematopoietic cell lineage | 1.43E-14 | 3.89E-12 | 7.37 | 235.09 |
| 2 | Complement and coagulation cascades | 5.45E-09 | 6.23E-07 | 5.65 | 107.52 | 2 | Th17 cell differentiation | 1.99E-10 | 2.71E-08 | 5.42 | 121.09 |
| 3 | Osteoclast differentiation | 6.49E-09 | 6.23E-07 | 4.44 | 83.8 | 3 | Primary immunodeficiency | 8.68E-10 | 7.87E-08 | 10.94 | 228.27 |
| 4 | S. aureus infection | 1.01E-06 | 0.00007269 | 4.29 | 59.29 | 4 | Th1 and Th2 cell differentiation | 6.75E-09 | 4.59E-07 | 5.29 | 99.57 |
| 5 | Leishmaniasis | 4.22E-06 | 0.0002432 | 4.5 | 55.65 | 5 | Inflammatory bowel disease | 1.33E-08 | 7.23E-07 | 6.43 | 116.69 |
| 6 | Legionellosis | 1.14E-05 | 0.0005492 | 5.06 | 57.53 | 6 | Cell adhesion molecules | 2.58E-07 | 1.04E-05 | 3.59 | 54.49 |
| 7 | Malaria | 3.69E-04 | 0.01517 | 4.27 | 33.74 | 7 | Intestinal immune network for IgA production | 2.68E-07 | 1.04E-05 | 6.9 | 104.36 |
| 8 | SLE | 0.0005069 | 0.01777 | 2.63 | 19.99 | 8 | Ribosome | 9.54E-07 | 3.25E-05 | 3.32 | 45.99 |
| 9 | Coronavirus disease | 0.0005552 | 0.01777 | 2.17 | 16.24 | 9 | Asthma | 5.05E-06 | 1.53E-04 | 7.95 | 97 |
| 10 | Starch and sucrose metabolism | 0.0006756 | 0.01946 | 4.87 | 35.56 | 10 | Antigen processing and presentation | 2.87E-05 | 7.80E-04 | 3.99 | 41.69 |
| Reactome 2016 | |||||||||||
| 1 | Neutrophil degranulation R-HSA-6798695 | 4.79E-38 | 6.03E-35 | 5.52 | 474.74 | 1 | Immunoregulatory interactions between a lymphoid A | 1.04E-09 | 4.94E-07 | 4.75 | 98.26 |
| 2 | Innate immune system R-HSA-168249 | 4.30E-25 | 2.71E-22 | 3 | 168.22 | 2 | NMD independent of exon | 1.21E-09 | 4.94E-07 | 5.62 | 115.38 |
| 3 | Immune system R-HSA-168256 | 4.21E-19 | 1.77E-16 | 2.18 | 92.29 | 3 | Peptide chain elongation R-HSA-156902 | 1.72E-09 | 4.94E-07 | 5.79 | 116.85 |
| 4 | Hemostasis R-HSA-109582 | 3.81E-11 | 1.20E-08 | 2.56 | 61.49 | 4 | PD-1 signaling R-HSA-389948 | 4.01E-09 | 4.94E-07 | 18.4 | 355.74 |
| 5 | Platelet degranulation R-HSA-114608 | 9.56E-10 | 2.41E-07 | 4.76 | 98.9 | 5 | Eukaryotic translation elongation R-HSA-156842 | 4.34E-09 | 4.94E-07 | 5.45 | 104.91 |
| 6 | Response to elevated platelet cytosolic Ca2+R-HSA-76005 | 2.39E-09 | 4.52E-07 | 4.53 | 89.92 | 6 | Eukaryotic translation termination R-HSA-72764 | 4.34E-09 | 4.94E-07 | 5.45 | 104.91 |
| 7 | Platelet activation, signaling and aggregation R-HSA-76002 | 2.51E-09 | 4.52E-07 | 3.25 | 64.35 | 7 | Selenocysteine synthesis R-HSA-2408557 | 4.34E-09 | 4.94E-07 | 5.45 | 104.91 |
| 8 | Extracellular matrix organization R-HSA-1474244 | 3.39E-07 | 0.00004869 | 2.68 | 39.96 | 8 | Viral mRNA translation R-HSA-192823 | 4.34E-09 | 4.94E-07 | 5.45 | 104.91 |
| 9 | Cell surface interactions at vascular wall R-HSA-202733 | 3.48E-07 | 0.00004869 | 3.76 | 55.89 | 9 | Response of EIF2AK4 (GCN2) to amino acid deficiency | 4.54E-09 | 4.94E-07 | 5.17 | 99.27 |
| 10 | Transcriptional regulation of granulopoiesis R-HSA-9616222 | 0.00001705 | 0.002147 | 4.84 | 53.09 | 10 | Translocation of ZAP-70 to immunological synapse R-H | 4.61E-09 | 4.94E-07 | 23.88 | 458.36 |
| DisGeNET | |||||||||||
| 1 | Acute coronary syndrome | 8.55E-16 | 5.43E-12 | 4.42 | 153.2 | 1 | Autoimmune diseases | 1.17E-06 | 3.17E-03 | 1.76 | 23.97 |
| 2 | Sepsis | 7.10E-15 | 2.26E-11 | 3.04 | 98.88 | 2 | Celiac disease | 1.22E-06 | 3.17E-03 | 2.5 | 34.04 |
| 3 | Arteriosclerosis | 2.34E-14 | 4.97E-11 | 2.31 | 72.5 | 3 | Sezary syndrome | 1.66E-05 | 2.89E-02 | 3 | 32.97 |
| 4 | Atherosclerosis | 4.84E-13 | 6.33E-10 | 2.2 | 62.29 | 4 | Immune system diseases | 3.54E-05 | 4.62E-02 | 2.39 | 24.55 |
| 5 | Arthritis | 4.98E-13 | 6.33E-10 | 2.66 | 75.47 | 5 | Peripheral T-cell lymphoma | 5.88E-05 | 0.06137 | 3.09 | 30.13 |
| 6 | Juvenile psoriatic arthritis | 2.18E-12 | 2.30E-09 | 4.87 | 130.73 | 6 | Small lymphocytic lymphoma | 7.61E-05 | 0.06622 | 4.84 | 45.85 |
| 7 | Septicemia | 2.74E-12 | 2.30E-09 | 2.9 | 77.29 | 7 | Autoimmune state | 1.11E-04 | 0.08311 | 5.78 | 52.57 |
| 8 | Lung diseases | 2.89E-12 | 2.30E-09 | 3.12 | 82.78 | 8 | Graves disease | 1.81E-04 | 0.09854 | 2.04 | 17.54 |
| 9 | Juvenile-onset still disease | 8.01E-12 | 5.66E-09 | 4.61 | 117.75 | 9 | 9 immunoglobulin deficiency, late-onset | 2.05E-04 | 0.09854 | 13.87 | 117.81 |
| 10 | Liver cirrhosis, experimental | 2.45E-11 | 1.56E-08 | 2.31 | 56.47 | 10 | Acute myeloid leukemia, minimal differentiation | 2.08E-04 | 0.09854 | 7.29 | 61.82 |
| Drug perturbations from GEO up | |||||||||||
| 1 | Etanercept DB00005 human GSE7524 sample 3295 | 3.17E-34 | 2.87E-31 | 8.32 | 641.69 | 1 | Azathioprine DB00993 human GSE38713 sample 3194 | 1.53E-11 | 1.23E-08 | 3.74 | 93.13 |
| 2 | Soman 7305 rat GSE13428 sample 2635 | 8.05E-26 | 3.64E-23 | 4.26 | 246.04 | 2 | IFN beta-1a DB00060 human GSE26104 sample | 2.73E-11 | 1.23E-08 | 3.97 | 96.63 |
| 3 | Atorvastatin DB01076 human GSE11393 sample 3196 | 9.13E-25 | 2.76E-22 | 5.4 | 299.09 | 3 | LMP-420 497668 human GSE20211 sample 3222 | 2.01E-10 | 5.61E-08 | 3.29 | 73.5 |
| 4 | Soman 7305 rat GSE13428 sample 2637 | 9.38E-23 | 2.12E-20 | 4.12 | 208.95 | 4 | 5-aminosalicylic acid 4075 human GSE38713 sample 31 | 2.49E-10 | 5.61E-08 | 3.04 | 67.21 |
| 5 | Promyelocytic leukemia DB00755 human GSE5007 sample 24 | 1.35E-21 | 2.44E-19 | 4.83 | 232.18 | 5 | 1,2,4-Benzenetriol 10787 human GSE7664 sample 3 | 5.95E-09 | 1.07E-06 | 3.32 | 62.89 |
| 6 | Soman 7305 rat GSE13428 sample 2639 | 3.99E-21 | 6.02E-19 | 3.77 | 177.05 | 6 | Methotrexate DB00563 human GSE41831 sample 2601 | 1.57E-07 | 2.36E-05 | 2.63 | 41.13 |
| 7 | Soman 7305 rat GSE13428 sample 2633 | 1.54E-20 | 1.99E-18 | 3.68 | 167.73 | 7 | Atorvastatin DB01076 human GSE11393 sample 3196 | 6.20E-07 | 7.99E-05 | 2.58 | 36.83 |
| 8 | Soman 7305 rat GSE13428 sample 2640 | 7.23E-20 | 8.17E-18 | 3.51 | 154.72 | 8 | Etanercept DB00005 human GSE7524 sample 3295 | 2.47E-06 | 2.79E-04 | 2.28 | 29.48 |
| 9 | Mycophenolic acid DB01024 human GSE14630 sample 3302 | 1.07E-18 | 1.08E-16 | 4.21 | 174.16 | 9 | Rituximab DB00073 human GSE15490 sample 2577 | 8.80E-06 | 8.83E-04 | 2.33 | 27.18 |
| 10 | Soman 7305 rat GSE13428 sample 2632 | 1.60E-18 | 1.45E-16 | 3.55 | 145.66 | 10 | Resveratrol DB02709 human GSE36930 sample 3497 | 2.40E-05 | 2.17E-03 | 2.25 | 23.89 |
| DSigDB | |||||||||||
| 1 | Tretinoin HL60 up | 3.59E-18 | 1.26E-14 | 4.97 | 199.57 | 1 | 2-Fluoroadenosine BOSS | 0.0004848 | 0.8841 | 3.29 | 25.12 |
| 2 | Etynodiol HL60 up | 9.10E-17 | 1.60E-13 | 12.17 | 449.66 | 2 | AGN-PC-0JHFVD BOSS | 0.000556 | 0.8841 | 2.3 | 17.2 |
| 3 | Mebendazole HL60 up | 3.07E-15 | 3.59E-12 | 3.7 | 123.71 | 3 | Isoguanine BOSS | 0.006662 | 1 | 1.94 | 9.74 |
| 4 | Pergolide HL60 up | 3.06E-13 | 2.68E-10 | 3.59 | 103.52 | 4 | Etilefrine HL60 UP | 0.006912 | 1 | 4.89 | 24.34 |
| 5 | Alclometasone HL60 up | 4.02E-13 | 2.82E-10 | 17.2 | 490.94 | 5 | Ivermectin CTD 00006182 | 0.007788 | 1 | 3.43 | 16.64 |
| 6 | Tetryzoline HL60 up | 1.72E-12 | 1.00E-09 | 5.85 | 158.35 | 6 | Orciprenaline HL60 up | 0.008898 | 1 | 3.33 | 15.72 |
| 7 | Flumetasone HL60 up | 2.65E-12 | 1.33E-09 | 19.81 | 528.17 | 7 | 2-Acetamidofluorene CTD 00007023 | 0.01211 | 1 | 4.16 | 18.35 |
| 8 | Aspirin CTD 00005447 | 4.39E-12 | 1.92E-09 | 2.68 | 70.15 | 8 | Fluoride CTD 00005982 | 0.0134 | 1 | 2.77 | 11.97 |
| 9 | Troglitazone CTD 00002415 | 2.20E-11 | 8.56E-09 | 2.48 | 60.79 | 9 | Betamethasone CTD 00005504 | 0.01368 | 1 | 5.11 | 21.95 |
| 10 | Beclometasone HL60 up | 3.28E-11 | 1.15E-08 | 13.09 | 316.03 | 10 | Diphenylpyraline BOSS | 0.01533 | 1 | 1.88 | 7.85 |
IFN, interferon; S. aureus, Staphylococcus aureus; OR, odds ratio; SARS-CoV-2, severe acute respiratory syndrome coronavirus 2; sJIA, systemic juvenile idiopathic arthritis; SLE, systemic lupus erythematosus; TCR, T-cell receptor; JRA, juvenile rheumatoid arthritis; IL, interleukin; NMD, nonsense-mediated decay; PD, Parkinson’s disease; PBMC, Peripheral blood mononuclear cells; TMP, thymidine monophosphate
| Upregulated genes | Downregulated genes | ||||||||||
|---|---|---|---|---|---|---|---|---|---|---|---|
| Index | Name | P | Adjusted P | OR | Combined score | Index | Name | P | Adjusted P | OR | Combined score |
| COVID-19 related gene sets 2021 | |||||||||||
| 1 | Top 500 up genes for SARS-CoV-2 infection in Rhesus macaqu | 1.05E-83 | 4.87E-81 | 12.22 | 2334.57 | 1 | Top 500 up genes for SARS- CoV-2 infection in Rhesus m | 6.19E-38 | 2.88E-35 | 5.29 | 453.05 |
| 2 | Top 500 up genes for SARS-CoV-2 infection in Rhesus macaqu | 1.94E-80 | 4.49E-78 | 11.94 | 2190.68 | 2 | 500 genes downregulated by MHV-A59 in murine sple | 2.32E-27 | 5.39E-25 | 4.45 | 273.14 |
| 3 | 500 genes upregulated by SARS- CoV-2 in human lung cells fr | 7.04E-72 | 1.09E-69 | 10.53 | 1725.46 | 3 | 500 genes downregulated by MHV-A59 in murine spleen | 3.07E-25 | 4.76E-23 | 4.19 | 236.46 |
| 4 | 500 genes upregulated by SARS- CoV-2 in human lung tissue f | 4.28E-70 | 3.96E-68 | 10.74 | 1716.11 | 4 | Top 500 up genes for SARS- CoV-2 infection in Rhesus m | 1.65E-24 | 1.91E-22 | 4.07 | 223.04 |
| 5 | Healthy human lung biopsy versus COVID-190-infected human lung | 4.28E-70 | 3.96E-68 | 10.74 | 1716.11 | 5 | Top 500 up genes for SARS- CoV-2 late-stage infection in | 2.80E-24 | 2.61E-22 | 3.9 | 211.24 |
| 6 | Top 500 up genes for SARS-CoV-2 infection in Rhesus macaque | 1.59E-66 | 1.23E-64 | 10.08 | 1527.33 | 6 | Top 500 down genes for SARS- CoV-2 early infection in h | 2.15E-22 | 1.66E-20 | 3.72 | 185.4 |
| 7 | COVID-19 patients PBMC up | 4.71E-66 | 3.12E-64 | 9.49 | 1426.89 | 7 | Top 500 down genes for SARS- CoV-2 infection in Rhesus | 6.40E-22 | 4.25E-20 | 3.85 | 187.65 |
| 8 | Top 500 up genes for SARS-CoV-2 infection in Rhesus macaque | 4.52E-65 | 2.62E-63 | 9.84 | 1457.98 | 8 | Top 500 up genes for SARS- CoV-2 infection in Rhesus m | 8.06E-21 | 4.69E-19 | 3.74 | 173.03 |
| 9 | SARS-CoV perturbation; 402 Up Genes from GEN3VA; Human | 6.89E-65 | 3.54E-63 | 11.79 | 1742.21 | 9 | 500 genes down-regulated by SARS-CoV-2 in human lungs | 3.67E-19 | 1.71E-17 | 3.45 | 146.45 |
| 10 | Top 500 up genes for SARS-CoV-2 infection 48 hpi in human a | 4.02E-62 | 1.86E-60 | 9.72 | 1374.45 | 10 | Healthy human lung biopsy versus COVID-19 infected human | 3.67E-19 | 1.71E-17 | 3.45 | 146.45 |
| HMDB metabolites | |||||||||||
| 1 | Carbon dioxide (HMDB01967) | 0.0006762 | 0.213 | 3.51 | 25.61 | 1 | D-Ribose 5-phosphate (HMDB01548) | 0.02627 | 0.5678 | 5.74 | 20.9 |
| 2 | TMP (HMDB01227) | 0.001186 | 0.213 | 11.14 | 75.04 | 2 | CTP (HMDB00082) | 0.03035 | 0.5678 | 2.79 | 9.74 |
| 3 | Hexadecanoyl-CoA (HMDB01338) | 0.002348 | 0.213 | 6.27 | 37.95 | 3 | Phosphoric acid (HMDB02142) | 0.03164 | 0.5678 | 1.56 | 5.38 |
| 4 | Coenzyme A (HMDB01423) | 0.003889 | 0.213 | 2.93 | 16.23 | 4 | Pyrophosphate (HMDB00250) | 0.03288 | 0.5678 | 1.55 | 5.3 |
| 5 | Hydrochloric acid standard solution (HMDB02306) | 0.006482 | 0.213 | 6.26 | 31.55 | 5 | Riboflavin (HMDB00244) | 0.03346 | 0.5678 | 5.11 | 17.35 |
| 6 | C10H13N2O7P (HMDB01570) | 0.007466 | 0.213 | 9.39 | 45.96 | 6 | UTP (HMDB00285) | 0.03774 | 0.5678 | 2.63 | 8.61 |
| 7 | Sulfate (HMDB01448) | 0.01177 | 0.213 | 4.04 | 17.96 | 7 | D-ribulose 5-phosphate (HMDB00618) | 0.04156 | 0.5678 | 4.59 | 14.61 |
| 8 | C6H12O6 (HMDB00516) | 0.01222 | 0.213 | 7.51 | 33.07 | 8 | Adenosine monophosphate (HMDB00045) | 0.05434 | 0.5678 | 1.51 | 4.39 |
| 9 | NAP (HMDB00217) | 0.01467 | 0.213 | 2.08 | 8.8 | 9 | Acetic acid (HMDB00042) | 0.09921 | 0.5678 | 2.45 | 5.66 |
| 10 | Palmitic acid (HMDB00220) | 0.01511 | 0.213 | 6.82 | 28.61 | 10 | C11H22O22P4 (HMDB04249) | 0.0994 | 0.5678 | 1.78 | 4.1 |
| Disease perturbations from GEO up | Disease perturbations from GEO down | ||||||||||
| 1 | Septic shock C0036983 human GSE9692 sample 307 | 1.94E-118 | 1.62E-115 | 16.68 | 4521.5 | 1 | H1N1 DOID-0050211 human GSE27131 sample 514 | 1.43E-40 | 1.20E-37 | 11.23 | 1030.54 |
| 2 | Dengue disease DOID-12205 human GSE51808 sample 556 | 1.20E-97 | 5.02E-95 | 17.24 | 3848.02 | 2 | Huntington’s disease DOID- 12858 human GSE24250 sa | 2.87E-33 | 1.21E-30 | 6.41 | 480.1 |
| 3 | Dengue haemorrhagic fever DOID- 12206 human GSE51808 sa | 2.70E-89 | 7.53E-87 | 15.78 | 3218.14 | 3 | Autism-spectrum disorder DOID-0060041 human GSE25 | 3.35E-30 | 9.36E-28 | 6.08 | 412.86 |
| 4 | Dengue fever DOID-12206 human GSE51808 sample 447 | 1.09E-74 | 2.28E-72 | 14.55 | 2478.13 | 4 | Huntington’s disease DOID- 12858 human GSE24250 sa | 6.76E-29 | 1.42E-26 | 4.98 | 323.02 |
| 5 | H1N1 DOID-0050211 human GSE27131 sample 514 | 2.74E-72 | 4.59E-70 | 11.66 | 1921.89 | 5 | SLE DOID-9074 human GSE1 | 4.06E-27 | 6.82E-25 | 5.64 | 342.78 |
| 6 | Swine influenza DOID-0050211 human GSE48466 sample 498 | 2.15E-58 | 3.00E-56 | 13.13 | 1743.57 | 6 | PD DOID-14330 human GSE6613 samp | 5.25E-26 | 7.35E-24 | 5.07 | 294.89 |
| 7 | Autism-spectrum disorder DOID-0060041 human GSE25507 s | 4.84E-52 | 5.79E-50 | 10.97 | 1296.53 | 7 | Pulmonary hypertension C0020542 human GSE703 sam | 3.86E-25 | 4.63E-23 | 7.41 | 416.68 |
| 8 | West Nile fever DOID-2366 human GSE30719 sample 874 | 2.92E-51 | 3.06E-49 | 7.61 | 885.62 | 8 | Dengue fever DOID-12206 human GSE51808 sample 4 | 1.39E-24 | 1.46E-22 | 5.5 | 302.08 |
| 9 | SLE DOID-9074 human GSE10325 | 1.15E-43 | 1.07E-41 | 8.21 | 811.35 | 9 | SLE DOID-9074 human GSE6 | 5.03E-24 | 4.69E-22 | 5.1 | 273.83 |
| 10 | Dermatomyositis DOID-10223 human GSE48280 sample 705 | 1.30E-43 | 1.09E-41 | 7.71 | 761.66 | 10 | SARS C1175175 h | 3.50E-22 | 2.82E-20 | 4.09 | 201.91 |
| WikiPathway 2021 Human | |||||||||||
| 1 | Immune response to tuberculosis WP4197 | 3.01E-13 | 1.42E-10 | 32.96 | 950.33 | 1 | Cytoplasmic Ribosomal Proteins WP477 | 6.37E-18 | 3.07E-15 | 9.23 | 365.43 |
| 2 | Type II IFN signalling (IFNG) WP619 | 2.29E-12 | 5.39E-10 | 17.32 | 464.28 | 2 | Modulators of TCR signalling and T-cell activation WP50 | 9.14E-08 | 2.20E-05 | 5.98 | 96.84 |
| 3 | Host-pathogen interaction of human coronaviruses - interfer | 5.90E-12 | 9.27E-10 | 18.7 | 483.46 | 3 | VEGFA-VEGFR2 signalling pathway WP3888 | 5.71E-06 | 9.16E-04 | 2.09 | 25.25 |
| 4 | Type I IFN induction and signaling during SARS-CoV-2 i | 4.08E-11 | 4.80E-09 | 18.3 | 437.9 | 4 | Translation factors WP107 | 1.11E-05 | 1.33E-03 | 5.14 | 58.64 |
| 5 | Retinoblastoma gene in cancer WP2446 | 8.57E-11 | 8.08E-09 | 7.62 | 176.55 | 5 | IL-18 signalling pathway WP4754 | 2.76E-05 | 0.002351 | 2.29 | 24.09 |
| 6 | Novel intracellular components of RLR p | 6.24E-10 | 4.90E-08 | 9.24 | 195.84 | 6 | TCR signalling pathway WP69 | 0.00002933 | 0.002351 | 3.6 | 37.53 |
| 7 | Non-genomic actions of 1,25 dihydroxyvitamin D3 WP4341 | 8.99E-09 | 6.05E-07 | 7.39 | 136.88 | 7 | TCR and Co-stimulatory signalling WP2583 | 0.00003932 | 0.002535 | 6.92 | 70.22 |
| 8 | Hepatitis B infection WP4666 | 9.23E-08 | 0.000005432 | 4.32 | 69.9 | 8 | Cancer immunotherapy by PD-1 blockade WP4585 | 0.00004217 | 0.002535 | 8.2 | 82.6 |
| 9 | Cell cycle WP179 | 1.64E-07 | 0.000008578 | 4.79 | 74.76 | 9 | Translation inhibitors in chronically activated PDGFRA c | 0.00008128 | 0.004344 | 4.84 | 45.57 |
| 10 | Regulation of toll-like receptor signalling pathway WP1449 | 3.88E-07 | 0.00001715 | 4.28 | 63.13 | 10 | Pathogenesis of SARS-CoV-2 Mediated by nsp9-nsp10 C | 0.0001753 | 0.008431 | 7.68 | 66.44 |
| KEGG 2021 human | |||||||||||
| 1 | NOD-like receptor signalling pathway | 3.42E-16 | 5.20E-14 | 6.45 | 229.57 | 1 | Ribosome | 1.81E-09 | 5.52E-07 | 3.96 | 79.71 |
| 2 | Epstein−Barr virus infection | 3.56E-16 | 5.20E-14 | 6.03 | 214.37 | 2 | Hematopoietic cell lineage | 4.67E-09 | 7.13E-07 | 4.97 | 95.32 |
| 3 | Hepatitis B | 1.29E-10 | 1.25E-08 | 5.13 | 116.9 | 3 | Coronavirus disease | 7.53E-07 | 7.65E-05 | 2.77 | 39 |
| 4 | Influenza A | 2.48E-09 | 1.81E-07 | 4.56 | 90.38 | 4 | Primary immunodeficiency | 1.66E-06 | 1.04E-04 | 7.12 | 94.72 |
| 5 | Measles | 3.48E-09 | 2.03E-07 | 5.07 | 98.67 | 5 | Th17 cell differentiation | 1.86E-06 | 0.000104 | 3.78 | 49.89 |
| 6 | RIG-I-like receptor signaling pathway | 7.22E-09 | 3.38E-07 | 7.53 | 141.07 | 6 | Herpes simplex virus 1 infection | 2.05E-06 | 0.000104 | 2.07 | 27.06 |
| 7 | Hepatitis C | 8.11E-09 | 3.38E-07 | 4.61 | 85.94 | 7 | T-cell receptor signalling pathway | 4.50E-06 | 0.0001961 | 3.68 | 45.35 |
| 8 | TNF signalling pathway | 9.50E-09 | 3.47E-07 | 5.54 | 102.33 | 8 | RNA transport | 7.28E-05 | 0.002642 | 2.52 | 23.97 |
| 9 | Cell cycle | 5.66E-08 | 0.000001838 | 4.9 | 81.72 | 9 | Human T-cell leukaemia virus 1 infection | 0.00007796 | 0.002642 | 2.37 | 22.38 |
| 10 | Lipid and atherosclerosis | 6.99E-08 | 0.000002042 | 3.68 | 60.56 | 10 | Cell adhesion molecules | 0.0002816 | 0.008589 | 2.55 | 20.88 |
| Reactome 2016 | |||||||||||
| 1 | Immune system homo sapiens R-HSA-168256 | 2.76E-25 | 2.77E-22 | 3 | 169.65 | 1 | Gene expression homo sapiens R-HSA-74160 | 1.68E-32 | 1.90E-29 | 2.77 | 202.72 |
| 2 | IFN signalling homo sapiens R-HSA-913531 | 8.04E-21 | 4.02E-18 | 7.36 | 340.75 | 2 | L13a-mediated translational silencing of ceruloplasmin | 9.30E-23 | 3.20E-20 | 9.94 | 504.29 |
| 3 | IFN alpha/beta signaling homo sapiens R-HSA-909733 | 1.68E-18 | 5.61E-16 | 14.95 | 611.96 | 3 | 3’ -UTR-mediated translational regulation homo sapiens | 9.30E-23 | 3.20E-20 | 9.94 | 504.29 |
| 4 | IFN gamma signaling homo sapiens R-HSA-877300 | 7.17E-14 | 1.80E-11 | 8.92 | 270.02 | 4 | Formation of a pool of free 40S subunits homo sapiens | 1.22E-22 | 3.20E-20 | 10.77 | 543.4 |
| 5 | Cytokine signalling in immune system homo sapiens R-HSA-1 | 2.28E-13 | 4.56E-11 | 3.1 | 90.18 | 5 | GTP hydrolysis and joining of the 60S ribosomal subunit | 1.42E-22 | 3.20E-20 | 9.79 | 492.48 |
| 6 | Cell cycle, mitotic homo sapiens R-HSA-69278 | 4.74E-10 | 7.91E-08 | 3.02 | 64.78 | 6 | Cap-dependent translation initiation homo sapiens R-H | 2.59E-22 | 4.17E-20 | 9.2 | 457.17 |
| 7 | Cell cycle homo sapiens R-HSA-1640170 | 8.83E-10 | 1.26E-07 | 2.75 | 57.4 | 7 | Eukaryotic translation initiation homo sapiens R-HSA-7 | 2.59E-22 | 4.17E-20 | 9.2 | 457.17 |
| 8 | Polo-like kinase-mediated events homo sapiens R-HSA-15671 | 4.60E-08 | 0.000005756 | 25.19 | 425.6 | 8 | Major pathway of rRNA processing in the nucleolus Ho | 5.76E-21 | 8.12E-19 | 6.63 | 308.83 |
| 9 | Activated TLR4 signalling homo sapiens R-HSA-166054 | 5.27E-08 | 0.000005857 | 5.2 | 87.13 | 9 | rRNA processing homo sapiens R-HSA-72312 | 6.88E-21 | 8.62E-19 | 6.26 | 290.72 |
| 10 | NF-kB activation through FADD/RIP-1 pathway-mediated by c | 8.24E-08 | 0.000007709 | 35.23 | 574.64 | 10 | Translation homo sapiens R-HSA-72766 | 2.20E-20 | 2.48E-18 | 6.92 | 313.17 |
| DisGeNET | |||||||||||
| 1 | Influenza | 5.05E-27 | 3.35E-23 | 4.67 | 283.01 | 1 | Chronic lymphocytic leukemia | 4.16E-13 | 2.60E-09 | 2.15 | 61.21 |
| 2 | Breast carcinoma | 6.27E-23 | 2.08E-19 | 2.14 | 109.54 | 2 | Malignant neoplasm of breast | 1.27E-09 | 3.97E-06 | 1.47 | 30.14 |
| 3 | Carcinogenesis | 2.70E-21 | 5.97E-18 | 2.15 | 101.94 | 3 | Breast carcinoma | 8.54E-09 | 1.78E-05 | 1.45 | 26.85 |
| 4 | Neoplasm Metastasis | 6.88E-21 | 1.14E-17 | 2.15 | 99.87 | 4 | Leukaemia | 1.24E-08 | 1.93E-05 | 1.65 | 30 |
| 5 | Malignant neoplasm of breast | 2.52E-20 | 3.33E-17 | 2.04 | 92.14 | 5 | Leukaemia, myelocytic, acute | 4.11E-08 | 0.00004293 | 1.66 | 28.22 |
| 6 | Leukemia | 7.39E-20 | 7.72E-17 | 2.5 | 110.15 | 6 | Lymphoma | 4.12E-08 | 0.00004293 | 1.75 | 29.81 |
| 7 | Rheumatoid arthritis | 8.16E-20 | 7.72E-17 | 2.54 | 111.67 | 7 | B-Cell lymphomas | 1.20E-06 | 0.001069 | 1.88 | 25.7 |
| 8 | Asthma | 1.26E-19 | 1.04E-16 | 2.82 | 122.59 | 8 | Diffuse large B-cell lymphoma | 1.42E-06 | 0.001108 | 2 | 26.95 |
| 9 | Lupus erythematosus, systemic | 3.59E-19 | 2.64E-16 | 2.95 | 125.46 | 9 | Carcinogenesis | 1.83E-06 | 0.001128 | 1.38 | 18.26 |
| 10 | Leukemia, myelocytic, acute | 1.17E-18 | 7.75E-16 | 2.53 | 104.52 | 10 | Hodgkin disease | 1.91E-06 | 0.001128 | 1.97 | 25.95 |
| Drug perturbations from GEO up | |||||||||||
| 1 | IFN beta-1a DB00060 human GSE26104 sample 3187 | 6.88E-92 | 6.21E-89 | 15.55 | 3263.45 | 1 | Mycophenolic acid DB01024 human GSE14630 sample | 1.94E-21 | 1.76E-18 | 5.07 | 241.93 |
| 2 | IFN beta-1a DB00060 human GSE26104 sample 3186 | 6.19E-80 | 2.80E-77 | 12.96 | 2362.8 | 2 | Resveratrol DB02709 human GSE36930 sample 3497 | 6.86E-19 | 3.10E-16 | 4.23 | 176.71 |
| 3 | IFN beta-1a DB00060 human GSE26104 sample 3188 | 8.40E-70 | 2.53E-67 | 12.7 | 2019.4 | 3 | Atorvastatin DB01076 human GSE11393 sample 3196 | 6.52E-18 | 1.96E-15 | 4.18 | 165.24 |
| 4 | IFN-β-1b (Betaferon) DB00068 human GSE26104 sam | 9.37E-63 | 2.12E-60 | 11.45 | 1635.45 | 4 | Estradiol DB00783 human GSE4668 sample 2727 | 2.75E-16 | 5.24E-14 | 4.36 | 156.2 |
| 5 | Lipopolysaccharide 11970143 human GSE40885 sample 2475 | 6.24E-55 | 1.13E-52 | 11.23 | 1401.86 | 5 | Estradiol 5757 human GSE4668 sample 3062 | 2.90E-16 | 5.24E-14 | 4.14 | 148.21 |
| 6 | Lipopolysaccharide 11970143 human GSE5504 sample 3485 | 3.06E-48 | 4.60E-46 | 8.34 | 912.38 | 6 | Zinc acetate 11192 human GSE2964 sample 3589 | 3.75E-16 | 5.65E-14 | 5.07 | 180.08 |
| 7 | Quercetin 5280343 human GSE13899 sample 3182 | 6.80E-48 | 8.77E-46 | 10.42 | 1131.79 | 7 | Estradiol 5757 human GSE4668 sample 3063 | 1.05E-15 | 1.35E-13 | 4.43 | 152.66 |
| 8 | Lipopolysaccharide 11970143 human GSE3140 sample 3594 | 1.43E-47 | 1.61E-45 | 9.73 | 1050.07 | 8 | Promyelocytic leukemia DB00755 human GSE5007 sam | 4.05E-15 | 4.57E-13 | 3.86 | 127.79 |
| 9 | IFN beta-1b DB00068 human GSE26104 sample 3185 | 7.44E-45 | 7.46E-43 | 9.32 | 947.01 | 9 | Etanercept DB00005 human GSE7524 sample 3295 | 1.13E-14 | 1.13E-12 | 3.35 | 107.57 |
| 10 | Lipopolysaccharide 11970143 human GSE5504 sample 3486 | 3.38E-43 | 3.05E-41 | 8.34 | 815.19 | 10 | Motexafin gadolinium (4 h) DB05428 human GSE2189 s | 2.19E-14 | 1.98E-12 | 3.68 | 115.78 |
| DSigD | |||||||||||
| 1 | Suloctidil HL60 up | 1.59E-52 | 5.67E-49 | 22.52 | 2685.48 | 1 | 8-azaguanine HL60 down | 7.21E-22 | 2.63E-18 | 2.86 | 139.37 |
| 2 | Cyclosporin A CTD 00007121 | 1.89E-41 | 3.37E-38 | 2.8 | 262.76 | 2 | Methyl methanesulfonate CTD 00006307 | 2.17E-21 | 3.96E-18 | 1.89 | 90.1 |
| 3 | Tetradioxin CTD 00006848 | 7.41E-39 | 8.83E-36 | 2.84 | 249.75 | 3 | Anisomycin HL60 down | 2.69E-17 | 3.26E-14 | 2.46 | 93.7 |
| 4 | Estradiol CTD 00005920 | 2.84E-36 | 2.53E-33 | 2.67 | 218.75 | 4 | Disodium selenite CTD 00007229 | 3.77E-14 | 3.44E-11 | 2.09 | 64.52 |
| 5 | Benzo[a] pyrene CTD 00005488 | 7.50E-33 | 5.36E-30 | 2.54 | 188.03 | 5 | Vitamin E CTD 00006994 | 1.06E-13 | 7.75E-11 | 2.01 | 60.08 |
| 6 | Calcitriol CTD 00005558 | 1.71E-32 | 1.02E-29 | 3.13 | 229.11 | 6 | Cicloheximide HL60 down | 3.17E-13 | 1.93E-10 | 2.52 | 72.55 |
| 7 | Retinoic acid CTD 00006918 | 2.15E-30 | 1.10E-27 | 2.47 | 168.85 | 7 | Meclofenoxate HL60 down | 3.55E-12 | 1.85E-09 | 2.4 | 63.25 |
| 8 | Testosterone CTD 00006844 | 3.59E-29 | 1.60E-26 | 3.49 | 228.76 | 8 | Valproic acid CTD 00006977 | 4.15E-12 | 1.89E-09 | 1.5 | 39.31 |
| 9 | Acetaminophen CTD 00005295 | 3.02E-27 | 1.20E-24 | 2.37 | 144.73 | 9 | Acetaminophen CTD 00005295 | 6.33E-12 | 2.56E-09 | 1.59 | 40.88 |
| 10 | Dasatinib CTD 00004330 | 4.78E-27 | 1.71E-24 | 5.08 | 307.6 | 10 | Etifenin PC3 down | 1.41E-11 | 5.13E-09 | 2.48 | 61.9 |
IFN, interferon; SLE, systemic lupus erythematosus; SARS-CoV-2, severe acute respiratory syndrome coronavirus 2; IL, interleukin; TNF, tumour necrosis factor; TCR, T-cell receptor; OR, odds ratio; GEO, gene expression omnibus; PD, parkinson’s disease; TLR4, toll like receptor 4; RLR, RIG-I-like receptor; HMDB, human metabolome database; TMP, thymidine monophosphate; NAP, Adenine nucleotide phosphate; CTP, chaperonin containing TCP1; UTP, uridine triphosphate; IFNG, interferon gamma; KEGG, Kyoto encyclopedia of genes and genomes; R-HSA, R-HSA reactome pathway ID; NF-kB, nuclear factor kappa B; FADD, fas associated via death domain; GTP, guanosine triphosphate; UTR, untranslated region; CTD, comparative toxicogenomics database
| Upregulated genes | Downregulated genes | ||||||||||
|---|---|---|---|---|---|---|---|---|---|---|---|
| Index | Name | P | Adjusted P | OR | Combined score | Index | Name | P | Adjusted P | OR | Combined score |
| COVID-19 related gene sets 2021 | |||||||||||
| 1 | Top 500 up genes for SARS-CoV-2 late-stage infection in hum | 4.11E-15 | 1.06E-12 | 3.23 | 107.13 | 1 | Top 500 down genes for SARS-CoV-2 middle-stage infe | 5.01E-10 | 2.32E-07 | 2.37 | 50.77 |
| 2 | Top 500 up genes for SARS-CoV-2 early infection in human m | 4.57E-15 | 1.06E-12 | 3.23 | 106.53 | 2 | COVID-19 patients PBMC down | 3.03E-09 | 6.99E-07 | 3.34 | 65.61 |
| 3 | SARS perturbation; 280 Up Genes from GEN3VA; Human PB | 7.97E-15 | 1.23E-12 | 4.26 | 138.35 | 3 | Top 500 up genes for SARS-CoV-2 infection in Rhesus m | 5.69E-09 | 8.23E-07 | 2.31 | 43.84 |
| 4 | 500 genes down-regulated by SARS-CoV-2 in A549-ACE2 cell | 2.98E-12 | 2.87E-10 | 2.97 | 78.95 | 4 | SARS perturbation; 220 down genes from GEN3VA; Hu | 7.52E-09 | 8.23E-07 | 3.11 | 58.1 |
| 5 | 500 genes down-regulated by SARS-CoV-2 (0.2 MOI) in human | 3.09E-12 | 2.87E-10 | 2.91 | 77.24 | 5 | 500 genes upregulated by SARS-CoV-2 in A549-ACE2 c | 8.91E-09 | 8.23E-07 | 2.28 | 42.26 |
| 6 | 500 genes downregulated by MERS-CoV in Calu-3 cells from | 1.07E-11 | 7.91E-10 | 2.9 | 73.32 | 6 | Top 500 downregulated genes in human nasal epithelial cells | 1.44E-08 | 1.11E-06 | 2.29 | 41.42 |
| 7 | 500 genes upregulated by SARS-CoV-2 in A549-ACE2 cells fr | 1.39E-11 | 7.91E-10 | 2.91 | 72.77 | 7 | Top 500 downregulated genes in human nasal epithelial cells | 1.80E-08 | 1.19E-06 | 2.3 | 40.93 |
| 8 | 500 genes upregulated by MHV-A59 in murine liver cells fro | 1.51E-11 | 7.91E-10 | 3.1 | 77.34 | 8 | Top 500 down genes for SARS-CoV-2 early infection in | 3.92E-08 | 2.265E-06 | 2.17 | 37.01 |
| 9 | 500 genes downregulated by MERS-CoV in Calu-3 cells from | 1.54E-11 | 7.91E-10 | 2.87 | 71.56 | 9 | Top 500 up genes for SARS-CoV-2 late-stage infection i | 1.59E-07 | 7.646E-06 | 2.11 | 32.97 |
| 10 | Top 500 downregulated genes in human nasal epithelial cells | 3.07E-11 | 1.43E-09 | 2.91 | 70.33 | 10 | Top 500 down genes for SARS-CoV-2 infection in Rhesus | 1.66E-07 | 7.646E-06 | 2.19 | 34.14 |
| HMDB metabolites | |||||||||||
| 1 | Glucose 6-phosphate (HMDB01401) | 0.001315 | 0.4271 | 7.71 | 51.18 | 1 | N1-Acetylspermine (HMDB01186) | 6.53E-04 | 0.9825 | 10.62 | 77.91 |
| 2 | C18H31NO14S (HMDB00632) | 0.004605 | 0.4271 | 7.4 | 39.81 | 2 | UTP (HMDB00285) | 0.02737 | 0.9825 | 2.62 | 9.44 |
| 3 | F6P (HMDB03971) | 0.009681 | 0.4271 | 5.69 | 26.39 | 3 | Guanosine triphosphate (HMDB01273) | 0.03958 | 0.9825 | 1.35 | 4.38 |
| COVID-19 related gene sets 2021 | |||||||||||
| 4 | Sulfatide (HMDB00024) | 0.01642 | 0.4271 | 6.93 | 28.48 | 4 | Flavin mononucleotide (HMDB01520) | 0.04314 | 0.9825 | 2.89 | 9.1 |
| 5 | C6H12O6 (HMDB00516) | 0.02636 | 0.4271 | 5.54 | 20.16 | 5 | Guanosine diphosphate (HMDB01201) | 0.08642 | 0.9825 | 1.85 | 4.54 |
| 6 | FAD (HMDB01248) | 0.02813 | 0.4271 | 1.81 | 6.45 | 6 | CTP (HMDB00082) | 0.1521 | 0.9825 | 1.87 | 3.53 |
| 7 | Iron (HMDB00692) | 0.04115 | 0.4271 | 1.68 | 5.35 | 7 | Sulfide (HMDB00598) | 0.1874 | 0.9825 | 1.62 | 2.72 |
| 8 | D-Glucose (HMDB00122) | 0.04223 | 0.4271 | 3.36 | 10.64 | 8 | 4-Nitrophenol (HMDB01232) | 0.1891 | 0.9825 | 2.83 | 4.71 |
| 9 | Potassium (HMDB00586) | 0.04973 | 0.4271 | 2.41 | 7.24 | 9 | C33H56N7O17P3S (HMDB03712) | 0.1891 | 0.9825 | 2.83 | 4.71 |
| 10 | 1-(1Z-hexadecenyl)-sn-glycero- 3-phosphoethanolamine (HM) | 0.05951 | 0.4271 | 2.96 | 8.34 | 10 | Beta-alanine (HMDB00056) | 0.2166 | 0.9825 | 2.54 | 3.89 |
| Disease perturbations from GEO up | |||||||||||
| 1 | H1N1 DOID-0050211 human GSE27131 sample 514 | 1.05E-35 | 8.78E-33 | 5.79 | 466.7 | 1 | H1N1 DOID-0050211 human GSE27131 sample 514 | 1.26E-36 | 1.05E-33 | 9.48 | 783.45 |
| 2 | Septic shock C0036983 human GSE9692 sample 307 | 1.17E-25 | 4.88E-23 | 4.34 | 249.19 | 2 | Huntington’s disease DOID-12858 human GSE24250 sa | 2.19E-17 | 9.18E-15 | 3.9 | 149.63 |
| 3 | SARS C1175175 human | 2.03E-23 | 5.67E-21 | 7.01 | 366.17 | 3 | Autism-spectrum disorder DOID-0060041 human GSE2 | 7.61E-17 | 2.13E-14 | 3.88 | 144.12 |
| 4 | sJIA DOID-848 human | 7.13E-20 | 1.49E-17 | 4.33 | 191.1 | 4 | Endometrial cancer DOID-1380 human GSE17025 samples | 9.61E-14 | 2.01E-11 | 3.53 | 105.77 |
| 5 | Hepatocellular carcinoma DOID-684 human GSE58208 samples | 1.48E-16 | 2.48E-14 | 3.52 | 128.44 | 5 | Endometrial cancer DOID-1380 human GSE17025 samples | 1.27E-13 | 2.14E-11 | 3.37 | 100.06 |
| 6 | Hepatitis C virus-related hepatocellular carcinoma UMLS CUI- | 4.97E-15 | 6.93E-13 | 3.35 | 110.45 | 6 | Endometrial cancer DOID-1380 human GSE17025 samp | 4.14E-13 | 5.78E-11 | 3.39 | 96.53 |
| 7 | Non-sJIA (subgroup-RF | 7.08E-15 | 8.48E-13 | 3.7 | 120.71 | 7 | Endometrial cancer DOID-1380 human GSE17025 samples | 2.92E-12 | 3.50E-10 | 3.13 | 83 |
| 8 | Asthma DOID-2841 human GSE31773 sample 713 | 5.79E-11 | 6.06E-09 | 3.37 | 79.39 | 8 | Purpura, Idiopathic Thrombocytopenic C0043117 hum | 5.57E-12 | 5.83E-10 | 7.33 | 189.92 |
| 9 | Rheumatoid arthritis DOID-7148 human GSE15573 sample 90 | 1.09E-10 | 9.36E-09 | 3.46 | 79.42 | 9 | Simian-acquired immune deficiency Syndrome C00801 | 9.26E-12 | 8.62E-10 | 3.39 | 86.13 |
| 10 | Ischemic stroke UMLS CUI-C0948008 human GSE22255 samp | 1.12E-10 | 9.36E-09 | 3.24 | 74.29 | 10 | Overexertion C0161750 human GSE3606 sample 286 | 1.38E-11 | 1.16E-09 | 3.02 | 75.56 |
| WikiPathway 2021 human | |||||||||||
| 1 | VEGFA-VEGFR2 signalling pathway WP3888 | 5.97E-05 | 0.02911 | 2.03 | 19.72 | 1 | Cytoplasmic ribosomal proteins WP477 | 7.80E-15 | 3.69E-12 | 7.27 | 236.23 |
| 2 | Host-pathogen interaction of human coronaviruses - MAPK s | 0.0003985 | 0.05925 | 5.3 | 41.5 | 2 | TCR and Co-stimulatory Signalling WP2583 | 3.04E-06 | 7.18E-04 | 7.82 | 99.32 |
| 3 | Hematopoietic stem cell differentiation WP2849 | 0.0004395 | 0.05925 | 4.13 | 31.9 | 3 | Proteasome degradation WP183 | 4.48E-04 | 7.06E-02 | 3.39 | 26.16 |
| 4 | Effect of progerin on genes involved in Hutchinson-Gilford pr | 0.0004857 | 0.05925 | 5.12 | 39.05 | 4 | TNF-related weak inducer of apoptosis (TWEAK) Signalling | 7.04E-04 | 8.32E-02 | 3.99 | 28.98 |
| 5 | Ethanol effects on histone modifications WP3996 | 0.0008287 | 0.06794 | 5.41 | 38.37 | 5 | T-Cell antigen receptor (TCR) pathway during Staphylo | 1.54E-03 | 0.1257 | 3.07 | 19.86 |
| 6 | Focal adhesion-PI3K-Akt- mTOR-signalling pathway WP3932 | 0.001007 | 0.06794 | 1.98 | 13.66 | 6 | RANKL/RANK signalling pathway WP2018 | 0.001813 | 0.1257 | 3.19 | 20.16 |
| 7 | Leptin and adiponectin WP3934 | 0.00114 | 0.06794 | 12.33 | 83.6 | 7 | Allograft rejection WP2328 | 0.00186 | 0.1257 | 2.59 | 16.3 |
| 8 | Vitamin D receptor pathway WP2877 | 0.001141 | 0.06794 | 2.3 | 15.59 | 8 | TCR signalling pathway WP69 | 0.005484 | 0.3242 | 2.35 | 12.25 |
| 9 | Small cell lung cancer WP4658 | 0.001254 | 0.06794 | 2.91 | 19.45 | 9 | Angiogenesis WP1539 | 0.006406 | 0.3367 | 4.25 | 21.46 |
| 10 | IL-7 signaling pathway WP205 | 0.001392 | 0.06794 | 5.85 | 38.48 | 10 | Development and heterogeneity of the ILC family WP3 | 0.007239 | 0.3424 | 3.57 | 17.6 |
| KEGG 2021 human | |||||||||||
| 1 | Hematopoietic cell lineage | 0.0000433 | 0.0129 | 3.59 | 36.11 | 1 | Ribosome | 2.37E-09 | 7.12E-07 | 3.68 | 73.09 |
| 2 | Epstein−Barr virus infection | 0.0003043 | 0.03734 | 2.4 | 19.44 | 2 | Coronavirus disease | 8.08E-07 | 1.21E-04 | 2.61 | 36.63 |
| 3 | Rap1 signalling pathway | 0.0005303 | 0.03734 | 2.3 | 17.32 | 3 | Herpes simplex virus 1 infection | 4.66E-05 | 4.66E-03 | 1.81 | 18.03 |
| 4 | Toxoplasmosis | 0.0006171 | 0.03734 | 2.88 | 21.27 | 4 | Proteasome | 1.49E-03 | 1.12E-01 | 3.55 | 23.08 |
| 5 | Platelet activation | 0.0006265 | 0.03734 | 2.76 | 20.35 | 5 | Th17 cell differentiation | 1.87E-03 | 0.1119 | 2.42 | 15.19 |
| 6 | Small cell lung cancer | 0.0008381 | 0.04162 | 3.06 | 21.68 | 6 | Th1 and Th2 cell differentiation | 2.60E-03 | 0.1149 | 2.49 | 14.83 |
| 7 | Leishmaniasis | 0.001878 | 0.07994 | 3.1 | 19.43 | 7 | Graft-versus-host disease | 2.82E-03 | 0.1149 | 3.48 | 20.43 |
| 8 | FoxO signalling pathway | 0.00304 | 0.1132 | 2.4 | 13.94 | 8 | Natural-killer cell-mediated cytotoxicity | 3.06E-03 | 0.1149 | 2.17 | 12.57 |
| 9 | Focal adhesion | 0.0037 | 0.121 | 2.06 | 11.52 | 9 | T-cell receptor signalling pathway | 0.003486 | 0.1162 | 2.33 | 13.16 |
| 10 | Glycerophospholipid metabolism | 0.004438 | 0.121 | 2.59 | 14.04 | 10 | Bladder cancer | 0.00862 | 0.2586 | 3.09 | 14.7 |
| Reactome 2016 | |||||||||||
| 1 | Hemostasis homo sapiens R-HSA-109582 | 9.62E-06 | 0.01044 | 2.01 | 23.22 | 1 | Eukaryotic translation elongation homo sapiens R-HSA | 1.30E-16 | 7.87E-14 | 8.02 | 293.33 |
| 2 | Asparagine N-linked glycosylation homo sapiens R-HSA-4462 | 0.0000288 | 0.01564 | 2.46 | 25.7 | 2 | Peptide chain elongation Homo sapiens R-HSA-156902 | 1.36E-16 | 7.87E-14 | 8.39 | 306.52 |
| 3 | Extracellular matrix organization homo sapiens R-HSA-14742 | 0.0001472 | 0.0533 | 2.22 | 19.6 | 3 | NMD independent of the | 1.03E-15 | 2.54E-13 | 7.64 | 263.59 |
| 4 | Chromatin organization homo sapiens R-HSA-4839726 | 0.0002665 | 0.05788 | 2.33 | 19.14 | 4 | Viral mRNA translation homo sapiens R-HSA-192823 | 1.13E-15 | 2.54E-13 | 7.97 | 274.44 |
| 5 | Chromatin modifying enzymes homo sapiens R-HSA-324750 | 0.0002665 | 0.05788 | 2.33 | 19.14 | 5 | L13a-mediated translational silencing of ceruloplasmin | 1.32E-15 | 2.54E-13 | 6.68 | 228.73 |
| 6 | Platelet activation, signalling and aggregation homo sapiens | 0.0006356 | 0.09438 | 2.14 | 15.76 | 6 | 3’ -UTR-mediated translational regulation homo sapien | 1.32E-15 | 2.54E-13 | 6.68 | 228.73 |
| 7 | Immune system homo sapiens R-HSA-168256 | 0.0006633 | 0.09438 | 1.43 | 10.46 | 7 | GTP hydrolysis and joining of the 60S ribosomal subuni | 1.85E-15 | 2.76E-13 | 6.58 | 223.27 |
| 8 | Calnexin/calreticulin cycle homo sapiens R-HSA-901042 | 0.0006953 | 0.09438 | 9.26 | 67.32 | 8 | Formation of a pool of free 40S subunits Homo sapiens | 1.91E-15 | 2.76E-13 | 7.11 | 241.01 |
| 9 | HDACs deacetylate histones homo sapiens R-HSA-3214815 | 0.0008981 | 0.1051 | 3.71 | 26.05 | 9 | Selenocysteine synthesis homo sapiens R-HSA-240855 | 3.67E-15 | 4.24E-13 | 7.54 | 250.53 |
| 10 | Platelet degranulation homo sapiens R-HSA-114608 | 0.0009675 | 0.1051 | 2.86 | 19.86 | 10 | Eukaryotic translation termination homo sapiens R-HS | 3.67E-15 | 4.24E-13 | 7.54 | 250.53 |
| DisGeNET | |||||||||||
| 1 | Nephrotic Syndrome | 2.00E-07 | 0.001263 | 3.42 | 52.72 | 1 | Aase Smith syndrome 2 | 4.58E-06 | 2.96E-02 | 10.46 | 128.54 |
| 2 | Platelet mean volume determination (procedure) | 1.34E-06 | 0.004221 | 3.23 | 43.69 | 2 | Abnormality of the genital system | 2.73E-05 | 5.87E-02 | 7.67 | 80.56 |
| 3 | Coronary artery disease | 0.000009444 | 0.01986 | 1.74 | 20.14 | 3 | Abnormality of the reproductive system | 2.73E-05 | 5.87E-02 | 7.67 | 80.56 |
| 4 | Fetal diseases | 0.00003781 | 0.05458 | 23.15 | 235.76 | 4 | Abnormality of the urinary system | 1.07E-04 | 1.59E-01 | 5.32 | 48.67 |
| 5 | Thrombocythemia, essential | 0.00005442 | 0.05458 | 2.99 | 29.34 | 5 | Anaemia, macrocytic | 1.23E-04 | 0.1585 | 4.69 | 42.21 |
| 6 | Blood coagulation disorders | 0.00006908 | 0.05458 | 2.76 | 26.44 | 6 | Pallor | 1.86E-04 | 0.1997 | 3.78 | 32.47 |
| 7 | Coronary heart disease | 0.00007063 | 0.05458 | 1.67 | 16.01 | 7 | T-cell lymphoma | 3.98E-04 | 0.3672 | 1.87 | 14.6 |
| 8 | Severe sepsis | 0.00007094 | 0.05458 | 3.43 | 32.75 | 8 | Intermittent migraine headaches | 4.71E-04 | 0.3804 | 2.79 | 21.37 |
| 9 | Bulging forehead | 0.00008983 | 0.05458 | 3.35 | 31.22 | 9 | Niemann-Pick disease, Type C | 1.23E-03 | 0.8837 | 2.84 | 19.04 |
| 10 | Prominent forehead | 0.00008983 | 0.05458 | 3.35 | 31.22 | 10 | hand deformities | 1.78E-03 | 0.9997 | 3.45 | 21.86 |
| Drug perturbations from GEO up | Drug perturbations from GEO down | ||||||||||
| 1 | Oprelvekin DB00038 human GSE8762 sample 3297 | 1.10E-10 | 9.92E-08 | 3.2 | 73.31 | 1 | Motexafin gadolinium (4 h) DB05428 human GSE2189 s | 3.94E-08 | 2.45E-05 | 2.58 | 43.91 |
| 2 | BPDE 41322 human GSE19510 sample 3378 | 6.74E-10 | 2.46E-07 | 3 | 63.45 | 2 | Doxycycline DB00254 human GSE2624 sample 3074 | 5.43E-08 | 2.45E-05 | 2.27 | 37.91 |
| 3 | Atorvastatin DB01076 human GSE11393 sample 3196 | 8.15E-10 | 2.46E-07 | 3.21 | 67.26 | 3 | Estradiol 5757 human GSE4668 sample 3063 | 1.19E-07 | 3.48E-05 | 2.76 | 44.05 |
| 4 | Methotrexate DB00563 human GSE23687 sample 2541 | 2.70E-09 | 5.57E-07 | 2.9 | 57.22 | 4 | Apratoxin A 6326668 human GSE2742 sample 3068 | 1.85E-07 | 3.48E-05 | 2.84 | 44.01 |
| 5 | IFN beta-1b DB00068 human GSE26104 sample 3185 | 3.08E-09 | 5.57E-07 | 2.97 | 58.14 | 5 | Fluoxetine DB00472 mouse GSE35765 sample 2500 | 1.93E-07 | 0.00003475 | 2.71 | 41.85 |
| 6 | Atarax DB00557 human GSE31773 sample 2485 | 4.60E-09 | 6.94E-07 | 3.01 | 57.77 | 6 | Neocarzinostatin 5282473 human GSE1676 sample 311 | 2.35E-07 | 0.00003533 | 2.46 | 37.53 |
| 7 | Bisphenol A 6623 human GSE17624 sample 2664 | 1.33E-08 | 1.71E-06 | 2.85 | 51.65 | 7 | Etanercept DB00005 human GSE7524 sample 3295 | 3.29E-07 | 0.00003757 | 2.25 | 33.6 |
| 8 | Vemurafenib DB08881 human GSE37441 sample 2561 | 3.26E-08 | 3.69E-06 | 3.07 | 52.85 | 8 | Arachidonic acid 444899 human GSE3737 sample 3119 | 3.33E-07 | 0.00003757 | 2.68 | 39.97 |
| 9 | BPDE 41322 human GSE19510 sample 3379 | 9.90E-08 | 9.95E-06 | 2.82 | 45.55 | 9 | Promegestone 36709 human GSE67561 sample 3694 | 4.36E-07 | 0.00004018 | 2.33 | 34.1 |
| 10 | Bleomycin DB00290 mouse GSE2640 sample 2851 | 1.51E-07 | 1.29E-05 | 2.69 | 42.28 | 10 | Apratoxin A 6326668 human GSE2742 sample 3070 | 4.45E-07 | 0.00004018 | 2.28 | 33.41 |
IFN, interferon; SARS-CoV-2, severe acute respiratory syndrome coronavirus 2; IL, interleukin; TCR, T-cell receptor; TNF, tumour necrosis factor; MERS, Middle East respiratory syndrome coronavirus; sJIA, systemic juvenile idiopathic arthritis; OR, odds ratio; GEO, Gene Expression Omnibus; NMD, nonsense-mediated decay
| Up-regulated genes | Down-regulated genes | ||||||||||
|---|---|---|---|---|---|---|---|---|---|---|---|
| Index | Name | P | Adjusted P | OR | Combined score | Index | Name | P | Adjusted P | OR | Combined score |
| COVID-19 related gene sets 2021 | |||||||||||
| 1 | 500 genes upregulated by SARS-CoV-2 in human Calu3 cells a | 5.39E-13 | 1.38E-10 | 44.31 | 1251.61 | 1 | 500 genes upregulated by SARS-CoV-2 in human organ | 3.14E-12 | 7.14E-10 | 47.79 | 1265.76 |
| 2 | 500 genes upregulated by SARS-CoV-1 in Calu-3 cells from GS | 6.52E-12 | 8.34E-10 | 41.53 | 1069.61 | 2 | 500 genes upregulated by SARS-CoV-2 in human Calu3 | 2.40E-10 | 2.73E-08 | 36.1 | 799.63 |
| 3 | 500 genes upregulated by SARS-CoV-2 in human Organoids c | 1.15E-11 | 9.82E-10 | 39.1 | 984.76 | 3 | 500 genes upregulated by SARS-CoV-2 (0.2 MOI) in hum | 4.46E-09 | 3.38E-07 | 31.42 | 604.19 |
| 4 | SARS perturbation 357 up genes from GEn3va mouse Lung | 3.14E-11 | 2.01E-09 | 43.58 | 1053.96 | 4 | 500 genes upregulated by SARS-CoV-2 in human Calu3 | 8.17E-09 | 4.64E-07 | 28.99 | 539.88 |
| 5 | SARS perturbation; 431 up genes from GEN3VA; human airw | 5.70E-11 | 2.92E-09 | 40.64 | 958.68 | 5 | 500 genes upregulated by SARS-CoV-2 in Calu-3 cells fr | 7.53E-08 | 3.42E-06 | 27.3 | 447.8 |
| 6 | SARS perturbation 441 up genes from GEN3VA mouse lung | 1.45E-10 | 6.17E-09 | 36.43 | 825.44 | 6 | 500 genes up-regulated by SARS-CoV-1 in Calu-3 cells fr | 9.24E-08 | 3.50E-06 | 26.46 | 428.56 |
| 7 | 500 genes upregulated by SARS-CoV-2 in Calu-3 cells from GS | 1.90E-10 | 6.96E-09 | 35.27 | 789.41 | 7 | 500 genes up regulated by SARS-COV-2 infection of Calu | 1.63E-07 | 4.62E-06 | 24.27 | 379.34 |
| 8 | 500 genes upregulated by SARS-CoV-2 in human cardiomyocy | 3.91E-10 | 1.25E-08 | 32.4 | 701.91 | 8 | 500 genes up-regulated by SARS-CoV-2 (2 MOI) in huma | 1.63E-07 | 4.619E-06 | 24.27 | 379.34 |
| 9 | 500 genes upregulated by SARS-CoV-2 in human hiPSC-CMs c | 6.69E-10 | 1.90E-08 | 30.4 | 642.26 | 9 | 500 genes up-regulated by SARS-CoV-2 in human Calu3 | 2.09E-07 | 5.282E-06 | 23.35 | 359.1 |
| 10 | 500 genes upregulated by SARS-CoV-2 in human Calu3 cells a | 7.58E-10 | 1.94E-08 | 29.96 | 629.08 | 10 | SARS perturbation; 388 up genes from GEN3VA; human | 5.38E-07 | 0.00001221 | 26.98 | 389.54 |
| HMDB metabolites | |||||||||||
| 1 | Arachidonic acid (HMDB01043) | 0.001349 | 0.008094 | 41.96 | 277.26 | 1 | Simvastatin (HMDB05007) | 2.53E-04 | 0.001266 | 102.09 | 845.42 |
| 2 | Oxygen (HMDB01377) | 0.01042 | 0.02656 | 14.3 | 65.27 | 2 | Butyric acid (HMDB00039) | 0.0104 | 0.02601 | 110.95 | 506.56 |
| 3 | Iron (HMDB00692) | 0.01725 | 0.02656 | 10.91 | 44.28 | 3 | Atorvastatin (HMDB05006) | 0.01603 | 0.02672 | 69.32 | 286.51 |
| 4 | Atorvastatin (HMDB05006) | 0.01771 | 0.02656 | 62.38 | 251.64 | 4 | Cyclic AMP (HMDB00058) | 0.1399 | 0.1749 | 7.01 | 13.79 |
| 5 | Simvastatin (HMDB05007) | 0.02594 | 0.03112 | 41.57 | 151.83 | 5 | Magnesium (HMDB00547) | 0.3593 | 0.3593 | 2.35 | 2.4 |
| 6 | C34H34N4O4.Fe (HMDB03178) | 0.1633 | 0.1633 | 5.9 | 10.68 | ||||||
| Disease perturbations from GEO up | Disease perturbations from GEO down | ||||||||||
| 1 | Discoid lupus erythematosus UMLS CUI-C0024138 human GSE | 9.32E-13 | 5.27E-10 | 50.98 | 1412.32 | 1 | COPD - C002411 | 4.10E-10 | 7.30E-08 | 59.81 | 1292.8 |
| 2 | Acute myocarditis DOID-3951 mouse GSE35182 sample 801 | 2.59E-12 | 7.32E-10 | 38.07 | 1015.8 | 2 | Pulmonary sarcoidosis DOID-13406 human GSE19976 sa | 4.32E-10 | 7.30E-08 | 42.78 | 922.44 |
| 3 | Acute myocarditis DOID-3951 mouse GSE35182 sample 802 | 3.09E-11 | 5.83E-09 | 35.2 | 851.81 | 3 | Aplastic anaemia C0002874 human GSE3807 sample 424 | 4.74E-10 | 7.30E-08 | 42.27 | 907.45 |
| 4 | Multiple myeloma DOID-9538 human GSE36474 sample 707 | 1.37E-10 | 1.93E-08 | 47.79 | 1085.39 | 4 | Asthma DOID-2841 human GSE43696 sample 827 | 7.23E-10 | 8.35E-08 | 39.98 | 841.44 |
| 5 | Glaucoma associated with systemic syndromes DOID-1686 mo | 1.84E-10 | 1.95E-08 | 45.96 | 1030.06 | 5 | Bipolar disorder DOID-3312 human GSE62191 sample 54 | 7.89E-09 | 6.79E-07 | 38.4 | 716.44 |
| 6 | Dermatomyositis DOID-10223 human GSE48280 sample 705 | 2.07E-10 | 1.95E-08 | 34.93 | 778.83 | 6 | Anemia DOID-2355 human GSE4619 sample 792 | 8.82E-09 | 6.79E-07 | 37.76 | 700.25 |
| 7 | Swine influenza DOID-0050211 human GSE48466 sample 498 | 2.67E-10 | 2.16E-08 | 43.77 | 964.85 | 7 | Polycystic ovary syndrome C0032460 human GSE5090 s | 1.49E-07 | 9.00E-06 | 33.82 | 531.55 |
| 8 | Psoriasis DOID-8893 human GSE52471 sample 690 | 4.34E-10 | 3.06E-08 | 41.06 | 885.22 | 8 | Idiopathic fibrosing alveolitis C0085786 human GSE2136 | 1.56E-07 | 9.00E-06 | 33.57 | 526.14 |
| 9 | Sendai virus infection C1319860 mouse GSE10211 sample 82 | 4.94E-10 | 3.10E-08 | 40.37 | 865.01 | 9 | Melanoma DOID-1909 human GSE6887 sample 950 | 2.17E-07 | 1.02E-05 | 31.67 | 485.93 |
| 10 | Alzheimer’s disease DOID-10652 human GSE36980 sample 52 | 1.10E-09 | 6.24E-08 | 36.31 | 748.8 | 10 | Anemia DOID-2355 human GSE4619 sample 793 | 2.22E-07 | 1.02E-05 | 31.56 | 483.58 |
| WikiPathway 2021 Human | |||||||||||
| 1 | SARS-CoV-2 innate immunity evasion and cell-specific immunity | 5.34E-11 | 7.96E-09 | 132.79 | 3141.01 | 1 | Cytokines and Inflammatory Response WP530 | 6.95E-14 | 1.27E-11 | 460.64 | 13956.06 |
| 2 | p38 MAPK Signalling Pathway WP400 | 0.000005846 | 0.0004355 | 107.25 | 1292.31 | 2 | IL-18 signalling pathway WP4754 | 1.14E-12 | 1.04E-10 | 67.48 | 1855.38 |
| 3 | Lung fibrosis WP3624 | 0.00003804 | 0.001889 | 55.33 | 563.09 | 3 | Toll-like receptor signaling pathway WP75 | 3.74E-12 | 2.27E-10 | 120.83 | 3179.24 |
| 4 | Mammary gland development pathway - puberty (stage 2 of 4 | 0.00008133 | 0.002816 | 191.08 | 1799.41 | 4 | Lung fibrosis WP3624 | 2.01E-11 | 9.15E-10 | 161.33 | 3973.56 |
| 5 | COVID-19 adverse outcome pathway WP4891 | 0.0001093 | 0.002816 | 161.67 | 1474.57 | 5 | Regulation of toll-like receptor signaling pathway WP14 | 3.16E-11 | 1.15E-09 | 87.72 | 2120.79 |
| 6 | MAPK signaling pathway WP382 | 0.0001134 | 0.002816 | 19.19 | 174.34 | 6 | Allograft rejection WP2328 | 1.69E-10 | 5.14E-09 | 110.65 | 2489.4 |
| 7 | Platelet-mediated interactions with vascular and circulating c | 0.0001415 | 0.003011 | 140.1 | 1241.77 | 7 | SARS-CoV-2 innate immunity evasion and cell-specific im | 3.76E-09 | 9.78E-08 | 116.63 | 2262.39 |
| 8 | IL-18 signaling pathway WP4754 | 0.0001669 | 0.003108 | 17.31 | 150.53 | 8 | Spinal cord injury WP2431 | 7.14E-08 | 1.563E-06 | 62.79 | 1033.23 |
| 9 | Complement activation WP545 | 0.0002395 | 0.003255 | 105.05 | 875.77 | 9 | MAPK signaling pathway WP382 | 7.73E-08 | 1.563E-06 | 37.96 | 621.67 |
| 10 | PI3K/AKT/mTOR - VitD3 signaling WP4141 | 0.0002395 | 0.003255 | 105.05 | 875.77 | 10 | T-Cell antigen receptor (TCR) pathway during Staphyloc | 3.13E-07 | 5.432E-06 | 91.6 | 1371.81 |
| KEGG 2021 Human | |||||||||||
| 1 | Viral protein interaction with cytokine and cytokine receptor | 5.39E-08 | 0.000005448 | 65.41 | 1094.63 | 1 | Rheumatoid arthritis | 8.73E-22 | 1.04E-19 | 333.67 | 16179.87 |
| 2 | S. aureus infection | 0.000002687 | 0.0001202 | 51.42 | 659.61 | 2 | Cytokine-cytokine receptor interaction | 3.44E-14 | 2.05E-12 | 76.79 | 2380.51 |
| 3 | Chagas disease | 0.00000357 | 0.0001202 | 47.73 | 598.72 | 3 | Leishmaniasis | 4.60E-13 | 1.83E-11 | 165.93 | 4713.46 |
| 4 | MAPK signaling pathway | 0.00001113 | 0.0002285 | 21.29 | 242.84 | 4 | Toll-like receptor signaling pathway | 4.01E-12 | 1.17E-10 | 119.58 | 3138.04 |
| 5 | Cytokine-cytokine receptor interaction | 0.00001131 | 0.0002285 | 21.22 | 241.65 | 5 | Th17 cell differentiation | 4.91E-12 | 1.17E-10 | 115.97 | 3019.85 |
| 6 | Influenza A | 0.0000282 | 0.0004747 | 27.75 | 290.68 | 6 | TNF signalling pathway | 6.81E-12 | 1.35E-10 | 110.42 | 2839.31 |
| 7 | NOD-like receptor signalling pathway | 0.00003443 | 0.0004865 | 26.32 | 270.52 | 7 | Inflammatory bowel disease | 2.44E-11 | 4.15E-10 | 155.84 | 3808.22 |
| 8 | Transcriptional misregulation in cancer | 0.00004335 | 0.0004865 | 24.77 | 248.84 | 8 | Pertussis | 6.42E-11 | 9.55E-10 | 131.28 | 3081.03 |
| 9 | Chemokine signaling pathway | 0.00004335 | 0.0004865 | 24.77 | 248.84 | 9 | IL-17 signaling pathway | 2.37E-10 | 3.13E-09 | 104.33 | 2312.47 |
| 10 | Pertussis | 0.00006676 | 0.0006182 | 45.45 | 436.95 | 10 | Viral protein interaction with cytokine and cytokine rece | 3.45E-10 | 4.11E-09 | 97.64 | 2127.31 |
| Reactome 2016 | |||||||||||
| 1 | Chemokine receptors bind chemokines homo sapiens R-HSA- | 3.18E-07 | 0.00005412 | 90.17 | 1348.92 | 1 | Class A/1 (Rhodopsin-like receptors) homo sapiens R-HS | 2.75E-10 | 3.13E-08 | 45.4 | 999.59 |
| 2 | Interferon alpha/beta signaling homo sapiens R-HSA-909733 | 7.00E-07 | 0.00005951 | 73.22 | 1037.63 | 2 | Immune system homo sapiens R-HSA-168256 | 1.33E-09 | 6.15E-08 | 20.6 | 421.06 |
| 3 | Peptide ligand-binding receptors homo sapiens R-HSA-37527 | 0.00004424 | 0.001997 | 24.64 | 247.01 | 3 | Chemokine receptors bind chemokines homo sapiens R | 1.62E-09 | 6.15E-08 | 139.57 | 2825.17 |
| 4 | Interferon signaling homo sapiens R-HSA-913531 | 0.00004698 | 0.001997 | 24.25 | 241.66 | 4 | GPCR ligand binding homo sapiens R-HSA-500792 | 3.56E-09 | 1.02E-07 | 32.37 | 629.77 |
| 5 | Immune system homo sapiens R-HSA-168256 | 0.0001026 | 0.003487 | 7.37 | 67.72 | 5 | MAPK targets/Nuclear events mediated by MAP kinase | 1.57E-08 | 3.47E-07 | 204.67 | 3677.93 |
| 6 | ATF4 activates genes homo sapiens R-HSA-380994 | 0.0003105 | 0.007375 | 91.33 | 737.73 | 6 | Peptide ligand-binding receptors homo sapiens R-HSA-3 | 1.83E-08 | 3.47E-07 | 48.85 | 870.52 |
| 7 | Class A/1 (Rhodopsin-like receptors) homo sapiens R-HSA-373 | 0.0003216 | 0.007375 | 14.5 | 116.62 | 7 | Signal transduction homo sapiens R-HSA-162582 | 2.61E-07 | 3.91E-06 | 12.25 | 185.68 |
| 8 | Cytokine signaling in immune system homo sapiens R-HSA-12 | 0.0003794 | 0.007375 | 9.84 | 77.5 | 8 | MAP kinase activation in TLR cascade homo sapiens R-H | 2.74E-07 | 3.907E-06 | 94.88 | 1433.6 |
| 9 | PERK regulates gene expression homo sapiens R-HSA-381042 | 0.0003904 | 0.007375 | 80.78 | 633.99 | 9 | TRAF6 mediated induction of proinflammatory cytokine | 5.74E-07 | 7.275E-06 | 78.09 | 1122.16 |
| 10 | GPCR ligand binding homo sapiens R-HSA-500792 | 0.001089 | 0.01852 | 10.38 | 70.79 | 10 | Translocation of ZAP-70 to immunological synapse hom | 9.56E-07 | 7.521E-06 | 207.95 | 2882.21 |
| DisGeNET | |||||||||||
| 1 | Influenza | 3.56E-12 | 6.37E-09 | 36.92 | 973.35 | 1 | Pneumonia | 2.79E-17 | 6.62E-14 | 87.28 | 3326.82 |
| 2 | Infection | 2.05E-11 | 1.84E-08 | 36.77 | 905 | 2 | Pneumonitis | 1.89E-15 | 2.24E-12 | 82.39 | 2793.11 |
| 3 | Diabetes | 6.90E-10 | 4.12E-07 | 19.88 | 419.27 | 3 | Eczema | 4.69E-14 | 3.71E-11 | 60.64 | 1861.14 |
| 4 | Asthma | 1.03E-09 | 4.61E-07 | 19.14 | 396.13 | 4 | Dermatitis, atopic | 9.45E-14 | 4.73E-11 | 56.71 | 1700.71 |
| 5 | Systemic scleroderma | 2.23E-09 | 7.92E-07 | 26.35 | 524.86 | 5 | Glomerulonephritis | 1.10E-13 | 4.73E-11 | 88.57 | 2642.59 |
| 6 | Lupus erythematosus, systemic | 3.18E-09 | 7.92E-07 | 18.84 | 368.69 | 6 | Allergic reaction | 1.20E-13 | 4.73E-11 | 203.9 | 6066.84 |
| 7 | Lung diseases | 3.37E-09 | 7.92E-07 | 31.32 | 611 | 7 | Asthma | 2.20E-13 | 7.45E-11 | 40.27 | 1173.64 |
| 8 | Stomach neoplasms | 3.54E-09 | 7.92E-07 | 21.11 | 410.71 | 8 | Rheumatoid arthritis | 6.96E-13 | 2.06E-10 | 37.46 | 1048.76 |
| 9 | Diabetes mellitus | 4.97E-09 | 9.11E-07 | 16.49 | 315.19 | 9 | Influenza | 8.04E-13 | 2.12E-10 | 46.16 | 1285.45 |
| 10 | Virus diseases | 5.55E-09 | 9.11E-07 | 20.09 | 381.87 | 10 | Tuberculosis | 1.02E-12 | 2.42E-10 | 45.11 | 1245.62 |
| Drug perturbations from GEO up | Drug perturbations from GEO down | ||||||||||
| 1 | Lipopolysaccharide 11970143 human GSE3140 sample 3595 | 6.36E-15 | 3.73E-12 | 67.79 | 2216.05 | Etanercept DB00005 human GSE11903 sample 2608 | 2.84E-09 | 1.10E-06 | 44.77 | 881.07 | |
| 2 | Lipopolysaccharide 11970143 human GSE3140 sample 3594 | 4.55E-13 | 1.33E-10 | 54.98 | 1562.29 | IFN beta-1b DB00068 human GSE26104 sample 3 | 7.20E-09 | 1.39E-06 | 38.93 | 729.84 | |
| 3 | Lipopolysaccharide 11970143 human GSE5504 sample 3486 | 1.44E-12 | 2.81E-10 | 48.72 | 1328.43 | Etanercept DB00005 human GSE11903 sample 2610 | 1.88E-08 | 2.42E-06 | 33.7 | 599.53 | |
| 4 | Formaldehyde 712 rat GSE7002 sample 3552 | 3.73E-12 | 5.47E-10 | 44.05 | 1159.1 | Formaldehyde 712 rat GSE7002 sample 3539 | 3.26E-08 | 3.15E-06 | 31 | 534.51 | |
| 5 | Lipopolysaccharide 11970143 human GSE5504 sample 3485 | 5.19E-12 | 6.08E-10 | 42.54 | 1105.47 | Quercetin 5280343 human GSE13899 sample 3182 | 2.17E-07 | 0.0000168 | 31.67 | 485.93 | |
| 6 | Bleomycin DB00290 mouse GSE43695 sample 3104 | 1.18E-11 | 1.15E-09 | 48.87 | 1229.57 | Ubiquinol 9962735 human GSE21351 sample 3448 | 3.58E-07 | 0.00002308 | 29 | 430.48 | |
| 7 | Soman 7305 rat GSE13428 sample 2633 | 2.40E-11 | 2.01E-09 | 36.16 | 884.12 | Formaldehyde 712 rat GSE7002 sample 3548 | 6.47E-07 | 0.00003579 | 26.11 | 372.14 | |
| 8 | Bleomycin DB00290 mouse GSE43695 sample 3106 | 5.18E-11 | 3.79E-09 | 41.11 | 973.55 | Formaldehyde 712 rat GSE7002 sample 3540 | 7.50E-07 | 0.00003628 | 25.44 | 358.83 | |
| 9 | IFN beta-1a DB00060 human GSE26104 sample 3186 | 1.68E-10 | 1.09E-08 | 35.8 | 805.71 | Etanercept DB00005 human GSE7524 sample 3295 | 9.80E-07 | 0.00004215 | 24.26 | 335.68 | |
| 10 | IFN-alphacon1 DB05258 human GSE5542 sample 2473 | 1.55E-09 | 9.08E-08 | 34.71 | 704.2 | IFN-β-1b (Betaferon) DB00068 human GSE26104 | 0.000001963 | 0.00007598 | 31.36 | 412.08 | |
GEO, Gene Expression Omnibus; OR, odds ratio; TLR, toll like receptor; S. aureus, Staphylococcus aureus GEO, Gene Expression Omnibus; SARS-CoV-2, severe acute respiratory syndrome coronavirus 2; TNF, tumor necrosis factor; IL, interleukin; COPD, chronic obstructive pulmonary disease; IFN, Interferon
| Upregulated genes | Downregulated genes | ||||||||||
|---|---|---|---|---|---|---|---|---|---|---|---|
| Index | Name | P | Adjusted P | OR | Combined score | Index | Name | P | Adjusted P | OR | Combined score |
| COVID-19 related gene sets 2021 | |||||||||||
| 1 | 500 genes up-regulated by SARS-CoV-2 in human lung cells f | 9.52E-57 | 4.47E-54 | 5.86 | 755.92 | 1 | Top 500 up genes for SARS-CoV-2 infection in Rhesus m | 2.32E-37 | 1.10E-34 | 4 | 337.37 |
| 2 | Top 500 up genes for SARS- CoV-2 infection in Rhesus macaq | 3.01E-56 | 7.08E-54 | 5.97 | 762.66 | 2 | Top 500 up genes for SARS-CoV-2 late-stage infection i | 1.21E-25 | 2.87E-23 | 3.13 | 179.75 |
| 3 | Top 500 up genes for SARS-CoV-2 infection in Rhesus macaq | 4.24E-55 | 6.64E-53 | 5.81 | 727.77 | 3 | Top 500 down genes for SARS-CoV-2 early infection in | 5.97E-25 | 9.41E-23 | 3.08 | 172 |
| 4 | 500 genes upregulated by SARS-CoV-2 in human lung tissue f | 7.98E-54 | 7.50E-52 | 5.86 | 716.22 | 4 | SARS perturbation; 220 down genes from GEN3VA; Hu | 1.34E-24 | 1.58E-22 | 4.86 | 267.31 |
| 5 | Healthy human lung biopsy versus COVID-19 infected human lun | 7.98E-54 | 7.50E-52 | 5.86 | 716.22 | 5 | 500 genes downregulated by MHV-A59 in murine spleen | 5.03E-24 | 4.76E-22 | 3.21 | 172.25 |
| 6 | Top 500 up genes for SARS-CoV-2 infection in Rhesus macaq | 3.05E-49 | 2.39E-47 | 5.38 | 600.51 | 6 | Top 500 down genes for SARS-CoV-2 infection in Rhesu | 5.03E-23 | 3.96E-21 | 3.09 | 158.72 |
| 7 | COVID-19 patients PBMC up | 1.47E-47 | 9.87E-46 | 5.03 | 541.92 | 7 | Top 500 up genes for SARS-CoV-2 infection in Rhesus m | 5.17E-21 | 3.50E-19 | 2.93 | 137.03 |
| 8 | Top 500 up genes for SARS-CoV-2 infection in Rhesus macaq | 7.41E-47 | 4.35E-45 | 5.22 | 554.64 | 8 | 500 genes downregulated by MHV-A59 in murine sple | 1.64E-20 | 9.67E-19 | 2.93 | 133.34 |
| 9 | Top 500 up genes for SARS-CoV-2 infection 48 hpi in human | 1.74E-46 | 9.06E-45 | 5.29 | 557.29 | 9 | Top 500 up genes for SARS-CoV-2 infection in Rhesus m | 2.03E-18 | 1.07E-16 | 2.77 | 112.78 |
| 10 | 500 genes up-regulated by SARS-CoV-2 in human Calu3 cells | 5.53E-42 | 2.60E-40 | 4.72 | 448.55 | 10 | COVID-19 patients PBMC down | 4.11E-18 | 1.95E-16 | 4.21 | 168.68 |
| HMDB metabolites | |||||||||||
| 1 | Hexadecanoyl-CoA (HMDB01338) | 0.0008561 | 0.08978 | 5 | 35.34 | 1 | UTP (HMDB00285) | 3.18E-03 | 0.7378 | 2.93 | 16.88 |
| 2 | Carbon dioxide (HMDB01967) | 0.001614 | 0.08978 | 2.48 | 15.96 | 2 | N1-Acetylspermine (HMDB01186) | 0.007051 | 0.7378 | 5.9 | 29.23 |
| 3 | Iron (HMDB00692) | 0.004501 | 0.08978 | 1.81 | 9.79 | 3 | CTP (HMDB00082) | 0.01801 | 0.7378 | 2.44 | 9.81 |
| 4 | Palmitic acid (HMDB00220) | 0.004897 | 0.08978 | 5.9 | 31.38 | 4 | D-Ribose 5-phosphate (HMDB01548) | 0.03787 | 0.7378 | 4.04 | 13.24 |
| 5 | 1-(1Z-hexadecenyl)-sn-glycero- 3-phosphoethanolamine (HM) | 0.01007 | 0.08978 | 3.38 | 15.54 | 5 | D-ribulose 5-phosphate (HMDB00618) | 0.06715 | 0.7378 | 3.14 | 8.49 |
| 6 | 1-hexadecyl-2-(9Z-octadecenoyl)- sn-glycero-3-phosphoethan | 0.01007 | 0.08978 | 3.38 | 15.54 | 6 | Guanosine triphosphate (HMDB01273) | 0.1137 | 0.7378 | 1.19 | 2.59 |
| 7 | PE (P-16:0/14:0) (HMDB11335) | 0.01007 | 0.08978 | 3.38 | 15.54 | 7 | Acetic acid (HMDB00042) | 0.1417 | 0.7378 | 1.85 | 3.61 |
| 8 | PE (P-16:0/14:1 (9Z)) (HMDB11336) | 0.01007 | 0.08978 | 3.38 | 15.54 | 8 | Glutathione (HMDB00125) | 0.1417 | 0.7378 | 1.67 | 3.25 |
| 9 | PE (P-16:0/15:0) (HMDB11337) | 0.01007 | 0.08978 | 3.38 | 15.54 | 9 | C33H56N7O17P3S (HMDB03712) | 0.1469 | 0.7378 | 2.65 | 5.09 |
| 10 | PE (P-16:0/16:1 (9Z)) (HMDB11339) | 0.01007 | 0.08978 | 3.38 | 15.54 | 10 | Guanosine diphosphate (HMDB01201) | 0.1512 | 0.7378 | 1.5 | 2.83 |
| Disease perturbations from GEO up | Disease perturbations from GEO down | ||||||||||
| 1 | Septic shock C0036983 human GSE9692 sample 307 | 3.84E-104 | 3.22E-101 | 9.6 | 2286.83 | 1 | H1N1 DOID-0050211 human GSE27131 sample 514 | 3.71E-60 | 3.12E-57 | 13.9 | 1901.98 |
| 2 | H1N1 DOID-0050211 human GSE27131 sample 514 | 1.32E-87 | 5.53E-85 | 9.23 | 1846.55 | 2 | Huntington’s disease DOID-12858 human GSE24250 sa | 1.11E-39 | 4.65E-37 | 5.56 | 499.14 |
| 3 | Dengue disease DOID-12205 human GSE51808 sample 556 | 1.56E-65 | 4.36E-63 | 7.91 | 1181.06 | 3 | Autism spectrum disorder DOID-0060041 human GSE2 | 3.31E-38 | 9.25E-36 | 5.51 | 475.7 |
| 4 | Dengue hemorrhagic fever DOID-12206 human GSE51808 sa | 2.79E-61 | 5.85E-59 | 7.5 | 1045.05 | 4 | Huntington’s disease DOID-12858 human GSE24250 sa | 1.33E-29 | 2.80E-27 | 3.89 | 258.36 |
| 5 | Swine influenza DOID-0050211 human GSE48466 sample 49 | 1.05E-48 | 1.76E-46 | 7.61 | 840.42 | 5 | PD DOID-14330 human GSE6613 samp | 1.32E-27 | 2.22E-25 | 4.05 | 250.45 |
| 6 | Dengue fever DOID-12206 human GSE51808 sample 447 | 8.59E-48 | 1.20E-45 | 6.66 | 722.06 | 6 | Rotavirus infection of children C1442797 human GSE27 | 3.81E-27 | 5.33E-25 | 4.14 | 252.05 |
| 7 | sJIA DOID-848 human | 3.12E-41 | 3.74E-39 | 5.6 | 522.38 | 7 | Overexertion C0161750 human GSE3606 sample 286 | 8.53E-27 | 1.02E-24 | 4.06 | 243.52 |
| 8 | Autism spectrum disorder DOID-0060041 human GSE25507 s | 4.19E-41 | 4.40E-39 | 6.18 | 574.71 | 8 | SLE DOID-9074 human GSE1 | 1.65E-26 | 1.73E-24 | 4.26 | 252.95 |
| 9 | SLE DOID-9074 human GSE3 | 1.03E-34 | 9.64E-33 | 5.57 | 435.66 | 9 | Pulmonary hypertension C0020542 human GSE703 sa | 6.99E-26 | 6.51E-24 | 5.82 | 337.03 |
| 10 | West Nile fever DOID-2366 human GSE30719 sample 874 | 2.97E-33 | 2.49E-31 | 3.95 | 295.57 | 10 | Acute myeloid leukemia DOID-9119 human GSE9476 sa | 1.42E-25 | 1.19E-23 | 3.32 | 190 |
| WikiPathway 2021 Human | |||||||||||
| 1 | Immune response to tuberculosis WP4197 | 4.64E-10 | 2.61E-07 | 16.61 | 356.88 | 1 | Cytoplasmic Ribosomal Proteins WP477 | 4.62E-28 | 2.61E-25 | 11.67 | 734.52 |
| 2 | Retinoblastoma gene in cancer WP2446 | 2.13E-09 | 4.17E-07 | 4.83 | 96.4 | 2 | TCR and Co-stimulatory Signaling WP2583 | 4.08E-08 | 1.15E-05 | 8.75 | 148.85 |
| 3 | Type II IFN signaling (IFNG) WP619 | 2.23E-09 | 4.17E-07 | 9.08 | 180.97 | 3 | IL-18 signaling pathway WP4754 | 2.41E-07 | 4.55E-05 | 2.21 | 33.61 |
| 4 | Hepatitis B infection WP4666 | 5.81E-08 | 0.000008147 | 3.21 | 53.55 | 4 | Modulators of TCR signaling and T cell activation WP50 | 4.17E-07 | 5.89E-05 | 4.31 | 63.29 |
| 5 | Host-pathogen interaction of human coronaviruses - interfer | 2.03E-07 | 0.0000228 | 7.86 | 121.14 | 5 | Cancer immunotherapy by PD-1 blockade WP4585 | 5.39E-07 | 0.00006094 | 9.23 | 133.24 |
| 6 | Integrated breast cancer pathway WP1984 | 5.86E-07 | 0.00005244 | 2.98 | 42.7 | 6 | TCR signaling pathway WP69 | 0.000002305 | 0.0001973 | 3.22 | 41.76 |
| 7 | Type I IFN induction and signaling during SARS-CoV-2 | 6.54E-07 | 0.00005244 | 7.7 | 109.67 | 7 | T-cell antigen receptor (TCR) pathway during Staphylo | 0.000002444 | 0.0001973 | 3.91 | 50.56 |
| 8 | VEGFA-VEGFR2 signaling pathway WP3888 | 0.000001743 | 0.000102 | 1.98 | 26.29 | 8 | Pathogenesis of SARS-CoV-2 mediated by nsp9-nsp10 | 0.0000111 | 0.0007838 | 7.8 | 89.04 |
| 9 | Novel intracellular components of RLR p | 0.000001748 | 0.000102 | 4.58 | 60.69 | 9 | Allograft rejection WP2328 | 0.00001844 | 0.001158 | 2.94 | 32.02 |
| 10 | SARS-CoV-2 innate immunity evasion and cell-specific immu | 0.000001819 | 0.000102 | 4.32 | 57.09 | 10 | TGF-beta signalling pathway WP366 | 0.00002109 | 0.001192 | 2.47 | 26.62 |
| KEGG 2021 Human | |||||||||||
| 1 | Epstein-Barr virus infection | 1.81E-17 | 5.65E-15 | 4.49 | 173.12 | 1 | Ribosome | 1.51E-14 | 4.69E-12 | 4.06 | 129.18 |
| 2 | NOD-like receptor signaling pathway | 9.64E-13 | 1.51E-10 | 3.9 | 108.02 | 2 | Coronavirus disease | 4.41E-12 | 6.85E-10 | 2.98 | 78.05 |
| 3 | Hepatitis B | 2.09E-10 | 2.18E-08 | 3.65 | 81.42 | 3 | Herpes simplex virus 1 infection | 2.34E-08 | 2.42E-06 | 1.93 | 33.87 |
| 4 | Toxoplasmosis | 1.33E-08 | 0.000001037 | 3.93 | 71.23 | 4 | Th17 cell differentiation | 3.23E-08 | 2.51E-06 | 3.47 | 59.87 |
| 5 | Measles | 1.81E-08 | 0.000001134 | 3.48 | 62.03 | 5 | T cell receptor signaling pathway | 1.78E-07 | 0.00001107 | 3.32 | 51.53 |
| 6 | TNF signalling pathway | 5.22E-08 | 0.00000272 | 3.75 | 62.85 | 6 | Hematopoietic cell lineage | 1.88E-06 | 0.00009752 | 3.1 | 40.85 |
| 7 | Cellular senescence | 1.15E-07 | 0.000005158 | 3.11 | 49.64 | 7 | Th1 and Th2 cell differentiation | 3.73E-06 | 0.0001657 | 3.12 | 38.95 |
| 8 | Influenza A | 1.59E-07 | 0.000006235 | 2.95 | 46.1 | 8 | NF-kappa B signalling pathway | 1.68E-05 | 0.0006515 | 2.75 | 30.28 |
| 9 | Hepatitis C | 4.23E-07 | 0.00001472 | 2.97 | 43.54 | 9 | Primary immunodeficiency | 0.00002252 | 0.0007782 | 4.63 | 49.56 |
| 10 | Human T-cell leukaemia virus 1 infection | 6.73E-07 | 0.00002106 | 2.55 | 36.26 | 10 | Human T-cell leukaemia virus 1 infection | 0.00005237 | 0.001629 | 2 | 19.75 |
| Reactome 2016 | |||||||||||
| 1 | Immune system homo sapiens R-HSA-168256 | 9.35E-20 | 1.20E-16 | 2.07 | 90.9 | 1 | L13a-mediated translational silencing of ceruloplasmin | 1.06E-33 | 7.04E-31 | 11.95 | 907.58 |
| 2 | IFN signaling homo sapiens R-HSA-913531 | 2.67E-14 | 1.71E-11 | 4.02 | 125.62 | 2 | 3’ -UTR-mediated translational regulation homo sapien | 1.06E-33 | 7.04E-31 | 11.95 | 907.58 |
| 3 | IFN alpha/beta signaling homo sapiens R-HSA-909733 | 5.40E-14 | 2.30E-11 | 8 | 244.26 | 3 | GTP hydrolysis and joining of the 60S ribosomal subuni | 2.44E-33 | 1.08E-30 | 11.66 | 875.68 |
| 4 | Cytokine signalling in immune system homo sapiens R-HSA-1 | 1.18E-11 | 3.77E-09 | 2.24 | 56.25 | 4 | Formation of a pool of free 40S subunits homo sapiens | 4.36E-33 | 1.44E-30 | 13.19 | 983.08 |
| 5 | IFN gamma signaling homo sapiens R-HSA-877300 | 1.76E-11 | 4.50E-09 | 5.38 | 133.12 | 5 | Gene expression homo sapiens R-HSA-74160 | 3.87E-32 | 1.03E-29 | 2.22 | 160.35 |
| 6 | Hemostasis homo sapiens R-HSA-109582 | 2.42E-08 | 0.000005155 | 2.03 | 35.68 | 6 | Cap-dependent translation initiation homo sapiens R- | 5.52E-32 | 1.05E-29 | 10.33 | 743.31 |
| 7 | Cell cycle, mitotic homo sapiens R-HSA-69278 | 6.58E-08 | 0.00001203 | 2.1 | 34.74 | 7 | Eukaryotic translation initiation homo sapiens R-HSA-7 | 5.52E-32 | 1.05E-29 | 10.33 | 743.31 |
| 8 | Innate immune system homo sapiens R-HSA-168249 | 2.83E-07 | 0.00004517 | 1.76 | 26.49 | 8 | Peptide chain elongation homo sapiens R-HSA-156902 | 4.18E-31 | 6.93E-29 | 14.44 | 1010.02 |
| 9 | Cell cycle homo sapiens R-HSA-1640170 | 0.000001127 | 0.0001517 | 1.86 | 25.5 | 9 | Eukaryotic translation elongation homo sapiens R-HSA | 3.09E-30 | 4.10E-28 | 12.86 | 873.97 |
| 10 | TLR4 cascade homo sapiens R-HSA-16 | 0.000001279 | 0.0001517 | 3.19 | 43.3 | 10 | NMD independent of the | 3.09E-30 | 4.10E-28 | 12.86 | 873.97 |
| DisGeNET | |||||||||||
| 1 | Influenza | 7.90E-20 | 6.35E-16 | 2.87 | 126.25 | 1 | Chronic lymphocytic leukaemia | 5.02E-09 | 4.01E-05 | 1.63 | 31.06 |
| 2 | Lupus erythematosus, systemic | 3.24E-18 | 1.30E-14 | 2.21 | 89.13 | 2 | Lymphoma | 1.02E-07 | 2.78E-04 | 1.52 | 24.42 |
| 3 | Breast Carcinoma | 2.15E-17 | 5.76E-14 | 1.59 | 61.08 | 3 | T-Cell Lymphoma | 1.04E-07 | 2.78E-04 | 2.13 | 34.17 |
| 4 | Malignant neoplasm of breast | 2.90E-17 | 5.82E-14 | 1.59 | 60.37 | 4 | HIV coinfection | 4.65E-07 | 9.29E-04 | 3.21 | 46.87 |
| 5 | Neoplasm metastasis | 1.84E-16 | 2.94E-13 | 1.62 | 58.69 | 5 | Leukemia | 9.12E-07 | 0.001458 | 1.39 | 19.28 |
| 6 | Leukemia | 2.20E-16 | 2.94E-13 | 1.84 | 66.48 | 6 | Pallor | 2.05E-06 | 0.002729 | 4.15 | 54.35 |
| 7 | Leukemia, myelocytic, acute | 9.01E-16 | 9.60E-13 | 1.88 | 65.06 | 7 | Lymphoma, T-cell, cutaneous | 2.46E-06 | 0.002807 | 2.1 | 27.14 |
| 8 | Rheumatoid arthritis | 9.56E-16 | 9.60E-13 | 1.85 | 63.81 | 8 | Peripheral T-cell lymphoma | 4.04E-06 | 0.003967 | 2.72 | 33.83 |
| 9 | Liver cirrhosis, experimental | 1.40E-15 | 1.25E-12 | 2.31 | 79 | 9 | Reticulocyte count (procedure) | 5.53E-06 | 0.003967 | 2.23 | 26.96 |
| 10 | Malignant neoplasm of prostate | 1.92E-15 | 1.55E-12 | 1.64 | 55.62 | 10 | Leukaemia, T-cell | 5.55E-06 | 0.003967 | 1.86 | 22.51 |
| Drug perturbations from GEO up | Drug perturbations from GEO down | ||||||||||
| 1 | IFN beta-1a DB00060 human GSE26104 sample 3187 | 2.56E-60 | 2.32E-57 | 7.12 | 976.82 | 1 | Mycophenolic acid DB01024 human GSE14630 sample | 1.25E-20 | 1.13E-17 | 3.82 | 175.18 |
| 2 | IFN beta-1a DB00060 human GSE26104 sample 3186 | 2.25E-55 | 1.02E-52 | 6.37 | 802.17 | 2 | Etanercept DB00005 human GSE7524 sample 3295 | 8.24E-20 | 3.72E-17 | 3.1 | 136.14 |
| 3 | IFN beta-1a DB00060 human GSE26104 sample 3188 | 2.30E-48 | 6.95E-46 | 6.31 | 692.02 | 3 | Motexafin gadolinium (4 h) DB05428 human GSE2189 s | 4.70E-18 | 1.41E-15 | 3.28 | 130.89 |
| 4 | IFN-β-1b (Betaferon) DB00068 human GSE26104 sam | 5.91E-47 | 1.34E-44 | 6.12 | 651.95 | 4 | Resveratrol DB02709 human GSE36930 sample 3497 | 3.21E-17 | 7.24E-15 | 3.13 | 119.02 |
| 5 | IFN beta-1b DB00068 human GSE26104 sample 3185 | 4.25E-43 | 7.69E-41 | 6.17 | 601.78 | 5 | Zinc acetate 11192 human GSE2964 sample 3589 | 5.19E-17 | 9.36E-15 | 4.06 | 152.08 |
| 6 | Lipopolysaccharide 11970143 human GSE40885 sample 2475 | 6.01E-42 | 9.07E-40 | 6.14 | 583.21 | 6 | Tibolone 444008 human GSE12446 sample 3204 | 1.99E-16 | 3.00E-14 | 3.07 | 110.81 |
| 7 | Quercetin 5280343 human GSE13899 sample 3182 | 4.45E-36 | 5.75E-34 | 5.71 | 464.93 | 7 | Estradiol 5757 human GSE4668 sample 3063 | 4.25E-16 | 5.48E-14 | 3.5 | 123.81 |
| 8 | Lipopolysaccharide 11970143 human GSE3140 sample 3594 | 9.01E-34 | 1.02E-31 | 5.16 | 392.58 | 8 | Atorvastatin DB01076 human GSE11393 sample 3196 | 6.24E-16 | 7.04E-14 | 3.06 | 107.17 |
| 9 | Lipopolysaccharide 11970143 human GSE5504 sample 3486 | 1.27E-33 | 1.27E-31 | 4.8 | 363.67 | 9 | Estradiol DB00783 human GSE4668 sample 2727 | 2.82E-15 | 2.83E-13 | 3.28 | 109.78 |
| 10 | Lipopolysaccharide 11970143 human GSE5504 sample 3485 | 4.31E-33 | 3.90E-31 | 4.42 | 329.03 | 10 | Promyelocytic leukaemia DB00755 human GSE5007 sam | 3.85E-15 | 3.47E-13 | 3.04 | 100.76 |
SARS-CoV-2, severe acute respiratory syndrome coronavirus 2; TGF, tumor growth factor; IL, interleukin; TCR, T-cell receptor; TNF, tumor necrosis factor; RLR, RIG-I-like receptor; sJIA, systemic juvenile idiopathic arthritis; SLE, systemic lupus erythematosus; GEO, Gene Expression Omnibus; IFN, interferon; PD, parkinson’s disease; NMD, nonsense mediated decay; OR, odds ratio; TLR4, toll like receptor 4
Atorvastatin, lipopolysaccharide (LPS), and interferon (IFN)-β responsive genes are differentially upregulated in Indian and western populations: In Using Drug perturbations from GEO up analysis, it was found that the cholesterol lowering drug atorvastatin ranked at 3rd position among severe COVID-19 cases in the USA, 2nd amond severe Indian and 3rd asymptomatic Indian cases. Atorvastatin was not enriched in any other western country (Supplementary Table IIA-H). Therefore, atorvastatin itself, or metabolites or nutrients that act as atorvastatin may have a role in regulating the severity of COVID-19. In contrast, LPS and IFN-β-1a were enriched in all samples except in severe Indian cases. The ranks of LPS and INF-β in asymptomatic Indian cases and in severe USA cases were lower as compared to other severe cases from western countries (Supplementary Table IIA-H).
Palmitic acid (PA) and CO2 responsive genes upregulated in western severe COVID cases and zinc, iron and carbohydrate responsive genes are enriched in Indian patients: The HMDB-based metabolite analysis showed that carbon dioxide (CO2), hexadecanoyl-CoA, dermatan sulfate, arachidonic acid and palmitic acid (PA) were differentially enriched for individual western country samples (Supplementary Table IIE-G). However, for combined western samples, CO2, hexadecanoyl-CoA and PA were enriched (Supplementary Table IIH). In contrast, upregulation of zinc and glucose responsive genes (Supplementary Table IIB) was observed in severe south Indian samples and upregulation of iron, sodium, ammonia, folic acid, riboflavin etc. responsive genes in asymptomatic south Indian samples (Supplementary Table IIA). Importantly, the combined severe Indian samples gave a result similar to the south Indian samples. We found that zinc, iron and glucose responsive genes were over represented (Supplementary Table IIB and D). Based on the enrichment ranks, our results indicated that blood iron levels might be associated with COVID-19 severity22. Taken together, there were distinct metabolic processes and metabolites governing the severity of COVID-19 between western and Indian populations and they could potentially be linked to the dietary habits of these populations.
PA and CO2 responsive genes were associated with increased sphingolipid metabolism and PPAR signaling: In a separate Enrichr analysis, we found that the CO2 responsive genes were associated with the TCA cycle, sphingolipid metabolism, proximal tubule transport and O2/CO2 exchange in erythrocyte pathways in western samples. Upregulation of these genes was associated with chronic obstructive pulmonary disease (COPD)-like conditions and metabolic acidosis. In addition, we found curcumin and iron having some association with CO2 (Supplementary Table IIIA and B). On the other hand, a separate nutrigenomics analysis of the CO2 responsive genes showed that curcumin negatively regulated CO2 production (Supplementary Table IIIA and C). Conversely, the PA responsive genes were associated with fatty acid beta-oxidation, PPAR signalling and sphingolipid metabolism. Furthermore, the PA responsive genes also had indicative association with hypertension and obesity like comorbid conditions in COVID-19 (Supplementary Table IIIA and D).
| CO2 | Hexadecanoyl- CoA | Palmitic acid | |||
|---|---|---|---|---|---|
| Gene | FC | Gene | FC | Gene | FC |
| CA12 | 1.23598 | SPTLC1 | ACOT7 | ||
| ALAS2 | 1.03539 | ACOT7 | ACSL1 | ||
| ALAS1 | 1.02261 | SPTLC2 | PPT1 | ||
| IDH1 | 1.73029 | ACSL1 | ACSL4 | ||
| PLOD3 | 1.5762 | PPT1 | ACSL3 | ||
| CSAD | 1.32374 | ACSL4 | |||
| PGD | 1.21 | ACADM | |||
| UPB1 | 1.51613 | ACSL3 | |||
| PISD | 1.30123 | ||||
| SPTLC1 | 1.03358 | ||||
| SPTLC2 | 1.06864 | ||||
| ASPH | 1.77 | ||||
| CA2 | 2.9536 | ||||
| CA5A | 2.39933 | ||||
| CA4 | 1.41429 | ||||
| HPD | 1.98665 | ||||
| DLD | 1.19746 | ||||
| Upregulated genes | |||||
|---|---|---|---|---|---|
| Index | Name | P | Adjusted P | OR | Combined score |
| COVID-19 related gene sets 2021 | |||||
| 1 | Top 500 up genes for SARS-CoV-2 infection in Rhesus macaqu | 5.10E-04 | 3.62E-02 | 13.24 | 100.35 |
| 2 | Top 500 upregulated genes for SARS-CoV-2 infection in huma | 5.85E-04 | 3.62E-02 | 12.75 | 94.89 |
| 3 | Top 500 upregulated genes for SARS-CoV-2 infection in huma | 5.89E-04 | 3.62E-02 | 12.72 | 94.58 |
| 4 | 500 genes down-regulated by MHV-A59 in murine liver cells f | 4.66E-03 | 1.21E-01 | 10.33 | 55.46 |
| 5 | 500 genes down-regulated by SARS-CoV-2 in human Organoid | 5.43E-03 | 1.21E-01 | 9.77 | 50.94 |
| 6 | 447 genes down-regulated by SARS-CoV-2 infection in Vero E | 5.86E-03 | 1.21E-01 | 9.5 | 48.8 |
| 7 | Top 500 down genes for SARS-CoV-2 infection in Rhesus maca | 6.24E-03 | 1.21E-01 | 9.28 | 47.12 |
| 8 | Top 500 up genes for SARS-CoV-2 infection in Rhesus macaqu | 6.82E-03 | 1.21E-01 | 8.97 | 44.76 |
| 9 | Top 500 up genes for SARS-CoV-2 infection in Rhesus macaqu | 7.19E-03 | 1.21E-01 | 8.8 | 43.43 |
| 10 | 500 genes up-regulated by SARS-CoV-2 in human Caco2 cells a | 7.48E-03 | 1.21E-01 | 8.67 | 42.44 |
| HMDB metabolites | |||||
| 1 | Carbon dioxide (HMDB01967) | 2.54E-41 | 3.80E-38 | 338470 | 31637759.6 |
| 2 | Pyridoxal 5’- phosphate (HMDB01491) | 1.23E-11 | 9.18E-09 | 181.12 | 4549.91 |
| 3 | CO3 (HMDB03538) | 2.54E-10 | 1.26E-07 | 682.87 | 15086.94 |
| 4 | Coenzyme A (HMDB01423) | 1.36E-08 | 0.00000506 | 91.08 | 1650.05 |
| 5 | Oxoglutaric acid (HMDB00208) | 2.59E-08 | 0.000007732 | 180.53 | 3153.79 |
| 6 | Succinyl coenzyme A (HMDB01022) | 1.85E-07 | 0.00004593 | 389.06 | 6032.53 |
| 7 | Zinc (HMDB01303) | 6.00E-07 | 0.0001279 | 78.52 | 1124.96 |
| 8 | ACO (HMDB01206) | 0.00001451 | 0.002707 | 79.08 | 881.06 |
| 9 | Iron (HMDB00692) | 0.00001813 | 0.003008 | 32.22 | 351.82 |
| 10 | Formyl-CoA (HMDB03419) | 0.00005275 | 0.007875 | 242.08 | 2384.53 |
| Disease perturbations from GEO up | |||||
| 1 | COPD - C0024117 hum | 3.05E-04 | 7.32E-02 | 15.22 | 123.2 |
| 2 | Huntington’s disease DOID-12858 human GSE24250 sample 4 | 8.07E-04 | 7.32E-02 | 19.43 | 138.37 |
| 3 | Macular degeneration C0024437 human GSE1719 sample 46 | 1.33E-03 | 7.32E-02 | 16.26 | 107.61 |
| 4 | Rheumatoid arthritis DOID-7148 human GSE15573 sample 904 | 1.58E-03 | 7.32E-02 | 15.3 | 98.69 |
| 5 | Adenocarcinoma of lung C0152013 human GSE1987 sample 4 | 1.61E-03 | 7.32E-02 | 15.19 | 97.66 |
| 6 | Cardiomyopathy DOID-0050700 human GSE9128 sample 781 | 1.77E-03 | 7.32E-02 | 14.71 | 93.23 |
| 7 | Essential Hypertension C0085580 rat GSE1675 sample 412 | 1.93E-03 | 7.32E-02 | 14.25 | 89.11 |
| 8 | Hepatitis C DOID-1883 human GSE20948 sample 597 | 1.96E-03 | 7.32E-02 | 14.16 | 88.24 |
| 9 | Adenocarcinoma of esophagus C0279628 human GSE1420 sa | 2.30E-03 | 7.32E-02 | 13.38 | 81.31 |
| 10 | Esophagus adenocarcinoma DOID-4914 human GSE1420 samp | 2.38E-03 | 7.32E-02 | 13.21 | 79.8 |
| WikiPathway 2021 Human | |||||
| 1 | Heme Biosynthesis WP561 | 2.44E-05 | 0.0007562 | 380.5 | 4041.3 |
| 2 | TCA Cycle and Deficiency of Pyruvate Dehydrogenase complex | 0.00008103 | 0.001256 | 190.18 | 1791.63 |
| 3 | Sphingolipid Metabolism (general overview) WP4725 | 0.0001856 | 0.001563 | 120.98 | 1039.39 |
| 4 | Sphingolipid Metabolism (integrated pathway) WP4726 | 0.0002017 | 0.001563 | 115.71 | 984.56 |
| 5 | Sphingolipid pathway WP1422 | 0.0002917 | 0.001808 | 95.02 | 773.48 |
| 6 | Proximal tubule transport WP4917 | 0.001056 | 0.005455 | 48.31 | 331.09 |
| 7 | Amino Acid metabolism WP3925 | 0.002664 | 0.0118 | 29.8 | 176.68 |
| 8 | Pentose Phosphate Metabolism WP134 | 0.005936 | 0.023 | 208.09 | 1066.85 |
| 9 | Cytosine methylation WP3585 | 0.007625 | 0.02624 | 156.05 | 760.96 |
| 10 | Trans-sulfuration pathway WP2333 | 0.008469 | 0.02624 | 138.71 | 661.82 |
| KEGG 2021 Human | |||||
| 1 | Nitrogen metabolism | 8.44E-10 | 2.87E-08 | 472.66 | 9875.27 |
| 2 | Glycine, serine, and threonine metabolism | 0.000004942 | 0.00008402 | 115.52 | 1411.36 |
| 3 | Proximal tubule bicarbonate reclamation | 0.0001702 | 0.001929 | 126.74 | 1099.91 |
| 4 | Citrate cycle (TCA cycle) | 0.0002917 | 0.002479 | 95.02 | 773.48 |
| 5 | Porphyrin and chlorophyll metabolism | 0.0006016 | 0.004091 | 64.85 | 480.94 |
| 6 | Sphingolipid metabolism | 0.0007811 | 0.004426 | 56.56 | 404.65 |
| 7 | Glutathione metabolism | 0.001056 | 0.005129 | 48.31 | 331.09 |
| 8 | Lysine degradation | 0.001288 | 0.005475 | 43.55 | 289.77 |
| 9 | Sphingolipid signaling pathway | 0.004503 | 0.01701 | 22.64 | 122.32 |
| 10 | Taurine and hypotaurine metabolism | 0.009313 | 0.02878 | 124.83 | 583.76 |
| Reactome 2016 | |||||
| 1 | Metabolism Homo sapiens R-HSA-1430728 | 5.30E-14 | 2.70E-12 | 71.67 | 2190.93 |
| 2 | Reversible hydration of carbon dioxide Homo sapiens R-HSA-1 | 1.76E-10 | 4.49E-09 | 768.27 | 17255.78 |
| 3 | Erythrocytes take up oxygen and release carbon dioxide Hom | 0.00001898 | 0.0003227 | 443.93 | 4826.43 |
| 4 | Heme biosynthesis Homo sapiens R-HSA-189451 | 0.00003723 | 0.0003796 | 295.91 | 3017.8 |
| 5 | Erythrocytes take up carbon dioxide and release oxygen Hom | 0.00004466 | 0.0003796 | 266.31 | 2667.47 |
| 6 | O2/CO2 exchange in erythrocytes Homo sapiens R-HSA-14809 | 0.00004466 | 0.0003796 | 266.31 | 2667.47 |
| 7 | Metabolism of porphyrins Homo sapiens R-HSA-189445 | 0.00009179 | 0.0006688 | 177.49 | 1649.98 |
| Disease perturbations from GEO up | |||||
| 8 | Metabolism of lipids and lipoproteins Homo sapiens R-HSA-55 | 0.0001702 | 0.001085 | 12.31 | 106.87 |
| 9 | Sphingolipid de novo biosynthesis Homo sapiens R-HSA-1660 | 0.0003535 | 0.002003 | 85.82 | 682.02 |
| 10 | Histidine, lysine, phenylalanine, tyrosine, proline, and tryptoph | 0.0005468 | 0.002789 | 68.18 | 512.16 |
| DisGeNET | |||||
| 1 | Acute intermittent porphyria | 6.16E-06 | 0.002821 | 106.84 | 1281.71 |
| 2 | Intellectual disability | 7.79E-06 | 0.002821 | 10.02 | 117.89 |
| 3 | Distal sensory impairment of all modalities | 0.00002439 | 0.004493 | 380.5 | 4041.3 |
| 4 | Metabolic acidosis | 0.00002695 | 0.004493 | 63.7 | 670.18 |
| 5 | Erythropoietic Protoporphyria | 0.00003723 | 0.004493 | 295.91 | 3017.8 |
| 6 | Sensory Neuropathy, Hereditary | 0.00003723 | 0.004493 | 295.91 | 3017.8 |
| 7 | Hereditary Sensory and Autonomic Neuropathies | 0.00008103 | 0.007384 | 190.18 | 1791.63 |
| 8 | Neuropathy | 0.00008188 | 0.007384 | 21.65 | 203.75 |
| 9 | Hereditary Sensory Autonomic Neuropathy, Type 1 | 0.00009179 | 0.007384 | 177.49 | 1649.98 |
| 10 | Glaucoma | 0.0002535 | 0.0167 | 16 | 132.5 |
| Drug perturbations from GEO up | |||||
| 1 | Haloperidol 3559 mouse GSE6511 sample 2471 | 2.56E-04 | 3.77E-02 | 15.96 | 131.98 |
| 2 | Ubiquinol 9962735 mouse GSE15129 sample 3465 | 2.69E-04 | 3.77E-02 | 15.75 | 129.44 |
| 3 | Fenretinide 5288209 rat GSE3952 sample 3559 | 3.15E-04 | 3.77E-02 | 27.06 | 218.21 |
| 4 | Quercetin DB04216 mouse GSE38136 sample 3437 | 5.71E-04 | 4.70E-02 | 12.83 | 95.82 |
| 5 | Curcumin 969516 human GSE16160 sample 3425 | 1.01E-03 | 4.70E-02 | 17.93 | 123.64 |
| 6 | Troglitazone DB00197 rat GSE21329 sample 2832 | 1.09E-03 | 4.70E-02 | 17.48 | 119.28 |
| 7 | Quercetin DB04216 mouse GSE38136 sample 3438 | 1.21E-03 | 4.70E-02 | 16.85 | 113.2 |
| 8 | Rosiglitazone DB00412 human GSE5679 sample 2809 | 1.36E-03 | 4.70E-02 | 16.13 | 106.42 |
| 9 | Rosiglitazone 77999 rat GSE5509 sample 3567 | 1.58E-03 | 4.70E-02 | 15.3 | 98.69 |
| 10 | Methylprednisolone 6741 rat GSE490 sample 3673 | 1.58E-03 | 4.70E-02 | 15.3 | 98.69 |
OR, odds ratio; SARS-CoV-2, severe acute respiratory syndrome coronavirus 2; GEO, Gene Expression Omnibus; COPD, chronic obstructive pulmonary disease
| Experiment info | Genes | Nes | Molecular function enrichment |
|---|---|---|---|
| GSE20940 MACROPHAGES LACTOBACILLUSRHAMNOSUS (LC705) 6H Details | 3 | 0.8101309 | Analysis |
| GSE20940 MACROPHAGES LACTOBACILLUSRHAMNOSUS (LGG) 24H Details | 3 | −0.5839413 | Analysis |
| GSE20940 MACROPHAGES LACTOBACILLUSRHAMNOSUS (LC705) 24H Details | 3 | -0.5604759 | Analysis |
| GSE20940 MACROPHAGES LACTOBACILLUSRHAMNOSUS (LGG) 6H Details | 1 | 0.7909029 | Analysis |
| GSE10896 U937MONOCYTES CURCUMIN 18H Details | 5 | 0.7564358 | Analysis |
| GSE10896 U937MONOCYTES CURCUMIN 4H Details | 4 | −0.80686986 | Analysis |
| GSE20114 PATIENTS ERYTHROCYTES DHA Details | 2 | −0.90099186 | Analysis |
| Upregulated genes | |||||
|---|---|---|---|---|---|
| Index | Name | P | Adjusted P | OR | Combined score |
| COVID-19 related gene sets 2021 | |||||
| 1 | 332 proteins enriched in AP-MS using various SARS-CoV-2 pro | 2.37E-04 | 1.16E-02 | 35.97 | 300.34 |
| 2 | COVID19-All 332 protein host PPI from Krogan | 2.37E-04 | 1.16E-02 | 35.97 | 300.34 |
| 3 | Top 500 up genes for SARS-CoV-2 infection in Rhesus macaqu | 6.70E-04 | 2.19E-02 | 24.98 | 182.55 |
| 4 | COVID19-Nsp10 protein host PPI from Krogan | 5.59E-03 | 4.80E-02 | 219.55 | 1138.86 |
| 5 | SARS-CoV perturbation; 338 up genes from GEN3VA; Human | 6.46E-03 | 4.80E-02 | 21.03 | 106 |
| 6 | Down regulated gene from COVID-19 infected bronchoalveola | 8.88E-03 | 4.80E-02 | 17.78 | 83.97 |
| 7 | Top 500 upregulated genes in mouse fat with SARS-CoV-2 infe | 9.49E-03 | 4.80E-02 | 17.16 | 79.91 |
| 8 | Top 500 up genes for SARS-CoV-2 infection Day 21 in ferret rig | 1.02E-02 | 4.80E-02 | 16.49 | 75.61 |
| 9 | 500 genes down-regulated by MHV-A59 in murine liver cells f | 1.08E-02 | 4.80E-02 | 16 | 72.43 |
| 10 | COVID19-M protein host PPI from Krogan | 1.19E-02 | 4.80E-02 | 98.34 | 435.44 |
| HMDB metabolites | |||||
| 1 | Hexadecanoyl-CoA (HMDB01338) | 1.70E-24 | 2.73E-23 | 159800 | 8745757.6 |
| 2 | Coenzyme A (HMDB01423) | 3.74E-16 | 2.99E-15 | 1565.4 | 55606.06 |
| 3 | Palmitic acid (HMDB00220) | 4.20E-15 | 2.24E-14 | 3700.56 | 122502.6 |
| 4 | L-Serine (HMDB00187) | 1.27E-05 | 0.00005084 | 555 | 6256.61 |
| 5 | Adenosine monophosphate (HMDB00045) | 8.59E-05 | 0.000271 | 51.1 | 478.47 |
| 6 | Phosphoric acid (HMDB02142) | 1.17E-04 | 0.000271 | 45.89 | 415.4 |
| 7 | Pyrophosphate (HMDB00250) | 1.19E-04 | 0.000271 | 45.71 | 413.26 |
| 8 | Pyridoxal 5’- phosphate (HMDB01491) | 0.0002965 | 0.000593 | 103.79 | 843.15 |
| 9 | Carbon dioxide (HMDB01967) | 0.0005509 | 0.0009794 | 75.39 | 565.75 |
| 10 | Magnesium (HMDB00547) | 0.000633 | 0.001013 | 25.48 | 187.64 |
| Disease perturbations from GEO up | |||||
| 1 | Essential Hypertension C0085580 rat GSE1675 sample 412 | 1.75E-04 | 1.98E-02 | 39.92 | 345.32 |
| 2 | Nicotine dependence DOID-0050742 human GSE6264 sample | 3.28E-04 | 1.98E-02 | 32.08 | 257.37 |
| 3 | Obesity C0028754 human GSE474 sample 236 | 3.31E-04 | 1.98E-02 | 32 | 256.41 |
| 4 | Chronic myeloid leukemia DOID-8552 mouse GSE48438 sampl | 3.55E-04 | 1.98E-02 | 31.22 | 247.98 |
| 5 | Colitis DOID-0060180 human GSE6731 sample 761 | 3.86E-03 | 7.41E-02 | 27.55 | 153.1 |
| 6 | Neurofibromatosis DOID-8712 mouse GSE1482 sample 665 | 4.65E-03 | 7.41E-02 | 25.01 | 134.32 |
| 7 | Huntington’s disease DOID-12858 human GSE1751 sample 79 | 4.92E-03 | 7.41E-02 | 24.26 | 128.9 |
| 8 | Hyperlipidemia C0020473 rat GSE3512 sample 38 | 5.07E-03 | 7.41E-02 | 23.9 | 126.32 |
| 9 | Bacterial Infection C0004623 human GSE4748 sample 414 | 5.32E-03 | 7.41E-02 | 23.3 | 122.01 |
| 10 | Hepatitis C DOID-1883 human GSE20948 sample 599 | 5.73E-03 | 7.41E-02 | 22.41 | 115.7 |
| WikiPathway 2021 Human | |||||
| 1 | Mitochondrial LC-Fatty Acid Beta-Oxidation WP368 | 2.49E-11 | 5.24E-10 | 1536.85 | 37521.5 |
| 2 | Fatty acid beta-oxidation WP143 | 4.85E-10 | 5.09E-09 | 665.4 | 14271.22 |
| 3 | PPAR signaling pathway WP3942 | 7.97E-09 | 5.58E-08 | 316.33 | 5898.92 |
| 4 | Omega-3/Omega-6 FA synthesis WP4723 | 1.53E-08 | 6.41E-08 | 1089.87 | 19615.82 |
| 5 | Omega-9 FA synthesis WP4724 | 1.53E-08 | 6.41E-08 | 1089.87 | 19615.82 |
| 6 | Fatty acid transporters WP5061 | 3.42E-08 | 1.20E-07 | 799.08 | 13737.58 |
| 7 | Fatty Acid Biosynthesis WP357 | 6.45E-08 | 1.93E-07 | 630.73 | 10443.16 |
| 8 | Ferroptosis WP4313 | 4.12E-07 | 0.000001082 | 323.59 | 4757.48 |
| 9 | Cholesterol metabolism (includes both Bloch and Kandutsch-R | 6.33E-07 | 0.000001476 | 278.36 | 3973.18 |
| 10 | Thermogenesis WP4321 | 0.000008408 | 0.00001766 | 113.64 | 1328.04 |
| KEGG 2021 Human | |||||
| 1 | Fatty acid degradation | 1.29E-09 | 1.67E-08 | 511.62 | 10472.91 |
| 2 | PPAR signalling pathway | 1.20E-08 | 7.77E-08 | 284.6 | 5191.86 |
| 3 | Fatty acid biosynthesis | 3.42E-08 | 1.48E-07 | 799.08 | 13737.58 |
| 4 | Ferroptosis | 4.45E-07 | 0.000001445 | 315.06 | 4608.17 |
| 5 | Adipocytokine signalling pathway | 0.000002174 | 0.000005651 | 181.15 | 2361.98 |
| 6 | Peroxisome | 0.000003665 | 0.000007941 | 151.24 | 1893 |
| 7 | Fatty acid elongation | 0.00004889 | 0.0000908 | 266.23 | 2642.52 |
| 8 | Thermogenesis | 0.00008265 | 0.0001343 | 51.78 | 486.78 |
| 9 | Sphingolipid metabolism | 0.0001631 | 0.0002356 | 141.45 | 1233.64 |
| 10 | Sphingolipid signaling pathway | 0.0009602 | 0.001248 | 56.62 | 393.44 |
| Reactome 2016 | |||||
| 1 | Metabolism of lipids and lipoproteins Homo sapiens R-HSA-55 | 1.33E-12 | 1.60E-11 | 154728 | 4230838.99 |
| 2 | Fatty Acyl-CoA Biosynthesis Homo sapiens R-HSA-75105 | 1.78E-12 | 1.60E-11 | 898.87 | 24319.3 |
| 3 | Triglyceride Biosynthesis Homo sapiens R-HSA-75109 | 1.86E-11 | 1.12E-10 | 544.56 | 13454.14 |
| 4 | Fatty acid, triacylglycerol, and ketone body metabolism Homo | 4.19E-11 | 1.88E-10 | 281.25 | 6720.88 |
| 5 | Synthesis of very long-chain fatty acyl-CoAs Homo sapiens R-H | 6.27E-11 | 2.26E-10 | 1175 | 27604.36 |
| 6 | Metabolism Homo sapiens R-HSA-1430728 | 6.77E-09 | 2.03E-08 | 144736 | 2722611.02 |
| 7 | Sphingolipid de novo biosynthesis Homo sapiens R-HSA-1660 | 0.00007346 | 0.0001889 | 214.63 | 2043.05 |
| 8 | Sphingolipid metabolism Homo sapiens R-HSA-428157 | 0.0003727 | 0.0008387 | 92.22 | 728.06 |
| 9 | PPARA activates gene expression Homo sapiens R-HSA-19897 | 0.0008665 | 0.001643 | 59.7 | 420.97 |
| 10 | Regulation of lipid metabolism by Peroxisome proliferator-act | 0.0009128 | 0.001643 | 58.12 | 406.8 |
| DisGeNET | |||||
| 1 | Distal sensory impairment of all modalities | 5.03E-06 | 0.001095 | 951.67 | 11609.88 |
| 2 | Sensory neuropathy, Hereditary | 7.69E-06 | 0.001095 | 740.11 | 8715.63 |
| 3 | Hereditary sensory and autonomic neuropathies | 0.00001675 | 0.001353 | 475.67 | 5230.88 |
| 4 | Hereditary sensory autonomic neuropathy, Type 1 | 0.00001898 | 0.001353 | 443.93 | 4826.43 |
| 5 | Pain Disorder | 0.00006056 | 0.003452 | 237.67 | 2308.19 |
| 6 | Sensorimotor neuropathy | 0.00009771 | 0.004094 | 184.78 | 1706.14 |
| 7 | Arthritis, adjuvant-induced | 0.0001313 | 0.004094 | 158.33 | 1415.15 |
| 8 | Arthritis, collagen-induced | 0.0001313 | 0.004094 | 158.33 | 1415.15 |
| 9 | Arthritis, experimental | 0.0001313 | 0.004094 | 158.33 | 1415.15 |
| 10 | Dysautonomia, familial | 0.0001436 | 0.004094 | 151.12 | 1337.16 |
| Drug perturbations from GEO up | |||||
| 1 | Rosiglitazone 77999 mouse GSE11343 sample 2672 | 1.34E-04 | 7.16E-03 | 43.83 | 390.87 |
| 2 | Triiodothyronine-[13C6] hydrochloride (T3 thyronine) 534422 | 1.82E-04 | 7.16E-03 | 39.38 | 339.11 |
| 3 | Perfluorooctanoic Acid 9554 mouse GSE13044 sample 3517 | 1.91E-04 | 7.16E-03 | 38.73 | 331.59 |
| 4 | Lapatinib DB01259 human GSE38376 sample 2586 | 1.93E-04 | 7.16E-03 | 38.6 | 330.12 |
| 5 | Triiodothyronine-[13C6] hydrochloride (T3 thyronine) 534422 | 1.97E-04 | 7.16E-03 | 38.35 | 327.21 |
| 6 | Perfluorooctanoic acid 9554 mouse GSE13044 sample 3516 | 2.12E-04 | 7.16E-03 | 37.36 | 316 |
| 7 | Triiodothyronine-[13C6] hydrochloride (T3 thyronine) 534422 | 2.14E-04 | 7.16E-03 | 37.24 | 314.64 |
| 8 | Triiodothyronine-[13C6] hydrochloride (T3 thyronine) 534422 | 2.39E-04 | 7.16E-03 | 35.86 | 299.09 |
| 9 | Pioglitazone DB01132 rat GSE21329 sample 2842 | 2.76E-04 | 7.16E-03 | 34.07 | 279.14 |
| 10 | TRIIODOTHYRONINE-[13C6] hydrochloride (T3 thyronine) 534422 | 3.08E-04 | 7.16E-03 | 32.81 | 265.33 |
GEO, Gene Expression Omnibus; OR, odds ratio; SARS-CoV-2, severe acute respiratory syndrome coronavirus 2; HMDB, human metabolome database; MHV, mouse hepatitis virus; PPI, propetin protein interaction; PPAR, peroxisome proliferator-activated receptor
Curcumin determines COVID-19 severity: In NutriGenome DB analyses, three datasets were found to be related to blood based gene expression in response to Lactobacillus rhamnosus, curcumin and docosahexaenoic acid. Based on NOG calculation, the number of response genes (RG) for these three nutrients were higher in severe cases as compared to asymptomatic COVID-19 in south Indian samples. The number of RGs was higher in severe western samples than in severe Indian cases (Fig. 3A and Supplementary Table IIIE). The NES analysis yielded positive scores for curcumin, which was higher in cases of asymptomatic Indian samples as compared to severe cases from both north and south India. The NES of curcumin RGs was negative for all western samples. Importantly, we found that the negative NES of curcumin RGs of all severe western samples was lower after treatment with curcumin for 4 h than 18 h (Fig. 3B and Supplementary Table IIIE).
| GEO ID | Cell/cell line | Treatment/food/nutrient | Asymp_Ind (S) | Severe_Ind (S) | Severe_Ind (N) | Severe_Greece | Severe_USA | Severe_Spain | ||||||
|---|---|---|---|---|---|---|---|---|---|---|---|---|---|---|
| Genes | NES | Genes | NES | Genes | NES | Genes | NES | Genes | NES | |||||
| GSE20940 | Macrophages | Macrophages L. rhamnosus (LC705) -24H | 130 | 4.1646204 | 190 | 3.1264043 | 104 | 0.91462755 | 458 | 3.1838264 | 306 | 0.788777 | 17 | −0.995084 |
| GSE20940 | Macrophages | Macrophages L. rhamnosus (LGG)-24H | 131 | 4.0703416 | 185 | 2.9378035 | 104 | −0.45948756 | 402 | 2.345102 | 298 | 1.211781 | 17 | −0.896059 |
| GSE20940 | Macrophages | Macrophages L. rhamnosus (LC705) -6H | 113 | 3.0153298 | 163 | 2.2732701 | 92 | −0.47376412 | 359 | 2.0160742 | 284 | 0.945468 | 20 | 1.375418 |
| GSE20940 | Macrophages | Macrophages L. rhamnosus (LGG) -6H | 115 | 2.938601 | 177 | 1.8950764 | 94 | 0.65645915 | 382 | 1.9588804 | 287 | 0.774275 | 19 | 1.473976 |
| GSE10896 | Monocytes | Monocytes Curcumin - 18H | 100 | 1.5762284 | 138 | 0.8184068 | 93 | 0.8737108 | 229 | −1.129351 | 243 | −0.816069 | 1 | −0.911989 |
| GSE10896 | Monocytes | Monocytes Curcumin - 4H | 76 | 1.296273 | 123 | 0.7495827 | 95 | 1.1188513 | 196 | −1.4995713 | 211 | −1.254086 | 3 | −1.422674 |
| GSE20114 | Erythrocytes | Erythrocytes DHA | 95 | 1.069365 | 98 | −0.59336984 | 99 | −0.44983175 | 227 | −0.57671726 | 234 | −1.493321 | 2 | 1.291555 |
| NOG calculation | ||||||||||||||
| Asymp Ind (S) | Severe Ind (S) | Severe Ind (N) | Severe Ind (Combined) | Severe Greece | Severe USA | Severe Spain | West (Combined) | |||||||
| GSE20940 | Macrophages | Macrophages L. rhamnosus (LC705) -24H | 130 | 190 | 104 | 243 | 458 | 306 | 17 | 682 | ||||
| GSE20940 | Macrophages | Macrophages L. rhamnosus (LGG)-24H | 131 | 185 | 104 | 243 | 402 | 298 | 17 | 635 | ||||
| GSE20940 | Macrophages | Macrophages L. rhamnosus (LC705) -6H | 113 | 163 | 92 | 229 | 359 | 284 | 20 | 568 | ||||
| GSE20940 | Macrophages | Macrophages L. rhamnosus (LGG) -6H | 115 | 177 | 94 | 214 | 382 | 287 | 19 | 595 | ||||
| GSE10896 | Monocytes | Monocytes Curcumin - 18H | 100 | 138 | 93 | 189 | 229 | 243 | 1 | 417 | ||||
| GSE10896 | Monocytes | Monocytes Curcumin - 4H | 76 | 123 | 95 | 163 | 196 | 211 | 3 | 363 | ||||
| GSE20114 | Erythrocytes | Erythrocytes DHA | 95 | 98 | 99 | 143 | 227 | 234 | 2 | 425 | ||||
| NES-based analysis | ||||||||||||||
| GSE20940 | Macrophages | Macrophages L. rhamnosus (LC705) -24H | 4.1646204 | 3.1264043 | 0.91462755 | 2.6152196 | 3.1838264 | 0.78877735 | −0.9950839 | 1.5016583 | ||||
| GSE20940 | Macrophages | Macrophages L. rhamnosus (LGG)-24H | 4.0703416 | 2.9378035 | −0.45948756 | 2.390768 | 2.345102 | 1.2117805 | −0.8960592 | 1.4213064 | ||||
| GSE20940 | Macrophages | Macrophages L. rhamnosus (LC705) -6H | 3.0153298 | 2.2732701 | −0.47376412 | 1.5741 | 2.0160742 | 0.94546837 | 1.375418 | −0.80026525 | ||||
| NES-based analysis | ||||||||||||||
| Asymp Ind (S) | Severe Ind (S) | Severe Ind (N) | Severe Ind (Combined) | Severe Greece | Severe USA | Severe Spain | West (Combined) | |||||||
| GSE20940 | Macrophages | Macrophages L. rhamnosus (LGG) -6H | 2.938601 | 1.8950764 | 0.65645915 | 1.9463556 | 1.9588804 | 0.7742753 | 1.4739759 | 1.0705541 | ||||
| GSE10896 | Monocytes | Monocytes Curcumin - 18H | 1.5762284 | 0.8184068 | 0.8737108 | 0.9986717 | −1.129351 | −0.8160694 | −0.91198856 | −1.0653994 | ||||
| GSE10896 | Monocytes | Monocytes Curcumin - 4H | 1.296273 | 0.7495827 | 1.1188513 | 0.8244213 | −1.4995713 | −1.2540859 | −1.4226735 | −3.610044 | ||||
| GSE20114 | Erythrocytes | Erythrocytes DHA | 1.069365 | −0.59336984 | −0.44983175 | −0.7448559 | −0.57671726 | −1.4933206 | 1.291555 | −1.0177021 | ||||
GEO, Gene Expression Omnibus; NES, net enrichment score; NOG, number of overlapping genes; L. rhamnosus, Lactobacillus rhamnosus
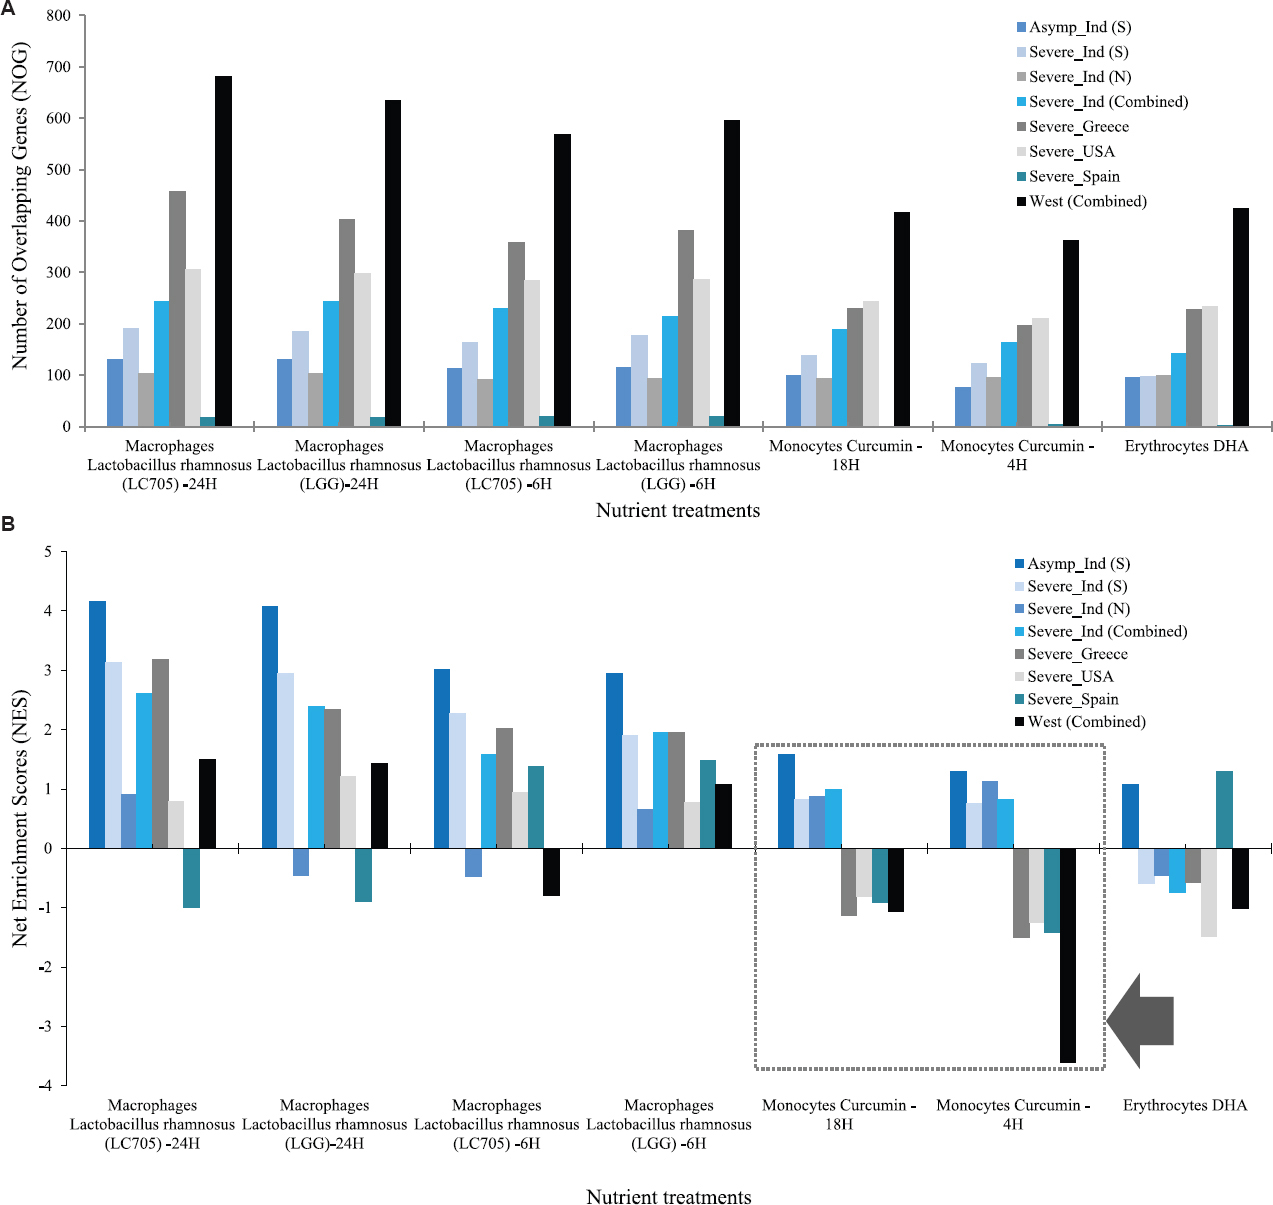
- Blood nutrigenomics profiles of samples from western and Indian populations. (A) Number of L. rhamnosus, curcumin, and DHA responsive genes increased with increased disease severity in India and the USA and Greece, but not in Spain. (B) The NES-based analysis shows that the curcumin response score is positive and highest in samples from asymptomatic cases in India compared to the severe cases in India. In contrast, the NES is negative for curcumin in all samples in western countries (Black arrow). NES, net enrichment score.
Diets and nutrients correlated with pathways and metabolites related to COVID-19 severity: A linear correlation was observed between diet or nutrients and molecular mechanisms of COVID-19 severity. The cytokine storm, intussusceptive angiogenesis and respiratory acidosis related pathways, which were exclusively upregulated in severe western samples, were positively associated with PA and CO2 but were negatively correlated with curcumin. The sources of the PA and CO2 were red meat, processed food and dairy products. PA also increased the expression of ACE2 leading to more severe COVID-19. The low iron and zinc levels in red meat and dairy products of western diets had the probability of increasing the severity and death from COVID-19. In contrast, south Indian Idli and other food components are high in iron and zinc content. Curcumin also reduces respiratory acidosis and blood glucose levels (Fig. 4)18,22,23-75. Therefore, regular intake of an Indian diet rich in zinc, iron, curcumin, fibre, catechins and EGCG have the potential to reduce the severity and death due to COVID-19. However, consumption of regular western diet, mainly red meat, processed food, dairy products, coffee and alcohol could activate the pathways and factors associated with COVID-19 severity, which may therefore contribute to the increased deaths observed in western countries.
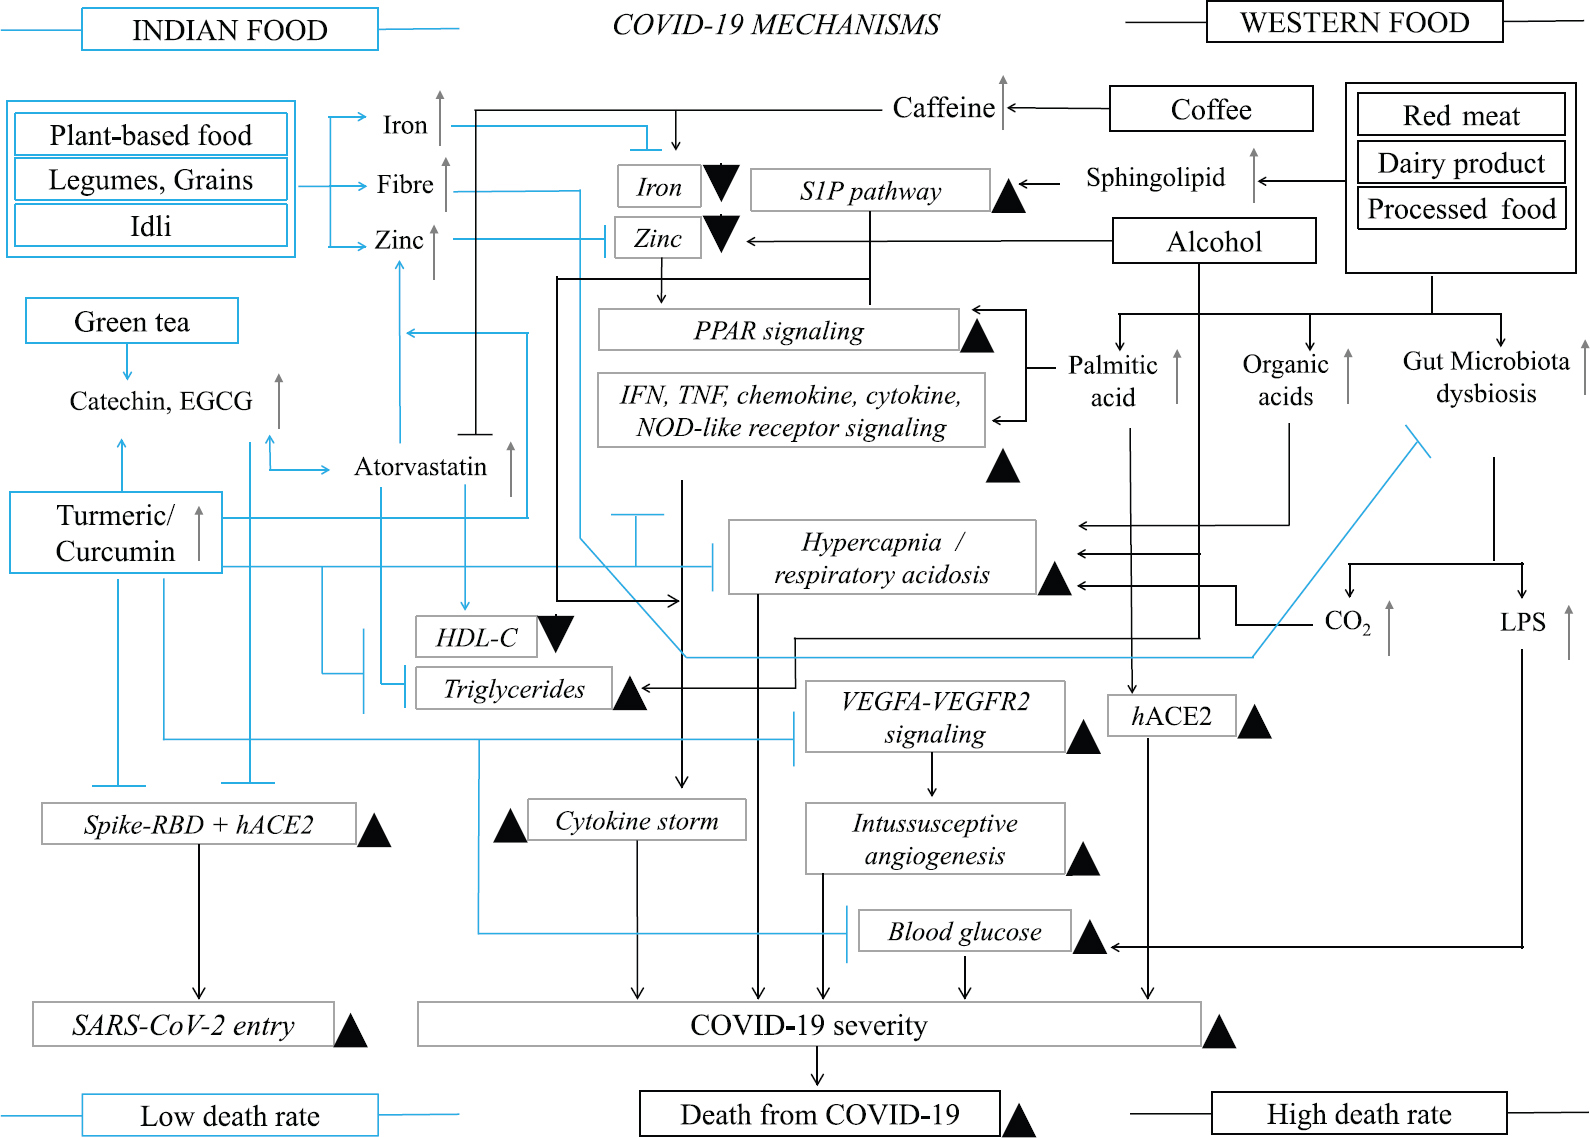
- Key dietary and nutrient interactions with COVID-19 pathways at molecular level that determines COVID-19 severity and fatality rates in Indian and Western populations. The figure is developed based on our results, available literature18,22-75.↑ and ▲ indicate upregulation or increase, ← is activation, and Tdenotes inhibition.
Discussion
Low serum iron and zinc levels are associated with increased severity and death rates in COVID-1922 (Fig. 4). Zinc is used for treatment of COVID-1923. Dairy products are low in iron contents and alcohol consumption decreases plasma zinc levels. Notably, Idli (zinc 23.4 mg/g, iron 46.4 mg/g, 3-4% fibre)18 contains higher amount of zinc and iron than meat and its zinc content is twice the amount available from vitamin tablets containing zinc which were consumed (10 mg), commonly during the COVID-19 pandemic. Similarly, rice, legumes, wheat, chickpeas and Rajma, which are daily used ingredients in north Indian diet21, are rich in vitamins, minerals, zinc and iron. Hence, Indian foods, in contrast to the western diet are able to maintain high blood zinc and iron levels, which can lower the COVID-19 severity and death rates in India (Fig. 4)18,22-75.
Low plasma HDL-C and high triglyceride levels increase COVID-19 severity24. High alcohol consumption in western countries, increases plasma triglyceride and atorvastatin, a triglyceride lowering medicine and increases HDL-C in the blood is enriched in the Indian samples. Atorvastatin reduces COVID-19 severity, contributes to shortening hospitalization and reduction in COVID-19 mortality25. Catechins present in tea are the natural substitutes of statin. Catechin and EGCG in tea block SARS-CoV-2 Spike RBD and ACE2 interactions and prevent initiation of SARS-CoV-2 infection. India is the largest tea consumer (Supplementary Table I), where >64 per cent of Indians drink tea26. Furthermore, curcumin, consumed in India, enhances the permeability and lipid-lowering effect of EGCG. In contrast, caffeine in coffee reduces statin function, decreases zinc levels, and also inhibits iron absorption27 (Fig. 4). Coffee is the main source of caffeine and is consumed in large quantities per capita in western countries, whereas the consumption is negligible in India (Supplementary Table 1). Therefore, while coffee consumption contribute to COVID-19 severity in western countries; high consumption of tea is potentially associated with less severe form of COVID-19 and lower death rates in India.
Low zinc and high PA-containing western food induces pro-inflammatory activity of PPAR signalling and enhances SARS-CoV-2 pathogenesis by activating pro-inflammatory cytokines, chemokines, NF-κB and ACE228. Western foods also contain high amounts of sphingolipids which activate the SphK1/S1P/S1PR (S1P) hyperinflammatory response pathway and increased COVID-19 severity29 (Fig. 4). We found that PA and sphingolipids, the two key metabolites of western foods, were associated with the activation of COVID-19 severity pathways and higher death rates in western countries (Fig. 4)18,22-75.
Meat, fish, eggs, cheese and alcohol induce hypercapnia and respiratory acidosis30. Furthermore, high animal fat and protein diets, which are low in fibres, are known to cause gut microbiota dysbiosis leading to increased CO2 and hypercapnia and LPS-induced increased blood glucose levels31. Both the hypercapnia and increased blood glucose levels are associated with COVID-19 severity (Fig. 4)18,22-75. CO2 RGs are highly enriched in patients with severe COVID-19 in western countries, but not in India. Therefore, the western diet might be associated with hypercapnia and increased blood glucose levels contributing to increase the severity and death during COVID-19 in western populations.
Curcumin, the active compound of turmeric is a prophylactic agent9 and treatment with curcumin reduces the severity and mortality from COVID-1932. Curcumin increases serum zinc levels33 and it blocks the Spike RBD interaction with ACE2, decreases cholesterol and triglyceride levels, and inhibits hypercapnia, IFN, TNF, chemokine, cytokine, VEGFA-VEGFR2-mediated intussusceptive angiogenesis and NOD-like receptor signaling pathways, which are associated with cytokine storm leading to severity and deaths from COVID-1934,35 (Fig. 4).
We found that all these pathways were exclusively upregulated in western but not in Indian samples (Supplementary Table II). Further, we identified curcumin to be inversely associated with COVID-19 severity (Fig. 3 and Supplementary Table IIIE). Curcumin is the active compound of turmeric and turmeric is regularly consumed (>2 g/day/capita) spice/condiment in India, but not in western countries (Fig. 2 and Supplementary Table I). Therefore, daily intake of turmeric in India maintains high concentration of body curcumin that inhibits almost all molecular mechanisms associated with SARS-CoV-2 infection and COVID-19 severity, leading to less severe disease outcome and lower death rates in India as compared to western countries (Fig. 4)18,22,23-75.
Although our findings are significant from the nutrigenomics point of view, there are some limitations. Our study does not represent a precise case-control study where specific foods were used as treatment. Rather, we considered population-specific dietary habits and transcriptomes of patients. We also did not consider factors such as major clinical determinants of health outcomes, co-morbid conditions, age, gender, vaccination status, nutrition index, food habit diversity, smoking status and other biological and socio-economic factors. Our sample sizes were small and hence establishing statistically significant correlation is not possible.
In conclusion, our results suggested that Indian dietary habits and food ingredients could possibly be associated with reduced severity and death rates from COVID-19 in India. While the western diet and food components seemed to contribute to severity of COVID-19, Indian dietary habits and food ingredients might play a role in reduction of severity of COVID-19 disease. Regular consumption of plant-based foods, Idli, whole grains, legume, vegetables, tea and turmeric (curcumin) diets were probably the key elements behind reduced severity and lower death rates from COVID-19 in India, despite the much higher population density in the country as compared to western countries. However, additional large scale and intervention trial are required for drawing definitive inference in this direction.
Financial support and sponsorship
None.
Conflicts of interest
None.
Supplementary Figure
Supplementary Figure Differences between Indian and western food and spices. The figure is developed based on Supplementary Table 1, several web portals, following literature1-13.Acknowledgment:
Authors acknowledge the Omics Science Network (RECOM) and CNPq for their support. AAA acknowledges the Taif University Researchers Supporting Program and KJA would like to acknowledge the support from Deanship of Scientific Research, Taif University, Saudi Arabia.
References
- The prognostic value of comorbidity for the severity of COVID-19: A systematic review and meta-analysis study. PLoS One. 2021;16:e0246190.
- [Google Scholar]
- Genetic polymorphisms associated with susceptibility to COVID-19 disease and severity: A systematic review and meta-analysis. PLoS One. 2022;17:e0270627.
- [Google Scholar]
- Plant-based diets, pescatarian diets and COVID-19 severity: A population-based case-control study in six countries. BMJ Nutr Prev Health. 2021;4:257-66.
- [Google Scholar]
- Inverse association between the Mediterranean diet and COVID-19 risk in Lebanon: A case-control study. Front Nutr. 2021;8:707359.
- [Google Scholar]
- The impact of nutrition on COVID-19 susceptibility and long-term consequences. Brain Behav Immun. 2020;87:53-4.
- [Google Scholar]
- Platelet gene expression and function in patients with COVID-19. Blood. 2020;136:1317-29.
- [Google Scholar]
- A novel multi-omics-based highly accurate prediction of symptoms, comorbid conditions, and possible long-term complications of COVID-19. Mol Omics. 2021;17:317-37.
- [Google Scholar]
- Multi-omics-based identification of SARS-CoV-2 infection biology and candidate drugs against COVID-19. Comput Biol Med. 2020;126:104051.
- [Google Scholar]
- Predicting COVID-19-comorbidity pathway crosstalk-based targets and drugs: Towards personalized COVID-19 management. Biomedicines. 2021;9:556.
- [Google Scholar]
- RNA sequencing in COVID-19 patients identifies neutrophil activation biomarkers as a promising diagnostic platform for infections. PLoS One. 2022;17:e0261679.
- [Google Scholar]
- Transcriptomic similarities and differences in host response between SARS-CoV-2 and other viral infections. iScience. 2021;24:101947.
- [Google Scholar]
- Alterations in circulating monocytes predict COVID-19 severity and include chromatin modifications still detectable six months after recovery. Biomedicines. 20211253;9
- [Google Scholar]
- voom: Precision weights unlock linear model analysis tools for RNA-seq read counts. Genome Biol. 2014;15:R29.
- [Google Scholar]
- Upregulation of cytokine signalling in platelets increases risk of thrombophilia in severe COVID-19 patients. Blood Cells Mol Dis. 2022;94:102653.
- [Google Scholar]
- NutriGenomeDB: A nutrigenomics exploratory and analytical platform. Database (Oxford). 2019;2019:baz097.
- [Google Scholar]
- A comprehensive review on rasam: A South Indian traditional functional food. Pharmacogn Rev. 2017;11:73-82.
- [Google Scholar]
- Sambar, an Indian dish prevents the development of dimethyl hydrazine-induced colon cancer: A preclinical study. Pharmacogn Mag. 2016;12((Suppl 4)):S441-5.
- [Google Scholar]
- The demographic diversity of food intake and prevalence of kidney stone diseases in the Indian continent. Foods. 2019;8:37.
- [Google Scholar]
- Serum iron level as a potential predictor of coronavirus disease 2019 severity and mortality: A retrospective study. Open Forum Infect Dis. 2020;7:ofaa250.
- [Google Scholar]
- Zinc and COVID-19: Basis of current clinical trials. Biol Trace Elem Res. 2021;199:2882-92.
- [Google Scholar]
- Atorvastatin reduces the severity of COVID-19: A nationwide, total population-based, case-control study. COVID. 2022;2:398-406.
- [Google Scholar]
- Executive summary of study on domestic consumption of tea in India. 2018. Available from:http://www.teaboard.gov.in/pdf/Executive_Summary_Tea_Consumption_20062018_pdf5 940.pdf
- [Google Scholar]
- Inhibition of iron absorption by coffee and the reduced risk of type 2 diabetes mellitus. Arch Intern Med. 2007;167:204-5.
- [Google Scholar]
- The effect of palmitic acid on inflammatory response in macrophages: An overview of molecular mechanisms. Inflamm Res. 2019;68:915-32.
- [Google Scholar]
- Sphingolipids in lung pathology in the coronavirus disease era: A review of sphingolipid involvement in the pathogenesis of lung damage. Front Physiol. 2021;12:760638.
- [Google Scholar]
- Diet-induced low-grade metabolic acidosis and clinical outcomes: A review. Nutrients. 2017;9:538.
- [Google Scholar]
- Gut microbiota in human metabolic health and disease. Nat Rev Microbiol. 2021;19:55-71.
- [Google Scholar]
- Oral curcumin with piperine as adjuvant therapy for the treatment of COVID-19: A randomized clinical trial. Front Pharmacol. 2021;12:669362.
- [Google Scholar]
- The effect of curcumin on serum copper and zinc and Zn/Cu ratio in individuals with metabolic syndrome: A double-blind clinical trial. J Diet. 2019;16((Suppl)):625-34.
- [Google Scholar]
- A comprehensive review on the therapeutic potential of Curcuma longa Linn. in relation to its major active constituent curcumin. Front Pharmacol. 2022;13:820806.
- [Google Scholar]
- Low serum levels of zinc and 25-hydroxyvitmain D as potential risk factors for COVID-19 susceptibility: A pilot case-control study. Eur J Clin Nutr. 2022;76:1297-302.
- [Google Scholar]
- COVID-19: Poor outcomes in patients with zinc deficiency. Int J Infect Dis. 2020;100:343-9.
- [Google Scholar]
- Section 2: Key nutrients delivered by red meat in the diet. Nutr Dietet. 2007;64((Suppl 4)):S113-9.
- [Google Scholar]
- Preparation of idli batter, its properties and nutritional improvement during fermentation. J Food Sci Technol. 2011;48:610-5.
- [Google Scholar]
- Chemical composition and sensory characteristics of Feta cheese fortified with iron and ascorbic acid. Dairy Sci Technol. 2016;96:579-89.
- [Google Scholar]
- Effect of disturbances of zinc and copper on the physical and mental health status of patients with alcohol dependence. Biol Trace Elem Res. 2018;183:9-15.
- [Google Scholar]
- The nutritional value and health benefits of chickpeas and hummus. Nutrients. 2016;8:766.
- [Google Scholar]
- Characterization of common bean (Phaseolus vulgaris L.). germplasm for morphological and seed nutrient traits from Western Himalayas. Legum Sci. 2021;3:e86.
- [Google Scholar]
- Effects of alcohol on plasma lipoproteins and cholesterol and triglyceride metabolism in man. J Lipid Res. 1984;25:486-96.
- [Google Scholar]
- Atorvastatin increases HDL cholesterol in hypercholesterolemic patients. Evidence of a relationship with baseline HDL cholesterol. Nutr Metab Cardiovasc Dis. 2002;12:24-8.
- [Google Scholar]
- Green tea extract: Chemistry, antioxidant properties and food applications –A review. J Funct Food. 2013;5:1529-41.
- [Google Scholar]
- Epigallocatechin gallate from green tea effectively blocks infection of SARS-CoV-2 and new variants by inhibiting spike binding to ACE2 receptor. Cell Biosci. 2021;11:168.
- [Google Scholar]
- Consumption pattern of coffee and tea in Karnataka. Karnataka J Agric Sci. 2009;22:824-7.
- [Google Scholar]
- Curcumin as a permeability enhancer enhanced the antihyperlipidemic activity of dietary green tea extract. BMC Complement Altern Med. 2019;19:129.
- [Google Scholar]
- Caffeinated coffee blunts the myocardial protective effects of statins against ischemia-reperfusion injury in the rat. Cardiovasc Drugs Ther. 2008;22:275-82.
- [Google Scholar]
- Caffeine decreases zinc and metallothionein levels in heart of newborn and adult rats. Pediatr Res. 1992;32:330-2.
- [Google Scholar]
- Caffeine in the diet: Country-level consumption and guidelines. Nutrients. 20181772;10
- [Google Scholar]
- Zinc deficiency induces vascular pro-inflammatory parameters associated with NF-kappaB and PPAR signaling. J Am Coll Nutr. 2008;27:577-87.
- [Google Scholar]
- Molecular mechanisms of palmitic acid augmentation in COVID-19 pathologies. Int J Mol Sci. 20217127;22
- [Google Scholar]
- Sphingolipids in food and the emerging importance of sphingolipids to nutrition. J Nutr. 1999;129:1239-50.
- [Google Scholar]
- Targeting the SphK-S1P-SIPR pathway as a potential therapeutic approach for COVID-19. Int J Mol Sci. 20207189;21
- [Google Scholar]
- Treatment of severe hypercapnic respiratory failure caused by SARS-CoV-2 lung injury with ECCO2 R using the hemolung respiratory assist system. Case Rep Crit Care. 2021;2021:9958343.
- [Google Scholar]
- The impact of COVID-19 on blood glucose: A systematic review and meta-analysis. Front Endocrinol (Lausanne). 2020;11:574541.
- [Google Scholar]
- Curcumin inhibits apoptosis and brain edema induced by hypoxia-hypercapnia brain damage in rat models. Am J Med Sci. 2015;349:521-5.
- [Google Scholar]
- Role of toll-like receptors in modulation of cytokine storm signaling in SARS-CoV-2-induced COVID-19. J Med Virol. 2022;94:869-77.
- [Google Scholar]
- Intussusceptive angiogenesis in Covid-19: Hypothesis on the significance and focus on the possible role of FGF2. Mol Biol Rep. 2020;47:8301-4.
- [Google Scholar]
- Fatty acid composition and cholesterol content of beef and chicken cuts from southern Brazil. Br J Pharml Sci. 2016;42:109-17.
- [Google Scholar]
- Fatty acid profile of milk and cheese from dairy cows supplemented a diet with palm kernel cake. Molecules. 2015;20:15434-48.
- [Google Scholar]
- Acid-base balance in alcohol users seen in an emergency room. Vet Hum Toxicol. 1991;33:482-5.
- [Google Scholar]
- Curcumin to inhibit binding of spike glycoprotein to ACE2 receptors: Computational modelling, simulations, and ADMET studies to explore curcuminoids against novel SARS-CoV-2 targets. RSC Adv. 2020;10:31385-99.
- [Google Scholar]
- Curcumin inhibits interferon-alpha induced NF-kappaB and COX-2 in human A549 non-small cell lung cancer cells. Biochem Biophys Res Commun. 2005;334:313-8.
- [Google Scholar]
- Curcumin, a potential inhibitor of up-regulation of TNF-alpha and IL-6 induced by palmitate in 3T3-L1 adipocytes through NF-kAPPAB and JNK pathway. Biomed Environ Sci. 2009;22:32-9.
- [Google Scholar]
- Curcumin inhibits angiogenesis and improves defective hematopoiesis induced by tumor-derived VEGF in tumor model through modulating VEGF-VEGFR2 signaling pathway. Oncotarget. 2015;6:19469-82.
- [Google Scholar]
- Curcumin represses NLRP3 inflammasome activation via TLR4/MyD88/NF-κB and P2X7R signaling in PMA-induced macrophages. Front Pharmacol. 2016;7:369.
- [Google Scholar]
- Functional foods and dietary supplements for the management of dyslipidaemia. Nat Rev Endocrinol. 2017;13:278-88.
- [Google Scholar]
- Significant inactivation of SARS-CoV-2 in vitro by a green tea catechin, a catechin-derivative, and black tea galloylated theaflavins. Molecules. 20213572;26
- [Google Scholar]
- Palmitic acid induces production of proinflammatory cytokine interleukin-8 from hepatocytes. Hepatology. 2007;46:823-30.
- [Google Scholar]
- Curcumin inhibits spike protein of new SARS-CoV-2 variant of concern (VOC) omicron, an in silico study. Comput Biol Med. 2022;146:105552.
- [Google Scholar]
- The inhibitory effect of curcumin on virus-induced cytokine storm and its potential use in the associated severe pneumonia. Front Cell Dev Biol. 2020;8:479.
- [Google Scholar]
- Global, regional, and national consumption of animal-source foods between 1990 and 2018: Findings from the Global Dietary Database. Lancet Planet Health. 2022;6:e243-56.
- [Google Scholar]
- Measurement of spices and seasonings in India: Opportunities for cancer epidemiology and prevention. Asian Pac J Cancer Prev. 2010;11:1621-9.
- [Google Scholar]
- A comparison of the Indian diet with the EAT-Lancet reference diet. BMC Public Health. 2020;20:812.
- [Google Scholar]
- The healthier the tastier? USA-India comparison studies on consumer perception of a nutritious agricultural product at different food processing levels. Front Public Health. 2016;4:6.
- [Google Scholar]
- Asian Indian views on diet and health in the United States: Importance of understanding cultural and social factors to address disparities. Fam Community Health. 2013;36:311-23.
- [Google Scholar]
- Ultra-processed foods and added sugars in the US diet: Evidence from a nationally representative cross-sectional study. BMJ Open. 2016;6:e009892.
- [Google Scholar]
- Sauces, spices, and condiments: definitions, potential benefits, consumption patterns, and global markets. Ann N Y Acad Sci. 2016;1379:3-16.
- [Google Scholar]
- Phytochemicals of coriander, cumin, fenugreek, fennel and black cumin: A preliminary study. Natl Acad Sci Lett. 2020;43:477-80.
- [Google Scholar]
- Global Nutrition Report. Country nutrition profiles: The global burden of malnutrition at a glance Available from: https://globalnutritionreport.org/resources/nutrition-profiles/
- Diff.Wiki. Difference between Indian food and American food Available from: https://diff.wiki/index.php/Difference_between_Indian_Food_and_American_Food


