
Translate this page into:
Vitamin D status among Kashmiri tribal population: A cross-sectional community-based study
For correspondence: Dr Mohd Ashraf Ganie, Department of Endocrinology & Metabolism, Sheri-Kashmir Institute of Medical Sciences, Srinagar 190 011, Jammu & Kashmir, India e-mail: ashraf.endo@gmail.com
-
Received: ,
This article was originally published by Wolters Kluwer - Medknow and was migrated to Scientific Scholar after the change of Publisher.
Abstract
Background & objectives:
Vitamin D deficiency (VDD) is prevalent across all age groups in general population of India but studies among tribal populations are scanty. This study aimed to evaluate the prevalence of VDD in the indigenous tribal population of the Kashmir valley and examine associated risk factors.
Methods:
In this cross-sectional investigation, a total of 1732 apparently healthy tribal participants (n=786 males and n=946 females) were sampled from five districts of Kashmir valley by using probability proportional to size method. Serum 25-hydroxy vitamin D (25(OH)D) levels were classified as per the Endocrine Society (ES) recommendations: deficiency (<20 ng/ml), insufficiency (20-30 ng/ml) and sufficiency (>30 ng/ml). The serum 25(OH)D levels were assessed in relation to various demographic characteristics such as age, sex, education, smoking, sun exposure, body mass index and physical activity.
Results:
The mean age of the male participants was 43.79±18.47 yr with a mean body mass index (BMI) of 20.50±7.53 kg/m2, while the mean age of female participants was 35.47±14.92 yr with mean BMI of 22.24±4.73 kg/m2. As per the ES guidelines 1143 of 1732 (66%) subjects had VDD, 254 (14.71%) had insufficient and 334 (19.3%) had sufficient serum 25(OH)D levels. VDD was equally prevalent in male and female participants. Serum 25(OH)D levels correlated positively with serum calcium, phosphorous and negatively with serum alkaline phosphatase. Gender, sun exposure, altitude, physical activity and BMI did not seem to contribute significantly to VDD risk.
Interpretation & conclusions:
VD deficiency is highly prevalent among Kashmiri tribals, although the magnitude seems to be lower as compared to the general population. These preliminary data are likely to pave way for further studies analyzing the impact of vitamin D supplementation with analysis of functional outcomes.
Keywords
25 OHD
25(OH)D – Bakarwal
Gujjar
Kashmiri
tribals
vitamin D deficiency

Vitamin D deficiency (VDD) is a common epidemic affecting around one billion people globally1. Despite being a tropical country with adequate day light and sunshine, 70-100 per cent of both rural and urban Indian population is reported to have VDD2. In India, VDD has been reported among school children, adults, young girls as well as pregnant women2,3. Besides bone mineral homeostasis, VDD has been associated with a wide range of non-skeletal effects including predisposition to different morbidities4 such as hypertension, obesity, hypertriglyceridemia, auto-immune disorders like rheumatoid arthritis5, multiple sclerosis6, ovarian, breast, and colorectal cancer7 and infections like tuberculosis8.
Kashmir valley located 1574-5425 feet above sea level (latitude: 32°44’N, longitude: 74°54’E) with an average ultraviolet (UV) index of seven, requiring 15-20 min of sunlight exposure for adequate vitamin D synthesis. Despite this, VDD is highly prevalent in Kashmir, with reported prevalence of 83 per cent in healthy adults9, 88.6 per cent in adolescent girls10 and 74 per cent in pregnant women11. Tribals constitute around 11.9 per cent of the total population of Jammu and Kashmir (J&K) and 1.43 per cent of the total tribal population of the country12, and experience considerable disparity compared to general population in terms of health facilities, education and economic pursuits. Cultural and social taboos dictate their lifestyle patterns such as clothing, nutrition and physical activity that may limit sun exposure. The lack of any fortification of staple foods, awareness about importance of sunshine and increasing cost of supplements etc. further increases their risk of VDD among these tribals.
While there is abundant data from studies assessing vitamin D status across various parts of India2, there is no comprehensive study to assess vitamin D among the tribals in general and those of J&K in particular. Therefore, the present study was undertaken to estimate vitamin D levels among tribal population of Kashmir valley and identify risk factors associated with it.
Material & Methods
This was a cross-sectional study conducted on the tribal population of Kashmir valley during August 2015 to June 2018, assessing the status of non-communicable diseases (NCDs). The study was carried out at Sher-I-Kashmir Institute of Medical Sciences, Kashmir, in collaboration with the All India Institute of Medical Sciences, New Delhi, India. The study protocol was approved by the respective Institutional Ethics Committees. The study was conducted as per Helsinki declaration 1975 and an informed consent was obtained from all the study participants prior to enrollment. For children below 18 yr, the consent was taken and questionnaire was completed with their parents’ assistance. Individuals who were mentally or physically challenged, pregnant women and those who refused to provide consent were excluded from the study.
Study design and participant selection: Of the 12 districts housing tribals (Gujjar and Bakarwal) in the valley of Kashmir, five (Anantnag, Pulwama, Ganderbal, Kupwara and Srinagar) were selected based on multi-stage cluster sampling with probability proportional to size by using random number table. From each district one tehsil, from each tehsil one block and from each block two villages with a cap of 1000 subjects per village were selected. The present study was a sub-study of a larger health survey of NCDs among the tribal population of Kashmir valley13. The villages were approached through local health services and village heads. Study protocol, information brochures, and pamphlets were translated in different languages (in English, Pahadi, Gojri and Urdu) for circulation in selected villages, in addition to verbal instructions delivered through village or religious heads or health workers.
Data collection and administration of study questionnaire: On the day of commencement of the study, the research team visited the selected villages along with the clinicians and participants were recruited through house-to-house survey after giving a talk about general health awareness and the purpose of the study. The modified WHO-STEPs questionnaire14 was used as a STEP-wise approach to collect data and measure NCD risk factors. Information were obtained on demographic profile socioeconomic condition, lifestyle issues, nutritional as well as health status of the population. Validation of the questionnaire was carried out by using a pretest in 100 subjects to assess its suitability and reproducibility. The questionnaire was administered through, face-to-face interview in local vernacular language by a limited number of trained researchers. Wherever applicable, pictures/ show cards were used to enhance the comprehension of the questionnaire.
The anthropometric measurements (weight, body mass index (BMI), height, waist circumference) of the study participants were recorded. Standardized digital instruments used for the study with respective specifications were: digital body weight scale (range 0.1-200 kg), stadiometer and measuring tape (Seca-213, Hamburg Germany). Measurement was recorded in triplicate and the final values were calculated as the average of the three readings. Similarly, blood pressure (BP) of the study participants was measured by a trained physician on the left arm and the average of three readings of systolic BP and diastolic BP was taken. The BP apparatus used for measuring the BP was calibrated according to the manufacturer’s instructions and Cronbach’s alpha of more than 0.8 was considered as acceptable inter- and intra-observer variations. In addition to brief general physical examination, features of rickets such as bowed legs, widening of wrists and large forehead were recorded.
Laboratory evaluation: After overnight fast, 10 ml venous blood sample was withdrawn from each participant for measurement of hemogram, calcium, phosphorus, glucose, lipids, liver and kidney function in addition to serum 25(OH)D. Blood samples were collected in a plain, ethylenediaminetetraacetic acid or fluoride containing vacutainer depending on the assay. Blood samples were centrifuged at the study site and aliquots were transported within 2 h in cold boxes to the storage sites. The samples for biochemical estimations were separated immediately for same day assays while those for hormonal and inflammatory marker estimations were stored at −80°C until the assay. Biochemical assays were conducted on autoanalyzer (Response 920, DIASYS Germany). Serum 25(OH)D levels were measured using fully automated high-throughput immunoassay system (ADVIA Centaur, Seimens Healthcare Diagnostics, Erlangen, Germany). The inter and intra-assay coefficients of variation were within the prescribed limits as per the manufacturer’s protocol.
Sample size calculation: With reference from a previous study9 and taking an estimated VDD prevalence of 60, 70, 80 and 90 per cent in age groups 0-20, 21-40, 41-60 and >60 yr respectively and a design effect of 1.5, we arrived at a sample size of 1608 participants. Taking into account a non-response rate of five per cent, a total of 1732 participants were enrolled. In order to reach this sample size, every fifth individual of the total population was invited for vitamin D estimation. Participants were recruited in equal proportion among age groups 21-40, 41-60 and >60 yr. There was however a low response rate (74%) in the 0-20 yr age group.
Statistical analyses: Data were analyzed using SPSS software, version 22 (SPSS Inc., Chicago, IL, USA) and are presented as percentage for nominal variables or mean±standard deviation (SD) for continuous variables. Normality assessment was examined using Shapiro-Wilk test and data were transformed wherever necessary. Serum 25(OH)D levels were classified as: deficiency (<20 ng/ml), insufficiency (20-30 ng/ml) and sufficiency (>30 ng/ml) as per Endocrine Society (ES) recommendations15. Baseline mean vitamin D levels were compared using one-way ANOVA. Pearson correlation was used to assess the relation between various demographic and environmental factors. Two-sided P<0.05 was considered significant.
Results
The mean age of male participants was 43.79±18.47 yr (minimum 10 - maximum 80 yr) with a mean BMI of 20.50±7.53 kg/m2 while the mean age of female participants was 35.47±14.92 yr (minimum 10 - maximum 80 yr) with mean BMI of 22.24±4.73 kg/m2. Table I shows age-wise baseline clinical and biochemical parameters of the tribal study participants. The mean BMI as well as mean BP were significantly high in the higher age group among both genders. Around 12.42, 15.33, 31.25, 35.54, 46.22, 58.03 per cent subjects among age groups 0-20, 21-30, 31-40, 41-50, 51-60 and >60 yr respectively were having BP above normal. Baseline mean serum phosphorus, calcium and alkaline phosphatase levels were comparable among males and females. The mean blood glucose showed an increasing trend with age in both males and females.
| Age groups in years | ||||||
|---|---|---|---|---|---|---|
| 0-20 | 21-30 | 31-40 | 41-50 | 51-60 | >60 | |
| Total, n (%) | 272 (15.7) | 330 (19.1) | 400 (23.1) | 296 (17.1) | 234 (13.5) | 200 (11.5) |
| Weight (kg) | ||||||
| Male | 48.18±11.58 | 58.28±7.84 | 59.37±9.86 | 61.89±9.59 | 60.29±10.87 | 60.23±10.80 |
| Female | 47.48±10.12 | 54.27±9.75 | 56.08±11.39 | 55.66±12.04 | 56.47±12.78 | 53.09±11.85 |
| Height (cm) | ||||||
| Male | 165.53±13.98 | 171.43±11.81 | 170.09±11.53 | 170.38±10.14 | 168.62±11.30 | 168.21±9.61 |
| Female | 155.76±9.41 | 156.76±8.14 | 156.85±7.53 | 154.26±8.01 | 154.11±8.60 | 151.32±7.58 |
| BMI (kg/m2) | ||||||
| Male | 17.49±3.13 | 20.08±4.46 | 20.63±3.65 | 21.44±3.62 | 21.19±3.84 | 21.38±3.92 |
| Female | 19.62±3.75 | 22.13±4.11 | 22.82±4.56 | 23.47±5.21 | 23.70±5.32 | 23.31±5.60 |
| Waist (cm) | ||||||
| Male | 73.21±13.34 | 74.47±12.23 | 75.85±12.31 | 78.59±15.07 | 76.80±14.43 | 80.31±16.67 |
| Female | 73.79±11.08 | 80.26±11.82 | 81.88±12.81 | 85.29±14.53 | 82.83±13.89 | 80.21±14.34 |
| SBP (mmHg) | ||||||
| Male | 117.66±11.90 | 120.80±12.97 | 123.05±17.86 | 128.41±18.09 | 133.02±21.93 | 137.38±22.41 |
| Female | 116.47±14.81 | 117.50±14.76 | 122.75±16.97 | 125.23±19.92 | 133.53±20.68 | 140.00±20.88 |
| DBP (mmHg) | ||||||
| Male | 75.80±9.74 | 76.89±10.23 | 80.91±11.35 | 83.95±13.01 | 85.70±13.84 | 87.99±14.50 |
| Female | 76.15±10.50 | 78.08±10.92 | 79.17±11.77 | 81.20±12.44 | 87.75±12.51 | 89.52±14.82 |
Data presented as mean±SD. SD, standard deviation; BMI, body mass index; DBP, diastolic blood pressure; SBP, systolic blood pressure
As per ES cut-offs, 66 per cent of the entire study population had VDD, 14.7 per cent had insufficient and 19.3 per cent had sufficient serum 25(OH)D levels (Fig. 1). As per the Scientific Advisory Committee for Nutrition and Institute of Medicine (IOM) guidelines16, the percentage prevalence of VDD was 44.4 per cent. The IOM guidelines define VDD as serum 25(OH)D levels < 20 ng/ml. The mean (±SD) serum 25(OH)D status of the cohort was 24.92±22.97 ng/ml and the values improved significantly with increasing age (P≤0.01) thereby decreasing the percentage prevalence of VDD (Fig. 2). Serum 25(OH)D levels did not differ significantly between two genders (P=0.972), but was lower in those with a higher level of education (P=0.03). There were no marked differences in serum 25(OH)D levels in relation to altitude, food habits, physical activity, sun exposure, smoking practice and BMI (Fig. 3). Serum 25(OH)D levels correlated positively with serum calcium (r=0.065, P=0.056), and serum phosphorus levels (r=0.07, P=0.02) but correlated negatively with serum alkaline phosphatase (r=−0.063, P=0.04), serum hs-CRP (r=−0.176, P=0.01) and serum insulin levels (r=−0.079, P= 0.01).
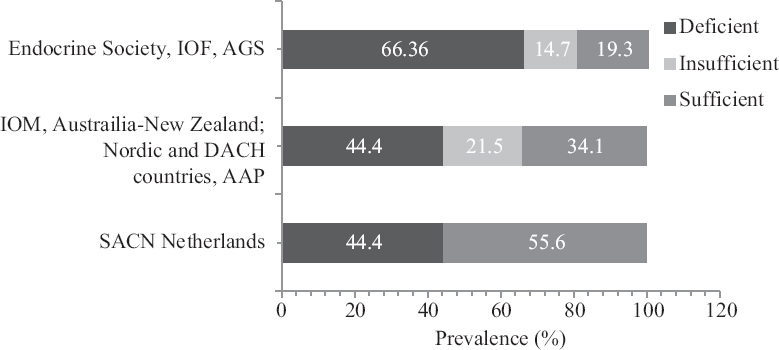
- Vitamin D status in the tribal population according to various guidelines. SACN, Scientific Advisory Committee for Nutrition; IOM, Institute of Medicine; AAP, American Academy of Pediatrics.
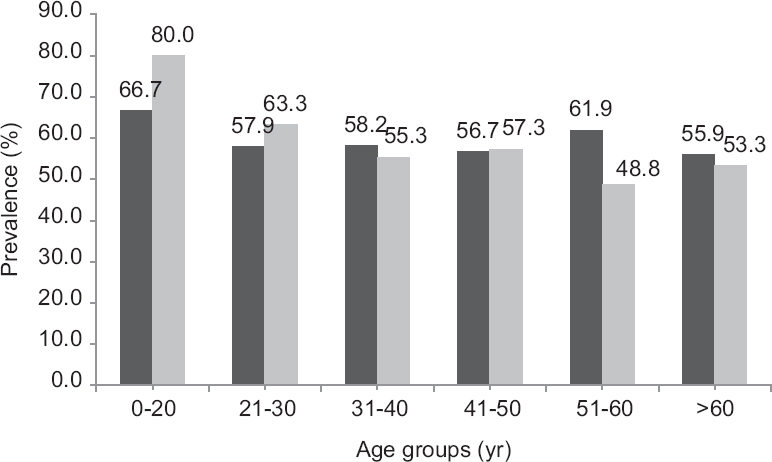
- Prevalence of VDD across age-groups.
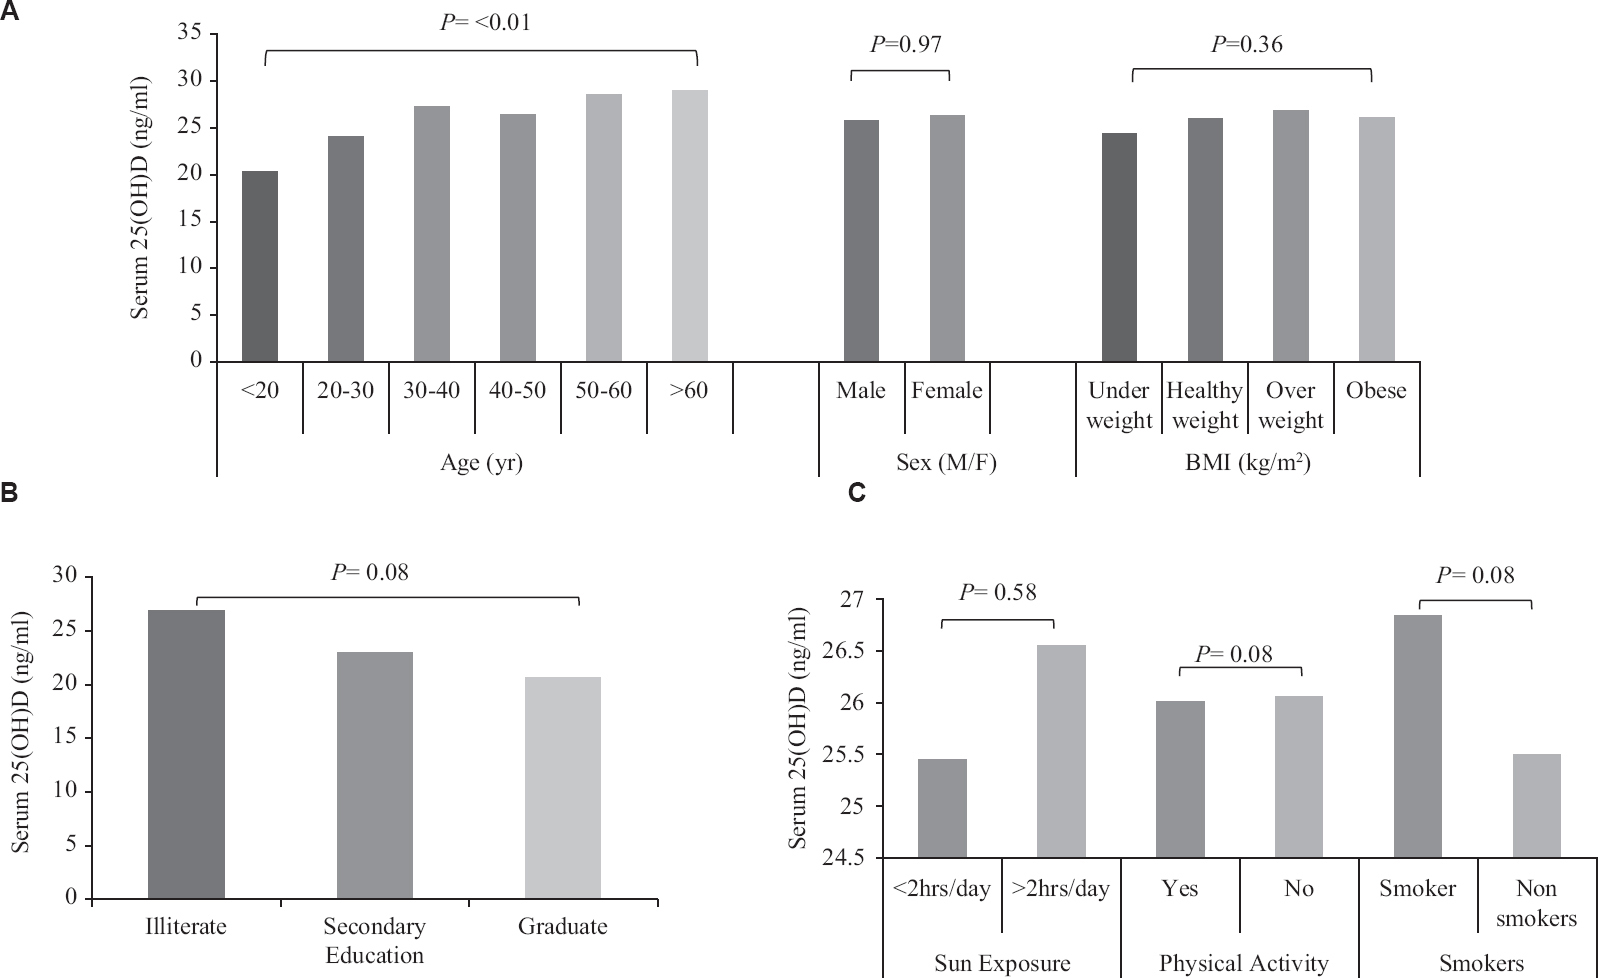
- Relation of various factors to vitamin D status in tribal population, (A) anthropometric parameters; (B) educational status; (C) lifestyle factors.
VDD was prevalent across all age groups with highest prevalence in younger subjects (<20 yr). Thereafter, the prevalence of VDD did not vary significantly as age increased. Further, the risk of VDD also did not vary significantly with increasing age (Table II). Around 75.4 per cent males and 68.4 per cent females with BMI of <18.5 kg/m2 had serum 25(OH)D concentration <20 ng/ml. Graduates were found at higher risk of VDD as compared to illiterates (P<0.05). Smoking increased the risk, while physical activity had no effect on VDD. Sun exposure (<2 h/day) marginally decreased the risk of VDD among both males and females (Table III).
| Age groups in years | ||||||
|---|---|---|---|---|---|---|
| 0-20 | 21-30 | 31-40 | 41-50 | 51-60 | >60 | |
| Total, n (%) | 272 (15.7) | 330 (19.1) | 400 (23.1) | 296 (17.1) | 234 (13.5) | 200 (11.5) |
| Phosphorus (mg/dl) | ||||||
| Male | 3.47±0.54 | 3.38±0.48 | 3.43±0.45 | 3.47±0.42 | 3.33±0.50 | 3.38±0.46 |
| Female | 3.59±0.45 | 3.38±0.51 | 3.43±0.44 | 3.75±0.41 | 3.44±0.49 | 3.25±0.46 |
| ALP (IU/L) | ||||||
| Male | 136.44±32.38 | 129.72±34.39 | 125.83±33.58 | 122.62±31.62 | 128.17±33.13 | 124.53±31.00 |
| Female | 134.42±33.69 | 131.46±33.42 | 128.92±33.80 | 130.89±34.38 | 131.79±35.05 | 130.95±33.89 |
| Serum 25(OH)D (ng/ml) | ||||||
| Male | 24.16±22.63 | 29.38±30.34 | 25.68±23.60 | 24.24±20.76 | 27.63±28.11 | 26.45±24.21 |
| Female | 17.81±14.47 | 21.30±16.71 | 25.64±22.45 | 24.74±20.54 | 25.01±22.12 | 28.77±25.18 |
| Blood sugar random (mg/dl) | ||||||
| Male | 99.71±18.53 | 103.80±16.83 | 107.53±38.90 | 108.49±22.32 | 111.63±26.31 | 114.32±37.79 |
| Female | 106.45±22.38 | 102.22±18.24 | 109.73±21.62 | 117.12±50.07 | 112.81±25.41 | 113.50±25.52 |
| Insulin (µIU/ml) | ||||||
| Male | 12.36±10.24 | 12.51±11.91 | 12.64±13.16 | 12.95±14.78 | 13.25±15.58 | 11.32±10.14 |
| Female | 14.51±11.21 | 15.84±14.96 | 14.63±12.79 | 17.26±15.37 | 15.76±14.44 | 14.23±13.12 |
| hs-CRP (mg/L) | ||||||
| Male | 3.64±3.75 | 2.85±3.04 | 3.43±3.52 | 3.38±3.72 | 3.81±1.04 | 3.48±2.38 |
| Female | 4.16±3.88 | 3.21±3.28 | 3.64±3.76 | 3.42±3.54 | 4.33±3.49 | 4.28±3.86 |
Data presented as mean±SD. ALP, alkaline phosphatase; hs-CRP, high-sensitivity C-reactive protein
| Study Parameters | Males | Females | ||
|---|---|---|---|---|
| OR (95% CI) | P | OR (95% CI) | P | |
| Age group (yr) | ||||
| 0-20 | Reference | Reference | ||
| 21-30 | 0.543 (0.206-1.433) | 0.068 | 0.238 (0.103-0.551) | 0.075 |
| 31-40 | 0.604 (0.242-1.508) | 0.613 | 0.131 (0.053-0.325) | 0.572 |
| 41-50 | 0.370 (0.144-0.949) | 0.794 | 0.215 (0.081-0.573) | 0.649 |
| 51-60 | 0.648 (0.246-1.701) | 0.119 | 0.147 (0.051-0.426) | 0.175 |
| 61+ | 0.405 (0.157-1.046) | 0.348 | 0.116 (0.034-0.393) | 0.060 |
| BMI | ||||
| Underweight | Reference | Reference | ||
| Healthy | 0.514 (0.305-0.866) | 0.034 | 1.273 (0.709-2.287) | 0.170 |
| Overweight | 0.572 (0.294-1.114) | 0.032 | 1.584 (0.807-3.107) | 0.918 |
| Education level | ||||
| Illiterate | Reference | Reference | ||
| Secondary | 1.068 (0.495-2.306) | 0.085 | 1.104 (0.404-3.019) | 0.061 |
| Graduate | 1.406 (0.340-5.819) | 0.110 | 5.342 (0.548-12.045) | 0.695 |
| Smoking | ||||
| Non-smoker | Reference | Reference | ||
| Smoker | 1.272 (0.616-2.630) | 0.384 | 1.512 (0.532-4.298) | 0.631 |
| Physical activity | ||||
| Yes | Reference | Reference | ||
| No | 1.032 (0.610-1.744) | 0.384 | 1.496 (0.875-2.558) | 0.198 |
| Dairy products | ||||
| Never | Reference | Reference | ||
| One times a month | 0.381 (0.089-1.627) | 0.075 | 1.616 (0.456-5.724) | 0.004 |
| Two-three times a month | 0.353 (0.087-1.432) | 0.572 | 1.884 (0.593-5.990) | 0.018 |
| One-two times a week | 0.667 (0.162-2.740) | 0.649 | 1.455 (0.452-4.689) | 0.021 |
| Three-four times a week | 0.357 (0.093-1.372) | 0.175 | 0.977 (0.320-2.977) | 0.027 |
| Five times a week | 0.387 (0.100-1.508) | 0.060 | 1.814 (0.598-5.507) | 0.070 |
| Sun exposure (hour/day) | ||||
| <2 | Reference | Reference | ||
| >2 | 0.936 (0.651-1.485) | 0.233 | 0.776 (0.512-1.175) | 0.623 |
OR, odds ratio; CI, confidence interval
Discussion
VDD has been reported in considerable proportions in Indian sub-continent by many researchers2. These studies attribute such findings to various ethnic and lifestyle factors such as increasingly indoor stay, socio-cultural and nutritional practices, and skin pigmentation. However, sparse information is available on the prevalence of VDD in tribal communities. The present study estimated the prevalence of VDD among apparently healthy tribal subjects (Gujjar and Bakarwal) of Kashmir valley and found that 66 per cent are deficient using ES criteria, which is better than that reported from general population9. Till date, only a few studies have been conducted to assess the prevalence of VDD and associated risk factors among tribal population in India. Noticeably studies conducted on rural population across India, reported a VDD prevalence of 73.91 per cent in healthy adults of Potheri Village of Kancheepuram district, Tamil Nadu17, 44 and 70 per cent in rural adult males and females of Tirupati, Andhra Pradesh18 and 70 per cent in rural population of Agota Village, Uttar Pradesh19. The prevalence of VDD was almost same as reported from the urban areas, with 62 per cent from Uttar Pradesh19 and 87 per cent from New Delhi20 being vitamin D deficient. Despite the study participants belonging to low socio-economic indices, being undernourished, living in poorly ventilated houses with little or no access to pure drinking water etc., their VD status was relatively better compared to non-tribal Kashmiri population9. Although we have not quantitated sun exposure, such differences could be attributed to the differential habit of engaging in outdoor physical activities such as farming, wood cutting and herding animals and could also be linked with higher consumption of dairy products.
Among the risk factors of VDD, obesity was unlikely a contributor as most of our study participants were lean. However, BMI is not the only predictor of adiposity and the association between adiposity and serum 25(OH)D levels has been found to be weaker if adiposity is defined by anthropometric measures only, rather than precisely measuring total body fat percentage21-23. Further, other factors such as diet, ethnicity and lifestyle could be potential contributors of VDD in our study population. The level of education had an inverse relation with serum 25(OH)D levels. Similar observations were made by an earlier study on Tunisian women demonstrating that higher education was associated with more VDD24. A plausible explanation for this observation could be that educated individuals are more likely to take up indoor jobs that decreases their exposure to sun and may also engage in some sun protection behaviour. Even though educated people are believed to be more health oriented, a study from India revealed lack of awareness in them regarding VDD25. Categorization of exposure to sun to < 2 or > 2 h did not show any significant difference in serum 25(OH)D levels in the present investigation.
Studies have confirmed smoking as an independent lifestyle factor which is associated with low 25(OH)D levels both in men and women. As per published reports it is suggested that chemicals in tobacco smoke may infact have a direct effect on vitamin D metabolism and function24. The depression of the (vitamin D-PTH) axis is reportedly seen among chronic smokers and eventually affects bone metabolism and contributes to increased risk of fractures and osteoporosis. Smoking has also been shown to alter expression of several genes, among which are some genes involved in the metabolic pathway of vitamin D24. We found lower vitamin D levels in smokers as compared to non-smokers (although not significant) which could be attributed to the low response rate for some of the questions pertaining to smoking. This could also be attributed to other confounding factors such as specific medications and dosage of supplements used, which, however, were not captured in our investigation.
Dietary factors such as milk, fish or non-vegetarian food consumption did not have significant association with VD status. Although detailed calculation of macronutrient and micronutrient intake including calcium intake could have provided better insights, the practice of consuming a significant amount of dairy products did not seem to have much relation with vitamin D status. This may be explained by the fact that most of the dietary sources are very low in vitamin D content, for example, unfortified milk, which remains the main source of VD among vegetarians, contains only 2 IU of VD/100 ml, which is further reduced by dilution and adulteration of milk. Besides, high phytate content in Indian diet leads to poor absorption of dietary calcium18. In addition, deep frying of foods, which is very popular in India, depletes vitamin D by thermal degradation2.
Although sun exposure is the primary determinant of vitamin D status in humans, we did not find an association between duration of sunlight exposure (<2 h) and serum 25(OH)D levels, which could be partly attributed to cultural practices of heavy clothing in these indigenous groups. Moreover, sun exposure was not recorded in detail as a continuous variable in this study. Kashmir valley is located in the high latitude Himalayan belt of northern India. The low solar zenith angle, during prolonged winters affects the amount of UV-B radiation that becomes available for cutaneous vitamin D synthesis in the body25,26. This could further increase the risk of VDD in our study population. Higher amount of physical activity was associated with higher 25(OH)D levels (Table III). While it is considered as a surrogate for sun exposure, physical activity may affect vitamin D concentrations through other mechanisms27.
In the present study, serum 25(OH)D positively correlated with serum calcium level and negatively with serum alkaline phosphatase. These findings are consistent with the fact that vitamin D facilitates absorption of calcium across the intestinal mucosa by both genomic and non-genomic mechanisms28. VDD state leads to secondary hyperparathyroidism resulting in defective bone mineralization while raised alkaline phosphatase levels cause rickets in children and osteomalacia in adults29.
Despite the large sample size and assessment of a considerable number of risk factors including anthropometric measurements (age, gender, BMI), lifestyle issues (education level, smoking status, income) as well as environmental factors such as exposure to sunlight in this study, there were a few limitations. These included lack of data on serum PTH and diet. Despite this limitation, our study provides important preliminary evidence on a socio-economically deprived population group. Furthermore, our results could be generalized for adult age groups except for younger children and adolescents where the response rate was low owing to a higher rate of refusals for sampling.
In conclusion, this is the first study to assess the vitamin D status of tribal population of Kashmir valley. As compared to the general population, a lower prevalence of VDD was observed across all age groups irrespective of gender and BMI. Given the deleterious consequences of VDD on both skeletal and extra-skeletal health, there is an urgent need for planning well-controlled interventional studies to pave the path for relevant prevention or supplementation programmes.
Financial support & sponsorship: The study was supported by research grant from the Department of Science and Technology, Ministry of Science and Technology, Government of India.
Conflicts of Interest: None.
References
- Vitamin D deficiency:A worldwide problem with health consequences. Am J Clin Nutr 2008:1080S-6S.
- [Google Scholar]
- Vitamin D deficiency in India:Prevalence, causalities and interventions. Nutrients. 2014;6:729-75.
- [Google Scholar]
- Vitamin D deficiency in rural girls and pregnant women despite abundant sunshine in northern India. Clin Endocrinol (Oxf). 2009;70:680-4.
- [Google Scholar]
- Prevalence of cardiovascular risk factors and the serum levels of 25-hydroxyvitamin D in the United States:Data from the Third National Health and Nutrition Examination Survey. Arch Intern Med. 2007;167:1159-65.
- [Google Scholar]
- Assessment of vitamin D in rheumatoid arthritis and its correlation with disease activity. J Nat Sci Biol Med. 2018;9:54-8.
- [Google Scholar]
- Vitamin D and multiple sclerosis:A comprehensive review. Neurol Ther. 2018;7:59-85.
- [Google Scholar]
- Old wine in new bottles:Vitamin D in the treatment and prevention of tuberculosis. Proc Nutr Soc. 2012;71:84-9.
- [Google Scholar]
- Vitamin D status in apparently healthy adults in Kashmir Valley of Indian subcontinent. Postgrad Med J. 2007;83:713-6.
- [Google Scholar]
- Impact of hypovitaminosis D on clinical, hormonal and insulin sensitivity parameters in normal body mass index polycystic ovary syndrome women. J Obstet Gynaecol. 2016;36:508-12.
- [Google Scholar]
- Assessment of vitamin d status in pregnant women, a prospective observational study from Kashmir Valley. Int J Dev Res. 2018;8:19559-62.
- [Google Scholar]
- Myths and realities of tribal education in Jammu and Kashmir:An exploratory study. Am Res Thoughts. 2016;2:3535-47.
- [Google Scholar]
- Prevalence of diabetes and prediabetes in tribal population of Kashmir:Lessons for the future. Diabetes Res Clin Pract. 2020;169:108457.
- [Google Scholar]
- 2020. Noncommunicable disease surveillance, monitoring and reporting. Available from: https://www.who.int/teams/noncommunicable-diseases/surveillance/systems-tools/steps/manuals
- Evaluation, treatment, and prevention of vitamin D deficiency:an Endocrine Society clinical practice guideline. J Clin Endocrinol Metab. 2011;96:1911-30.
- [Google Scholar]
- IOM committee members respond to Endocrine Society vitamin D guideline. J Clin Endocrinol Metab. 2012;97:1146-52.
- [Google Scholar]
- Serum 25-hydroxy vitamin D, calcium, phosphorus and alkaline phosphatase levels in healthy adults above the age of 20 living in Potheri village of Kancheepuram District, Tamilnadu. J Appl Pharm Sci. 2014;4:30-4.
- [Google Scholar]
- High prevalence of low dietary calcium, high phytate consumption, and vitamin D deficiency in healthy south Indians. Am J Clin Nutr. 2007;85:1062-7.
- [Google Scholar]
- Presence of 25(OH)D deficiency in a rural North Indian village despite abundant sunshine. J Assoc Physicians India. 2008;56:755-7.
- [Google Scholar]
- Prevalence of vitamin D deficiency and its relationship with thyroid autoimmunity in Asian Indians:A community-based survey. Br J Nutr. 2009;102:382-6.
- [Google Scholar]
- Vitamin D and obesity:Current perspectives and future directions. Proc Nutr Soc. 2015;74:115-24.
- [Google Scholar]
- Serum 25-hydroxyvitamin D3 and body composition in an elderly cohort from Germany:A cross-sectional study. Nutr Metab (Lond). 2012;9:42.
- [Google Scholar]
- Vitamin D deficiency is widespread in Tunisian pregnant women and inversely associated with the level of education. Clin Lab. 2016;62:801-6.
- [Google Scholar]
- The relationship between ultraviolet radiation exposure and vitamin D status. Nutrients. 2010;2:482-95.
- [Google Scholar]
- The effects of muscle-building exercise on vitamin D and mineral metabolism. J Bone Miner Res. 1988;3:369-73.
- [Google Scholar]
- Rickets-vitamin D deficiency and dependency. Indian J Endocrinol Metab. 2012;16:164-76.
- [Google Scholar]


