
Translate this page into:
Trend in seroprevalence of SARS-CoV-2 (IgG antibody) among tribal-dominated population: Findings from Jharkhand, India
For correspondence: Dr Sanghamitra Pati, ICMR-Regional Medical Research Centre, Bhubaneswar 751 023, Odisha, India e-mail: drsanghamitra12@gmail.com
-
Received: ,
This article was originally published by Wolters Kluwer - Medknow and was migrated to Scientific Scholar after the change of Publisher.
Abstract
Background & objectives:
Serosurvey of COVID-19 provides a better estimation of people who have developed antibodies against the infection. Undertaking such a serosurvey in certain districts of India which are densely populated with prominent tribes can provide valuable information regarding seropravelance of SARS-CoV-2 antibodies among such indigenous populations. In this context, two rounds of population-based, cross-sectional serosurveys for SARS-CoV-2 IgG antibody were carried out in Jharkhand, a tribal-dominated State of India, to compare the seroprevalence of SARS-CoV-2 infection and to determine the associated demographic risk factors.
Methods:
The surveys were carried out in June 2020 and February 2021 in ten districts of the State of Jharkhand. Blood samples were collected from the residents of the selected districts by random sampling and tested for anti-SARS-CoV-2 antibodies using an automated chemiluminescence immunoassay platform. A total of 4761 and 3855 eligible participants were included in round 1 and round 2, respectively.
Results:
The age- and gender-standardized seroprevalence for COVID-19 during round 1 was 0.54 per cent (0.36-0.80) that increased to 41.69 per cent (40.16-43.22) during round 2 with a gap of eight months in between. The seropositivity among male and female participants was 0.73 and 0.45 per cent, respectively, during the first round and 51.35 and 33.70 per cent, respectively, during the second round. During the first round, 17.37 per cent of the participants were tribal with seropositivity of 0.24 per cent (0.02-0.87), and during the second round, 21.14 per cent were tribal with seropositivity of 39.14 per cent (35.77-42.59). Compared to tribal group, non-tribal participants had an adjusted odds of 1.24 (95% confidence interval=1.04-1.48) for SARS-CoV-2 seropositivity.
Interpretation & conclusions:
COVID-19 seroprevalence was found to be low during the first round (0.54%) of the survey, possibly due to the travel restrictions during lockdown better adherence to social distancing and wearing of face masks among the people. Understanding the dynamics of SARS-CoV-2 transmission and the susceptibility to infection at the individual as well as community level will inform decision and help policy makers to design and implement effective public health strategies to mitigate the pandemic in this State.
Keywords
COVID-19
seronegative
seropositive
seroprevalence
tribal population

Till March 30, 2021, the COVID-19 pandemic had affected all the countries with 127 million confirmed cases and 2.78 million confirmed deaths1. India reported more than 12.14 million confirmed cases and more than 0.16 million deaths, of which Jharkhand reported more than 0.123 million cases and more than 1100 deaths2,3. India is the second most populous country, and with a rapid increase in the number of reported cases mainly from urban areas, and little information exists on the disease status in tribal dominated districts4. With a population of 37.5 million, Jharkhand State has carried out over 5.9 million COVID-19 testing with a case-positivity rate of 2.3 per cent as of April 5, 20215,6. The presence of SARS-CoV-2 specific antibodies in the collected blood samples is indicative of previous exposure or individuals vaccinated against COVID-197,8. However, both rounds of serosurveys were undertaken before COVID-19 vaccination in India gained momentum, which rules out the latter possibility. Repeated cross-sectional serosurveys in the same geographical location are useful to monitor the trends of seroprevalence over time and provide evidence for public health decision-making for a pandemic response plan. Infectious disease transmission or its reoccurrence depends upon the available susceptible individuals who can contract and transmit the infection. Therefore, the WHO had recommended conducting sequential serosurveys to monitor the trend of infections that could be used for planning an effective public health response9,10.
In India, Scheduled Tribes (STs) constitute around eight per cent of the population, and Jharkhand is unique amongst Indian states due to its large (23% ST population) and diverse (32 ST) tribal population11,12. The majority of these tribes inhabit hilly or forested areas, and depend on agriculture, forest resources and labour, which are primarily subsistence-based, without stratification or specialization13-15. Such indigenous communities are considered to be socially and economically marginalized, and their health is disproportionately at risk in times of public health emergencies14,15. According to earlier reports from India, the tribal districts are least affected by the pandemic and recovery rate is also very high compared to their counterparts16,17. The innate immunity and lifestyle of tribal people might have helped them to prevent the disease spread18-20. Therefore, to understand the trend in COVID-19 progression, age-specific prevalence of SARS-CoV-2 antibodies and status amongst different risk groups in the general population and healthcare workers, two rounds of COVID-19 serosurveys were carried out in the tribal dominated State of Jharkhand during June 2020 and February 2021, respectively.
Material & Methods
This study was carried out in ICMR-Regional Medical Research Center (RMRC), Bhubaneswar. The study was approved by the Institutional Human Ethics Committee and all the procedures were performed according to the ICMR-National Ethical guidelines21 for biomedical research involving human participants.
Study settings: Jharkhand is one of the eastern States of India which shares its border with the States of Bihar to the north, Uttar Pradesh to the north-west, Chhattisgarh to the west, Odisha to the south and West Bengal to the east. It is the 15th largest Indian State by area and the 14th largest by population. Population based, repeated COVID-19 serosurvey was carried out in 10 districts of Jharkhand during June 2020 and February 2021, respectively. The study population was randomly selected through a multistage random sampling technique to ensure state representation. The same 10 districts of the State were selected during both rounds of serosurveys. Individuals aged more than 18 yr were included in the survey after obtaining informed consent for data and blood sample collection. Bedridden patients, pregnant women, and individuals with recognizable cognitive impairment were excluded.
Sampling: For the first round, sample size was calculated with an assumption of one per cent SARS-CoV-2 seropositivity, 0.4 per cent absolute precision, 95 per cent confidence interval, design effect of 2-5 per cent non-response rate19. The estimated sample size was 4980 rounded off to 5000. Based on the findings from national serosurvey round 1 and 2, we were expecting a 10-fold increased seroprevalence in the second round of State serosurvey7,20. Thus, we assumed 5.4 per cent seroprevalence in the second round of State serosurvey in Jharkhand. Considering one per cent absolute precision (based on the findings from the first survey), 10 per cent non-response rate and a design effect of 2, the minimum sample size was estimated to be 4309.
Multistage random sampling method was used where districts were stratified based on their reported cases per million population as low, medium and high burden. Three districts each from low- and medium-burden strata and four districts from high-burden strata were selected in consultation with the state health department of Jharkhand (Supplementary Tables I and II). From each of the selected districts, six clusters (villages in rural areas or wards in urban areas) were identified following the probability proportionate to size method. From each cluster, 40 households were selected through systematic random sampling, and one individual from each selected household was included in the serosurvey adhering to the participant selection matrix (Supplementary Table III). In addition, from each study cluster, 45 participants from high-risk groups (vulnerable to contract the infection and develop complications) were recruited (Supplementary Table IV). Hence, from each study district, 240 participants from the general group and 260 from the high-risk group (a total 500) were included.
| Category | District | Population in million | Positive | Cases per million |
|---|---|---|---|---|
| Low | Bokaro | 2.359 | 26 | 11 |
| Low | Chatra | 1.192 | 1 | 1 |
| Low | Deogarh | 1.707 | 5 | 3 |
| Low | Pakur | 1.029 | 5 | 5 |
| Low | Dumka | 1.511 | 4 | 3 |
| Low | Palamu | 2.215 | 29 | 13 |
| Low | Sahebganj | 1.316 | 3 | 2 |
| Low | Giridih | 2.797 | 32 | 11 |
| Low | Godda | 1.500 | 1 | 1 |
| Medium | Dhanbad | 3.069 | 95 | 31 |
| Medium | Ranchi | 3.331 | 146 | 44 |
| Medium | Jamtara | 0.904 | 19 | 21 |
| Medium | Khunti | 0.607 | 10 | 16 |
| Medium | Gumla | 1.173 | 41 | 35 |
| Medium | Latehar | 0.830 | 26 | 31 |
| Medium | Lohardaga | 0.528 | 18 | 34 |
| Medium | Saraikela | 1.217 | 22 | 18 |
| Medium | West Singhbhum | 1.718 | 23 | 13 |
| High | Ramgarh | 1.086 | 83 | 76 |
| High | Koderma | 0.820 | 62 | 76 |
| High | Hazaribagh | 1.984 | 120 | 60 |
| High | East Singhbhum | 2.621 | 180 | 69 |
| High | Simdega | 0.686 | 111 | 162 |
| High | Garhwa | 1.513 | 81 | 54 |
| Total | 3.77 | 1143 | 30 |
| Low | Medium | High |
|---|---|---|
| Bokaro | Dhanbad | Hazaribagh |
| Dumka | Ranchi | Garhwa |
| Palamu | Khunti | East Singhbhum |
| West Singhbhum |
| District | Block/sub-district | Cluster |
|---|---|---|
| Dhandbad | Dhanbad city | Ward number 9, 10, 21, 29, 38, 46 |
| Hajaribagh | Hajaribagh city | Ward number 4, 9, 15, 20, 26, 30 |
| Ranchi | Ranchi city | Ward number 4, 13, 22, 23, 42, 52 |
| Garhwa | Garhwa | Pharadiya, Ursugi, Birbandha |
| Sagma | Sagma, Birbal, Kathar Kalan | |
| Khunti | Khunti | Barudih, Kalamati, Jiarapa |
| Rania | Tomba, Balankel, Khatanga | |
| Bokaro | Chas city | Ward number 4, 9, 13, 18, 24, 28 |
| Dumka | Jarmundi | Patsar, Banwara, Raja Semaria |
| Ramgarh | Danro, Amarpur, Dhawa | |
| Palamu | Chainpur | Baranw, Rabda, Neura |
| Pipara | Pipara, Saraiya, Madhubana | |
| East Singhbhum | Golmuri | Deogarh, Jojobera, Bara Govindpur |
| Dumaria | Bara Kanjiya, Bhagabandi, Dumaria | |
| West Singhbhum | Chakradharpur | Hathiya, Asantaliya, Gulkera |
| Anandapur | Anandapur, Binju, Jharbera |
| HH Sl. No. | Select the youngest one from each age group, if unavailable, move to the next (right hand side) group | HH Sl. No. | Select the youngest one from each age group, if unavailable, move to the next (right hand side) group | ||||
|---|---|---|---|---|---|---|---|
| <40 yr | 40-60 yr | >60 yr | <40 yr | 40-60 yr | >60 yr | ||
| 1. | X | 26. | X | ||||
| 2. | X | 27. | X | ||||
| 3. | X | 28. | X | ||||
| 4. | X | 29. | X | ||||
| 5. | X | 30. | X | ||||
| 6. | X | 31. | X | ||||
| 7. | X | 32. | X | ||||
| 8. | X | 33. | X | ||||
| 9. | X | 34. | X | ||||
| 10. | X | 35. | X | ||||
| 11. | X | 36. | X | ||||
| 12. | X | 37. | X | ||||
| 13. | X | 38. | X | ||||
| 14. | X | 39. | X | ||||
| 15. | X | 40. | X | ||||
| 16. | X | 41. | X | ||||
| 17. | X | 42. | X | ||||
| 18. | X | 43. | X | ||||
| 19. | X | 44. | X | ||||
| 20. | X | 45. | X | ||||
| 21. | X | 46. | X | ||||
| 22. | X | 47. | X | ||||
| 23. | X | 48. | X | ||||
| 24. | X | 49. | X | ||||
| 25. | X | 50. | X | ||||
| High-risk groups |
|---|
| Immunocompromised patients: PLHIV, patients on immunosuppressive treatment, TB, SARI, COPD, patients on dialysis to be considered for testing |
| Individuals in containment zones: In identified containment zones and buffer zones where large number/cluster of cases have been identified as demarcated geographical areas with residential, commercial structures |
| Healthcare workers: Specifically, all doctors including specialists, nursing staff, support staff, sanitary and other staff including the staff at registration, pharmacists, client facing desk clerks etc. Those workers in healthcare settings who either faces patients (whether known COVID-19+ ve or not), involved in their care or are in environment of potentially shared spaces or handling fomites |
| Security personnel: All security personnel facing the visitors, conducting their security screening, physical checking and thermal screening. This includes CISF personnel involved in security especially of offices; Police and paramilitary personnel civil defence and volunteers: police personnel and volunteers involved in duties facing large number of individuals or those coming in contact with potentially infected individuals, fomites or settings/places |
| Press corps: Press reporters covering field, interviews, press briefings, etc. and support staff |
| Rural, tribal population (after reverse migration): Migrant workers who have travelled back from urban and peri-urban areas to rural, tribal, hard to reach areas in the country as well as natives after coming in contact with returned migrants |
| Industrial workers or labour force: Industry workers, daily wagers, migrant workers, temporary travel-related workers, hospitality related works, service sector who are in large number or groups and has potential to spread transmission rapidly in workplace settings |
| Staff in municipal bodies: Municipal staff working in areas such as sanitation, water supply and electricity where interactions with citizens is expected |
| Drivers: Drivers of hospital ambulances, hearse, buses, auto, taxies, etc., who have been on work font faced large number of individual previously or going to face in future. Bus conductors, cleaners and helping staff also should be included |
| Banks, post, couriers, telecom offices: public or private banks, small or large branches of banks and post, telecom offices as well as couriers |
| Shops: Vendors and/or owners as well as staff working in shops for essential goods, groceries, vegetables, milk, bread, chemists working at pharmacies, eateries and take away restaurants, etc.; Farmers, vendors visiting large markets: Farmers, sellers, brokers, purchasing vendors, distributors and other persons including drivers and labour by virtue of visiting crowded places like main markets where large exchange of materials happen between farmers and vendors during purchase and sell of vegetables etc. |
| Air travel-related staff: All ground staff, security staff, janitors, sanitation staff, flight captains and crew for domestic and international as well as cargo may be considered |
| Congregate settings: People staying or working in slums with very high-population density with poorly ventilated building, structures. Persons staying in institutional settings such as old age homes, orphanage, asylums, shelters for homeless and hostels may also be considered |
| Prisons: All prisoners with or without symptoms whenever there is a batch transfer or reported symptomatic |
PLHIV, people with HIV; TB, tuberculosis; SARI, severe acute respiratory infection; COPD, chronic obstructive pulmonary disease
| Sociodemographic characteristics | Round 1 | Round 2 | ||
|---|---|---|---|---|
| UOR (95% CI) | AOR (95% CI) | UOR (95% CI) | AOR (95% CI) | |
| Age | ||||
| 18-44 | 1.35 (0.31-5.86) | 1.64 (0.35-7.53) | 1.43 (1.16-1.78) | 1.31 (1.02-1.67) |
| 45-59 | 1.99 (0.43-9.11) | 2.24 (0.47-10.67) | 1.53 (1.20-1.95) | 1.37 (1.05-1.79) |
| 60 and above | Reference | Reference | Reference | Reference |
| Gender | ||||
| Male | 1.61 (0.71-3.61) | 15.61 (14.93-16.33) | 2.07 (1.81-2.37) | 1.61 (1.35-1.92) |
| Female | Reference | Reference | Reference | Reference |
| Place of resident | ||||
| Urban | 2.20 (1.06-4.59) | 1.57 (0.70-3.55) | 1.78 (1.57-2.03) | 1.56 (1.35-1.81) |
| Rural | Reference | Reference | Reference | Reference |
| Ethnicity | ||||
| Tribal | Reference | Reference | Reference | Reference |
| Non-tribal | 2.95 (0.70-12.43) | 3.01 (0.69-12.97) | 1.29 (1.11-1.52) | 1.24 (1.04-1.48) |
| Education | ||||
| No formal education | Reference | Reference | Reference | Reference |
| Primary school | 1.79 (0.50-6.38) | 1.87 (0.50-6.98) | 1.44 (1.19-1.74) | 1.28 (1.04-1.58) |
| Secondary school | 3.61 (1.19-10.90) | 4.08 (1.20-13.58) | 1.67 (1.39-1.99) | 1.32 (1.07-1.63) |
| Universities | 1.48 (0.39-5.55) | 1.50 (0.34-6.56) | 1.34 (1.12-1.59) | 1.11 (0.88-1.38) |
| Occupation | ||||
| Agriculture | Reference | Reference | Reference | Reference |
| Government job | 1.69 (0.32-8.73) | 2.24 (0.13-16.25) | 1.97 (1.53-2.54) | 0.81 (0.59-1.12) |
| Private job | 3.23 (0.62-16.72) | 2.37 (0.37-15.25) | 1.72 (1.27-2.33) | 0.94 (0.67-1.32) |
| Business | 1.18 (0.10-13.15) | 0.56 (0.04-7.10) | 2.62 (1.78-3.84) | 1.74 (1.16-2.61) |
| Others | 3.03 (0.61-15.09) | 2.87 (0.49-16.77) | 4.72 (3.61-6.18) | 2.16 (1.56-2.92) |
| Student | 4.84 (0.64-14.68) | 3.71 (0.42-12.45) | 1.52 (1.09-2.12) | 1.33 (0.92-1.91) |
| Unemployed | 2.69 (0.24-19.88) | 2.38 (0.19-19.67) | 2.43 (1.67-3.54) | 1.97 (1.60-2.93) |
| Type of group | ||||
| General population | Reference | Reference | Reference | Reference |
| High-risk group | 0.47 (0.22-1.01) | 0.36 (0.13-0.98) | 2.28 (1.99-2.60) | 2.44 (1.99-2.97) |
| Family size | ||||
| 1-2 | Reference | Reference | Reference | Reference |
| 3-5 | 0.61 (0.23-1.58) | 0.60 (0.22-1.60) | 1.36 (1.02-1.82) | 1.55 (1.12-2.13) |
| 6 or more | 0.50 (0.17-1.41) | 0.53 (0.18-1.56) | 1.08 (0.80-1.44) | 1.40 (1.01-1.93) |
Data collection: Data on the sociodemographic variables, history of exposure to a confirmed (and/or suspected) case of COVID-19, symptom profile over the last 30 days, clinical history and status of comorbidities, history of travel and testing were collected by trained field staff before blood sample collection. An open kit-based electronic data capture tool was employed for this purpose.
Sample collection and transport: Four millilitres of blood samples was collected through venepuncture and serum was separated. The collected samples were transported to the laboratory at ICMR-RMRC, Bhubaneswar, by maintaining proper cold chain. Samples were subjected to qualitative antibody detection (including IgG) against the nucleocapsid protein of SARS-CoV-2 in electro-chemiluminescence immunoassay-based platform (Roche Cobas e41-Roche Diagnostics International Ltd, Rotkreuz, Switzerland) using the Elecsys® anti-SARS-CoV-2 kit (Roche Diagnostics GmbH, Mannhein, Germany) following manufacturer’s instruction. The value generated after testing was expressed in cut-off index (CoI), and a value of <1.0 was considered nonreactive and CoI ≥1.0 as reactive.
Statistical analyses: The prevalence of COVID-19 antibodies was estimated with a 95 per cent confidence interval (CI), and its distribution across different characteristics was assessed across both rounds. Pooled seroprevalence was calculated for each district and different strata. The results from first and second round were compared and analyzed. Statistical analyses were carried out using STATA 16.0 (Stata Corp. LLC, TX, USA) to estimate frequencies and percentages of the variables. Bivariate and multivariate logistic regression was carried out to calculate unadjusted odds ratio and adjusted odds ratio (AOR) respectively to estimate the odds of having SARS-CoV-2 antibody with regard to age, gender, ethnicity, residence, occupation, education, etc. at a significance level of P=0.05. The infection-to-case ratio (ICR) was calculated using the formula, ICR=Estimated number of infections (seroprevalence×population of the area)/reported cases (as reported in government database)22. Moreover, infection fatality ratio (IFR) was calculated as: IFR=Number of deaths from the disease×10,000/number of infected individuals. Geographical information system (GIS) maps analysis was carried out using an open-source software QGIS (ver. 3.10; https://www.qgis.org/en/site/).
Results
This study was carried out in 10 districts of Jharkhand in two rounds in which a total of 4761 participants during the first round and 3855 participants during the second round were enrolled. During the first round, out of 5157 participants approached, 4779 participated, and during round 2, out of 4290 participants approached, 3878 participated in the sero-survey. The non-response rate during the first round and second round was 7.3 and 9.6 per cent, respectively. After analysis of blood samples and matching the data collected, 4761 participants from the first round and 3855 participants from the second round were included for final analysis (
The mean age±Standard deviation of the study participants during round 1 and round 2 was 39.42±13.02 yr and 38.53±14.06 yr, respectively. The age- and gender-standardized seroprevalence for COVID-19 during round 1 was 0.54 per cent (95% CI: 0.36-0.80) which increased to 41.69 per cent (95% CI: 40.16-43.22) during round 2. Strata-wise (based on case burden) distribution of seroprevalence for both rounds are provided in Table I. The overall seroprevalence after adjusting for test performance for round 1 was 0.35 per cent (95% CI: 0.2-0.5) and round 2 was 41.58 per cent (95% CI: 40.2-43.0).
| Stratum | Round 1 | Round 2 | ||||||
|---|---|---|---|---|---|---|---|---|
| Population (n) | Antibody positives, % (95% CI) | Prevalence*, % (95% CI) | χ2 (P) | Population (n) | Antibody positives, % (95% CI) | Prevalence*, % (95% CI) | χ2 (P) | |
| Low | 1387 | 0.79 (0.39-1.41) | 0.67 (0.30-1.27) | 6.22 (0.04) | 1213 | 44.93 (42.10-47.78) | 42.90 (40.13-45.71) | 58.32 (<0.01) |
| Medium | 1947 | 0.82 (0.47-1.33) | 0.75 (0.42-1.24) | 1396 | 37.11 (34.56-39.70) | 34.79 (32.42-37.23) | ||
| High | 1427 | 0.21 (0.04-0.61) | 0.14 (0.02-0.51) | 1246 | 51.36 (48.55-54.17) | 48.93 (46.14-51.73) | ||
| Total | 4761 | 0.63 (0.42-0.89) | 0.54 (0.36-0.80) | 3855 | 44.18 (42.60-45.76) | 41.69 (40.16-43.22) | ||
*Standardized for age and gender. Stratum: Low - <15 cases per million, Medium - <15-50 cases per million, and High - >50 cases per million. CI, confidence interval
During the first round, the seropositivity was highest (0.84%) among the middle age group (45-59 yr) and lowest (0.42%) among age group 60 yr and above. In the second round, 46.35 per cent were seropositive in the middle age group and 36 per cent in the age group 60 yr and above. The seropositivity among male and female participants were 0.73 and 0.45 per cent, respectively in the first round and 51.35 and 33.70 per cent in the second round. During the first round, 17.37 per cent of the participants were tribal with seropositivity of 0.24 per cent (95% CI: 0.02-0.87), while during the second round, 21.14 per cent of the participants were tribal when their seropositivity increased to 39.14 per cent (95% CI: 35.77-42.59). The detailed sociodemographic characteristics of the study participants and distribution of seroprevalence are provided in Table II.
| Demographic characteristics | Round 1 | Round 2 | ||
|---|---|---|---|---|
| Population (n=4761), n (%) | Prevalence (95% CI) | Population (n=3855), n (%) | Prevalence (95% CI) | |
| Age (yr, mean± SD) | 39.42±13.06 | 40.17±11.68 | 38.53±14.06 | 38.15±13.33 |
| Adult (19-44) | 65.36 | 0.57 (0.34-0.91) | 66.56 | 44.73 (42.80-46.69) |
| Middle aged (45-59) | 24.81 | 0.84 (0.40-1.55) | 22.78 | 46.35 (43.01-49.71) |
| Aged (60 and above) | 9.83 | 0.42 (0.05-1.53) | 10.66 | 36.00 (31.37-40.86) |
| Gender | ||||
| Male | 63.20 | 0.73 (0.45-1.10) | 59.35 | 51.35 (49.29-53.42) |
| Female | 36.80 | 0.45 (0.19-0.89) | 40.65 | 33.70 (31.36-36.10) |
| Social class | ||||
| General | 24.89 | 1.26 (0.71-2.07) | 23.42 | 50.83 (47.51-54.13) |
| OBC | 42.72 | 0.54 (0.27-0.96) | 42.10 | 43.80 (41.38-46.26) |
| SC | 15.02 | 0.27 (0.03-1.01) | 13.33 | 41.63 (37.33-46.03) |
| ST | 17.37 | 0.24 (0.02-0.87) | 21.14 | 39.14 (35.77-42.59) |
| Education | ||||
| No formal education | 26.84 | 0.31 (0.08-0.79) | 24.95 | 37.11 (34.05-40.25) |
| Primary school | 22.47 | 0.56 (0.20-1.21) | 21.35 | 46.05 (42.60-49.53) |
| Secondary school | 28.10 | 1.12 (0.62-1.84) | 25.32 | 49.59 (46.41-52.78) |
| Universities | 22.58 | 0.46 (0.15-1.08) | 28.38 | 44.15 (41.18-47.15) |
| Occupation | ||||
| Agriculture | 15.42 | 0.27 (0.03-0.98) | 9.96 | 28.12 (23.68-32.91) |
| Government job | 22.85 | 0.45 (0.15-1.07) | 26.87 | 43.53 (40.49-46.61) |
| Private job | 11.99 | 0.87 (0.28-2.03) | 10.04 | 40.31 (35.38-45.38) |
| Business | 6.49 | 0.32 (0.00-1.79) | 4.10 | 50.63 (42.57-58.67) |
| Housewife | 21.84 | 0.76 (0.33-1.51) | 18.81 | 34.90 (31.42-38.49) |
| Student | 3.21 | 1.30 (0.15-4.64) | 6.95 | 37.31 (31.50-43.40) |
| Unemployed | 2.88 | 0.72 (0.01-4.00) | 4.36 | 48.81 (41.03-56.63) |
| Others | 15.31 | 0.82 (0.30-1.78) | 18.91 | 64.88 (61.29-68.35) |
| Type of group | ||||
| General | 48.79 | 0.86 (0.52-1.32) | 59.90 | 36.08 (34.11-38.07) |
| High-risk group | 51.21 | 0.41 (0.19-0.75) | 40.10 | 56.27 (53.76-58.76) |
| Family size | ||||
| 1-2 | 12.43 | 1.01 (0.37-2.19) | 5.55 | 39.25 (32.67-46.14) |
| 3-5 | 50.64 | 0.62 (0.34-1.02) | 54.40 | 46.92 (44.77-49.09) |
| 6 or more | 36.93 | 0.51 (0.23-0.97) | 40.05 | 41.13 (38.66-43.63) |
| Place of resident | ||||
| Urban | 40.60 | 0.93 (0.55-1.46) | 42.36 | 52.42 (49.96-54.86) |
| Rural | 59.40 | 0.42 (0.21-0.74) | 57.64 | 38.12 (36.09-40.17) |
| COVID-19 tested | ||||
| Yes | 6.68 | 1.57 (0.51-3.63) | 17.46 | 42.94 (39.17-46.78) |
| No | 93.32 | 0.56 (0.36-0.83) | 82.54 | 44.44 (42.70-46.18) |
| Symptom present | ||||
| Yes | 3.72 | 0.56 (0.01-3.10) | 4.67 | 50.00 (42.47-57.53) |
| No | 96.28 | 0.63 (0.42-0.91) | 95.33 | 43.89 (42.28-45.51) |
| Total | (4761) 100 | 0.63 (0.42-0.89) | (3855) 100 | 44.18 (42.60-45.76) |
SD, standard deviation
Table III compares the sociodemographic characteristics and COVID-19 seropositivity between tribal and non-tribal participants in both rounds. During the first round, compared to participants from general group, participants from high-risk group had lower COVID-19 seroprevalence with an AOR of 0.36 (95% CI: 0.13-0.98) which was very different in the second round with an AOR of 2.44 (95% CI: 1.99-2.97) amongst high-risk group (Supplementary Table V). In the second round, the AOR for antibody positivity in the age group of 18-44 yr was 1.31 (95% CI: 1.02-1.67) and in the age group of 45-59 yr it was 1.37 (95% CI: 1.05-1.79) compared to that in individuals aged 60 yr and above. Males were more likely to be seropositive with an AOR of 1.61 (95% CI: 1.35-1.92) compared to females. Compared to the tribal group, non-tribal participants had an AOR for SARS-CoV-2 antibody positivity was 1.24 (95% CI: 1.04-1.48). Urban people had higher seropositivity compared to the rural ones with AOR of 1.56 (95% CI: 1.35-1.81).
| Characteristics | Round 1 | |||||
|---|---|---|---|---|---|---|
| Tribal | Non-tribal | |||||
| Population, n (%) | Prevalence* (%) | χ2 (P) | Population, n (%) | Prevalence* (%) | χ2 (P) | |
| Age group (yr) | ||||||
| Mean age±SD | 38.61±12.99 | 39.60±13.07 | ||||
| Adult (19-44) | 68.68 | 0.33 (0.04-1.20) | 0.87 (0.64) | 64.66 | 0.51 (0.27-0.87) | 2.61 (0.27) |
| Middle aged (45-59) | 20.44 | 0 | 25.72 | 1.01 (0.46-1.91) | ||
| Aged (60 and above) | 10.88 | 0 | 9.60 | 0.64 (0.13-1.86) | ||
| Gender | ||||||
| Male | 57.80 | 0.26 (0.00-1.42) | 0.01 (0.89) | 64.33 | 0.78 (0.44-1.26) | 1.34 (0.24) |
| Female | 42.20 | 0.21 (0.00-1.17) | 35.66 | 0.48 (0.22-0.92) | ||
| Education | ||||||
| No formal | 21.52 | 0 | 1.26 (0.73) | 27.96 | 0.35 (0.09-0.88) | 7.37 (0.06) |
| Primary | 26.60 | 0.46 (0.01-2.56) | 21.6 | 0.49 (0.13-1.26) | ||
| Secondary | 37.61 | 0.29 (0.00-1.61) | 26.1 | 1.17 (0.61-2.05) | ||
| Universities | 14.27 | 0 | 24.32 | 0.43 (0.12-1.10) | ||
| Occupation | ||||||
| Agriculture | 26.72 | 0.45 (0.01-2.49) | 2.06 (0.95) | 13.04 | 0.22 (0.00-1.23) | 3.88 (0.79) |
| Government job | 21.52 | 0 | 23.13 | 0.48 (0.13-1.23) | ||
| Private job | 5.44 | 0 | 13.37 | 0.87 (0.24-2.23) | ||
| Business | 1.93 | 0 | 7.45 | 0.40 (0.01-2.23) | ||
| Housewife | 19.35 | 0.48 (0.01-2.66) | 22.36 | 0.80 (0.36-1.51) | ||
| Student | 18.38 | 0 | 14.66 | 1.38 (0.17-4.89) | ||
| Unemployed | 4.11 | 0 | 3.02 | 0.85 (0.02-4.67) | ||
| Others | 2.54 | 0 | 2.95 | 0.76 (0.21-1.93) | ||
| Type of group | ||||||
| General | 59.13 | 0.37 (0.04-1.34) | 1.21 (0.27) | 46.62 | 0.81 (0.47-1.33) | 2.69 (0.10) |
| High risk | 40.87 | 0 | 53.38 | 0.41 (0.18-0.80) | ||
| Family size | ||||||
| 1-2 | 13.42 | 0.87 (0.02-4.79) | 2.80 (0.24) | 12.22 | 0.84 (0.23-2.14) | 0.50 (0.77) |
| 3-5 | 49.33 | 0.23 (0.00-1.30) | 50.91 | 0.60 (0.31-1.06) | ||
| 6 or more | 37.24 | 0 | 36.86 | 0.54 (0.24-1.08) | ||
| Place of residence | ||||||
| Urban | 24.91 | 0.46 (0.01-2.54) | 0.65 (0.41) | 43.9 | 0.87 (0.49-1.44) | 3.42 (0.06) |
| Rural | 75.09 | 0.15 (0.00-0.86) | 56.10 | 0.41 (0.19-0.78) | ||
| Symptoms present | ||||||
| Yes | 3.51 | 0 | 0.65 (0.41) | 96.24 | 0.66 (0.02-3.63) | 3.42 (0.06) |
| No | 96.49 | 0.24 (0.03-0.87) | 3.76 | 0.61 (0.39-0.92) | ||
| Stratum | ||||||
| Low | 17.90 | 0 | 1.327 (0.515) | 31.49 | 0.75 (0.34-1.41) | 6.09 (0.04) |
| Medium | 58.77 | 0.39 (0.05-1.39) | 37.14 | 0.88% (0.47-1.49) | ||
| High | 23.34 | 0 | 31.37 | 0.16 (0.02-0.59) | ||
| COVID-19 tested | ||||||
| Yes | 3.99 | 0 | 0.08 (0.77) | 7.24 | 1.78 (0.58-4.10) | 6.18 (0.01) |
| No | 96.01 | 0.24 (0.03-0.87) | 92.75 | 0.55 (0.34-0.85) | ||
| COVID-19 positive | ||||||
| Positive | - | - | - | - | - | - |
| Negative | - | - | - | - | - | - |
| Total (n) | 827 | 3934 | ||||
| Round 2 | ||||||
| Age group (yr) | ||||||
| Mean age±SD | 36.57±12.991 | 39.06±14.293 | ||||
| Adult (19-44) | 71.66 | 36.47 (32.84-40.21) | 0.45 (0.79) | 65.20 | 43.75 (41.61-45.90) | 16.32 (<0.01) |
| Middle aged (45-59) | 21.23 | 34.21 (26.72-42.33) | 23.19 | 47.32 (43.31-51.35) | ||
| Aged (60 and above) | 7.17 | 38.57 (27.17-50.97) | 11.61 | 35.02 (30.53-39.72) | ||
| Gender | ||||||
| Male | 51.53 | 50.57 (45.20-55.93) | 49.89 (<0.01) | 61.45 | 50.98 (48.48-53.48) | 76.73 (<0.01) |
| Female | 48.47 | 27.35 (23.67-31.28) | 38.55 | 35.53 (33.16-37.95) | ||
| Education | ||||||
| No formal | 28.34 | 29.67 (24.04-35.81) | 23.62 (<0.01) | 24.05 | 37.33 (34.02-40.73) | 16.40 (<0.01) |
| Primary | 26.50 | 38.31 (32.23-44.67) | 19.97 | 44.15 (40.26-48.09) | ||
| Secondary | 21.84 | 49.73 (42.40-57.08) | 26.25 | 45.83 (42.39-49.29) | ||
| Universities | 23.31 | 29.95 (23.94-36.52) | 29.74 | 45.75 (42.38-49.15) | ||
| Occupation | ||||||
| Agriculture | 15.46 | 22.39 (15.64-30.39) | 115.63 (<0.01) | 8.49 | 25.87 (20.65-31.65) | 112.17 (<0.01) |
| Government job | 33.13 | 35.07 (29.56-40.88) | 25.20 | 44.98 (41.25-48.76) | ||
| Private job | 10.06 | 29.54 (20.29-40.22) | 10.03 | 42.55 (36.71-48.55) | ||
| Business | 0.86 | 71.43 (29.04-96.33) | 4.97 | 49.23 (40.36-58.14) | ||
| Housewife | 13.25 | 25.67 (18.85-33.50) | 20.30 | 36.39 (33.06-39.81) | ||
| Student | 6.13 | 20.27 (11.81-31.22) | 7.17 | 39.92 (34.01-46.06) | ||
| Unemployed | 3.56 | 48.57 (31.38-66.01) | 4.57 | 42.86 (34.92-51.07) | ||
| Others | 17.55 | 74.42 (65.99-81.69) | 19.28 | 59.64 (55.42-63.75) | ||
| Type of group | ||||||
| General | 49.08 | 25.52 (21.68-29.66) | 52.18 (<0.01) | 62.80 | 36.92 (34.88-39.00) | 109.24 (<0.01) |
| High risk | 50.92 | 48.69 (43.82-53.58) | 37.20 | 56.69 (53.57-59.77) | ||
| Family size | ||||||
| 1-2 | 4.78 | 15.55 (6.50-29.45) | 29.14 (<0.01) | 5.76 | 41.99 (34.71-49.54) | 2.97 (0.22) |
| 3-5 | 55.70 | 43.94 (39.48-48.48) | 54.05 | 44.68 (42.27-47.10) | ||
| 6 or more | 39.51 | 29.00 (24.42-33.92) | 40.20 | 41.58 (38.89-44.32) | ||
| Place of resident | ||||||
| Urban | 30.18 | 50.20 (43.77-56.63) | 28.16 (<0.01) | 45.62 | 50.53 (47.89-53.16) | 55.99 (<0.01) |
| Rural | 69.81 | 31.10 (27.57-34.79) | 54.37 | 37.26 (34.98-39.59) | ||
| Symptoms present | ||||||
| Yes | 4.17 | 44.44 (27.93-61.90) | 1.05 (0.30) | 4.80 | 48.23 (39.74-56.79) | 1.49 (0.22) |
| No | 95.83 | 36.02 (32.82-39.33) | 95.20 | 43.01 (41.24-44.80) | ||
| Stratum | ||||||
| Low | 20.74 | 46.74 (39.04-54.56) | 46.19 (<0.01) | 34.34 | 42.35 (39.37-45.37) | 21.20 (<0.01) |
| Medium | 54.85 | 27.19 (23.43-31.20) | 31.22 | 38.71 (35.71-41.77) | ||
| High | 24.42 | 50.96 (43.96-57.94) | 34.44 | 48.58 (45.53-51.64) | ||
| COVID-19 tested | ||||||
| Yes | 21.35 | 35.08 (28.33-42.30) | 0.17 (0.67) | 16.41 | 44.21 (39.69-48.81) | 0.22 (0.63) |
| No | 78.65 | 36.71 (33.16-40.37) | 83.58 | 43.05 (41.17-44.95) | ||
| COVID-19 positive | ||||||
| Positive | 5.03 | 70.73 (54.46-83.87) | 21.92 (<0.01) | 4.64 | 76.42 (67.92-83.60) | 57.39 (<0.01) |
| Negative | 94.97 | 34.73 (31.54-38.01) | 95.36 | 41.90 (40.13-43.68) | ||
| Total (n) | 815 | 3040 | ||||
P*< 0.05 are considered as significant
The infection to case ratio (ICR) in Jharkhand was 2.9 (95% CI: 0.9-6.5) in round 1 and 1.4 (95% CI: 0.9-4.2) in round 2. In the first round, the highest ICR was found in the districts of Dumka 25 (95% CI: 15.1-36.3) and Khunti 25 (95% CI: 18.2-39.6). In the second round, the highest ICR was in Dumka 13.5 (95% CI: 8.1-23.6) district (Table IV). The IFR was also increased in Jharkhand from 0.06 (95% CI: 0.02-0.17) in the first round to 0.63 (95% CI: 0.47-0.92) in the second round. Heat maps across the districts for both the rounds are provided in Figures 1 and 2, respectively.
| District | Round 1 | Round 2 | ||||||
|---|---|---|---|---|---|---|---|---|
| Estimated number of infections | ICR (as per 10,000 infections) 95% CI | Deaths (till June, 2020) | IFR (as per 10,000 infections) 95% CI | Estimated number of infections | ICR (as per 10,000 infections) 95% CI | Deaths (till February, 2021) | IFR (as per 10,000 infections) 95% CI | |
| Bokaro | 47,179 | 12.0 (8.4-19.6) | 1 | 0.21 (0.11-0.39) | 1,273,825 | 3.5 (1.2-7.9) | 63 | 0.49 (0.31-0.64) |
| Dhanbad | 30,691 | 1.4 (0.8-1.9) | 0 | 0 | 1,227,639 | 2.3 (0.8-8.5) | 111 | 0.90 (0.71-1.24) |
| Dumka | 15,114 | 25.0 (15.1-36.3) | 0 | 0 | 680,130 | 13.5 (8.1-23.6) | 14 | 0.21 (0.09-0.44) |
| East Singhbhum | 47,179 | 0.0 | 0 | 0 | 1,362,948 | 1.2 (0.4-4.6) | 356 | 2.61 (2.24-2.97) |
| Gharwa | 22,693 | 0.0 | 0 | 0 | 590,022 | 5.9 (1.8-11.9) | 13 | 0.22 (0.14-0.36) |
| Hajaribagh | 23,805 | 1.7 (0.9-2.4) | 0 | 0 | 1,011,731 | 5.1 (1.3-12.6) | 37 | 0.37 (0.21-0.59) |
| Khunti | 8494 | 25.0 (18.2-39.6) | 0 | 0 | 127,404 | 2.7 (0.8-6.5) | 7 | 0.55 (0.42-0.81) |
| Palamu | 66,457 | 22.2 (11.3-41.7) | 0 | 0 | 553,811 | 2.9 (1.1-7.4) | 23 | 0.42 (0.29-0.78) |
| Ranchi | 166,575 | 7.8 (2.1-16.8) | 2 | 0.12 (0.04-0.27) | 1,499,174 | 0.6 (0.2-1.4) | 226 | 1.51 (1.17-1.83) |
| West Singhbhum | 18,897 | 6.2 (1.1-12.4) | 0 | 0 | 515,378 | 2.1 (0.9-4.6) | 38 | 0.74 (0.54-0.99) |
| Jharkhand | 849,071 | 2.9 (0.9-6.5) | 5 | 0.06 (0.02-0.17) | 16,687,127 | 1.4 (0.9-4.2) | 1057 | 0.63 (0.47-0.92) |
ICR, infection-to-case ratio; IFR, infection fatality ratio; CI, confidence interval
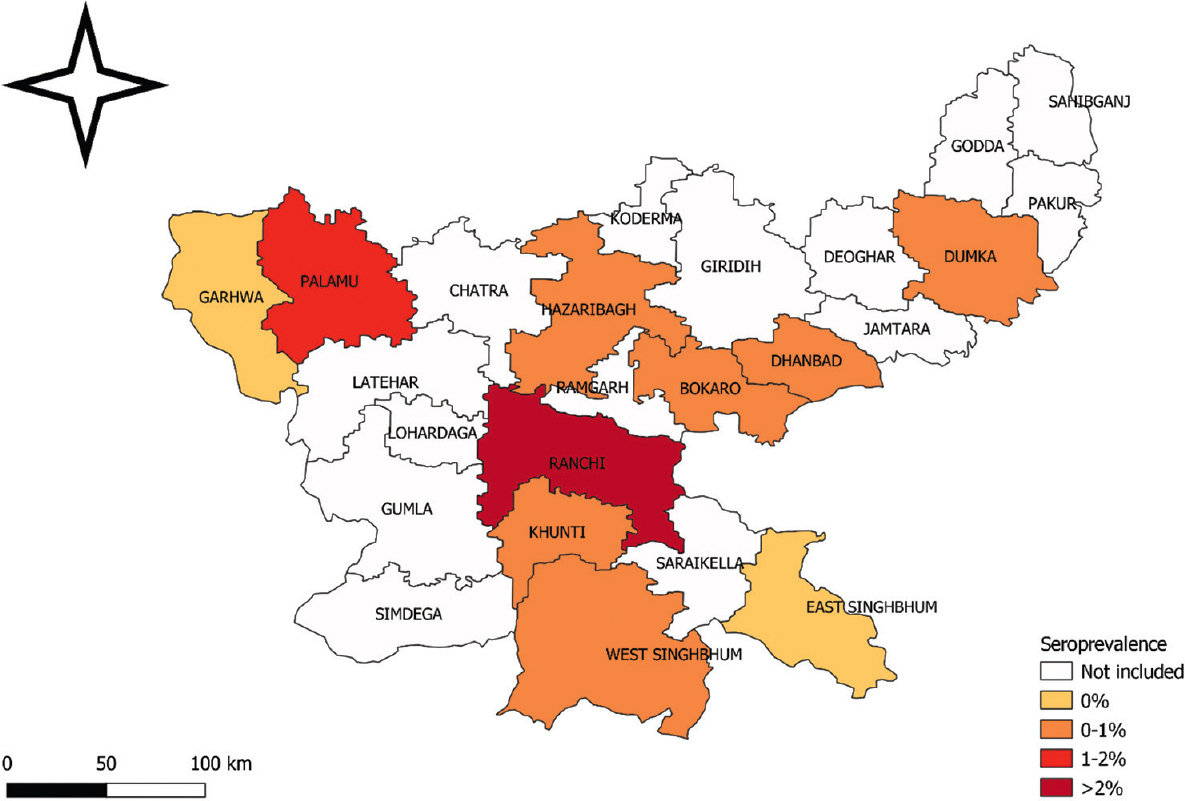
- Jharkhand seroprevalence in round 1 (Source: QGIS v3.10, https://www.qgis.org/en/site/).

- Jharkhand seroprevalence in round 2 (Source: QGIS v3.10, https://www.qgis.org/en/site/).
Discussion
In Jharkhand, the first case of COVID-19 was reported on April 1, 2020, from the capital city of Ranchi. In the first round of serosurvey in the State, seroprevalence was found to be 0.54 per cent, which was much lower than the seroprevalence detected during the National Serosurvey conducted by ICMR during May-June 20207. It was also lower than the seroprevalence detected in its neighbouring State of Odisha, which is a tribal dominated State of India. In Odisha, the seroprevalence was 1.55 per cent in Bhubaneswar in July 2020, 24.59 per cent in Rourkela (August, 2020) and 31.14 per cent in Berhampur (August, 2020)23,24. The low seroprevalence in Jharkhand could be due to the strict implementation of a State-wide lockdown since March 22, 2020. Jharkhand was one of the first five States to adopt and implement State-wide lockdown in India25. A community-based study from British Columbia in Canada, involving serial cross-sectional sampling, reported a seroprevalence of only 0.28 per cent in March 2020 and 0.55 per cent in May 202026.
The seroprevalence during the second round in the month of February, 2021 was 41.69 per cent (95% CI: 40.16-43.22), whereas the percentage increase of 41.11 per cent took place over a period of seven months. This was also lower than the seroprevalence detected in Bhubaneswar (54%) and Agartala (55.65%), the capital city of the north-eastern State of Tripura, conducted during March 202127. The third national serosurvey conducted during December and January 2021, by the ICMR demonstrated an overall seroprevalence of 24.1 per cent in the country28. This could be due to heterogeneous spread of SARS-CoV-2 infection in India and different study timings.
In both the rounds of serosurveys, higher seropositivity was found among the middle-aged group (45-59 yr), which might be due to their higher mobility, resulting in increased exposure. This age group represents working population, making them more susceptible to exposure to infection while engaging in different occupations. There was a gender-wise difference in seropositivity with higher seropositivity amongst males, and this was significant in the second round (51.35% in males vs. 33.7% in females). Among the tribal group, although the gender difference in seroprevalence was not significant during round 1 (0.26% in males vs. 0.21% in females), it was significantly higher in males during round 2 (50.57% in males vs. 27.35% in females). Noticeably, the role of gender towards vulnerability to infectious diseases has been reported by Díaz et al29. The susceptibility to exposure or infection is influenced by age and gender and varies between cultures and tribes30.
The results indicated that about 0.81 per cent of the population in the community and 0.41 per cent in the high-risk group had developed antibodies in round 1, whereas it was 36.92 and 56.69 per cent in round 2, respectively. The first round findings were similar to the first nationwide serosurvey conducted by the ICMR in May-June 2020, in which overall unweighted seroprevalence was 0.56 per cent7. Similarly, the ICMR had conducted a third round serosurvey in the month of December 2020 where seroprevalence amongst adults was detected to be 24.3 per cent and in healthcare workers it was 25.6 per cent28. The second round of our study survey showed higher seroprevalence which might be due to the study taking place after two months from ICMR third round serosurvey giving ample time for the spread of infection The majority of healthcare workers received the first dose of vaccine by that time as vaccination started in the month of January 2021.
This study was conducted in ten different districts of Jharkhand, which provided a true picture of seropositivity in the State. Second, the study shows the possibility of herd immunity through natural infection, as during round 2, only healthcare workers were eligible for COVID-19 vaccination. This is also the first study in India that studied the seropositivity among tribal population and compared the situation between tribal and non-tribal populations. Our study had a few limitations. The possibility of selection bias cannot be ruled out. The sample size was estimated for the whole community considering 23 per cent of the study population as tribal11. While 20 per cent of our study participants belonged to the ST community, this might have affected the group comparison. Finally, we might have overestimated the ICR by using COVID-19 cases reported one and two week before the median date of all survey districts.
The low seroprevalence in rural areas compared to urban settings in both the rounds is as expected as the people in rural areas live in sparsely populated villages, in forest areas with less pollution and well ventilated houses. Round 1 serosurvey was conducted in the lockdown period, whereas round 2 serosurvey was conducted after complete unlocking of the State. This could be the major reason for high seropositivity in round 2, as during round 1, several travel restrictions were imposed and people were advised to keep themselves isolated in their homes. The government-imposed lockdown possibly was also a key factor that restricted the travel movement towards cities, and due to the self-reliance of villagers, the spread of infection in rural areas was limited.
Overall, our study identified a rapid rise in SARS-CoV-2 seroprevalence in Jharkhand over a period of eight months (June 2020-February 2021), which might have been due to unlocking of different districts. Both the serosurveys were carried out during the lockdown phase, but there was a period in between when lockdown was not in place. The prevalence during the first lockdown was attributed to lifestyle, travel restrictions, geography of the state and low work-related migration. Strict adherence to COVID-19 protocols during the initial phase such as social distancing and wearing of masks could be the factors leading to low prevalence. Our findings generated key insight into the dynamics of COVID-19 across the waved in a tribal-dominated state and this could inform in designing and implementing effective public health strategies to mitigate the burden of COVID-19 in the State. The study findings also suggest the need for periodic serosurveys in these tribal dominated regions of the country to inform appropriate intervention strategies.
Supplementary Figure
Supplementary Figure Study flowchart of round 1 (left panel) and round 2 (right panel) serosurvey.Acknowledgment:
The authors acknowledge all the healthcare workers for their tireless dedication at each level to fight COVID-19 and for voluntarily participating in this cohort study.
Financial support & sponsorship: The study was funded by the Department of Health, Medical Education and Family Welfare, Government of Jharkhand (Grant No. TB/STDC/17/2020-977).
Conflicts of Interest: None.
References
- World Health Organization. Coronavirus disease (COVID-19). Available from: https://www.who.int/emergencies/diseases/novel-coronavirus-2019
- 2020. myGOV, Government of India. COVID19 Statewise status. Available from: https://mygov.in/corona-data/covid19-statewise-status/
- Worldometer. India COVID: 30,981,339 cases and 411,928 deaths. Available from: https://www.worldometers.info/coronavirus/country/india/
- Epidemic trend of COVID-19 transmission in India during lockdown-1 phase. J Community Health. 2020;45:1291-300.
- [Google Scholar]
- Government of Jharkhand. COVID-19 dashboard. Available from: https://covid19.jharkhand.gov.in/dashboard/
- Ministry of Health and Family Welfare, Government of India. COVID-19 India as on July 19, 2021. Available from: https://www.mohfw.gov.in/
- Prevalence of SARS-CoV-2 infection in India:Findings from the national sero survey, May-June 2020. Indian J Med Res. 2020;152:48.
- [Google Scholar]
- Seroepidemiologic study designs for determining SARS-CoV-2 transmission and immunity. Emerg Infect Dis. 2020;26:1978-86.
- [Google Scholar]
- Beyond sero surveys:Human biology and the measurement of SARS-CoV-2 antibodies. Am J Hum Biol. 2020;32:E23483.
- [Google Scholar]
- World Health Organization. Population-based age-stratified seroepidemiological investigation protocol for coronavirus 2019 (COVID-19) infection, 26 May 2020, version 2.0. Geneva: WHO; 2020.
- Office of the Registrar General & Census Commissioner India. Ministry of Home Affairs, Government of India. Census of India: Scheduled castes and scheduled tribes. Available from: https://censusindia.gov.in/census.website/data/census-tables
- Government of Jharkhand State. Tribals. Available from: https://www.jharkhand.gov.in/home/AboutTribals
- ENVIS Hub: Jharkhand. Status of Environment and Related Issues. Department of Forests, Environment & Climate Change, Government of Jharkhand. Ministry of Environment, Forests & Climate Change, Government of India. Tribes: Jharkhand. Available from: http://jharenvis.nic.in/Database/TRIBESOFJHARKHANDSTATE_2329.aspx
- United Nations. The impact of COVID-19 on indigenous peoples in Latin America (Abya Yala): Between invisibility and collective resistance. Available from: https://www.cepal.org/en/publications/46698-impact-covid-19-indigenous-peoples-latin-america-abya-yala-between-invisibility
- A qualitative exploratory study using One Health approach for developing an intervention package for elimination of human anthrax in an endemic district of Odisha, India. Indian J Med Res. 2021;153:394-400.
- [Google Scholar]
- The Hindu. For Odisha tribals, physical distancing has been a way of life. Available from: https://www.thehindu.com/news/national/for-odisha-tribals-physical-distancing-has-been-a-way-of-life/article33359011.ece
- Livelihood vulnerabilities of tribals during COVID-19. Econ Polit Wkly. 2021;56:19-22.
- [Google Scholar]
- United Nations. Department of Economic and Social Affairs Indigenous Peoples. COVID-19 and indigenous peoples. Available from: https://www.un.org/development/desa/indigenouspeoples/covid-19.html/
- National sero-surveillance to monitor the trend of SARS-CoV-2 infection transmission in India:Protocol for community-based surveillance. Indian J Med Res. 2020;151:419-23.
- [Google Scholar]
- SARS-CoV-2 antibody seroprevalence in India, August-September, 2020:Findings from the second nationwide household serosurvey. Lancet Glob Health. 2021;9:e257-66.
- [Google Scholar]
- Indian Council of Medical Research. National ethical guidelines for biomedical and health research involving human participants. New Delhi: ICMR; 2017. p. :1-187.
- 2021. COVID-19 Dashboard. Government of Jharkhand. COVID-19 district-wise status. Available from: https://www.jharkhand.gov.in/Home/Covid19Dashboard
- Serological surveys to inform SARS-CoV-2 epidemic curve:A cross-sectional study from Odisha, India. Sci Rep. 2021;11:10551.
- [Google Scholar]
- Sero-prevalence of SARS-CoV-2 in Bhubaneswar, India:Findings from three rounds of community surveys. Epidemiol Infect. 2021;149:E139.
- [Google Scholar]
- Coronavirus in Jharkhand:State-wide lockdown declared till March 31. Available from: https://www.indiatvnews.com/news/india/coronavirus-in-jharkhand-state wide-lockdown-declared-till-march-31-600576
- Low SARS-CoV-2 sero-prevalence based on anonymized residual sero-survey before and after first wave measures in British Columbia, Canada, March-May 2020. medRxiv 2020 Doi:https://doi.org/10.1101/2020.07.13.20153148v1
- [Google Scholar]
- Serological prevalence of SARS-CoV-2 antibody among children and young age group (between 2 and 17 years) in India: An interim result from a large multicentric population-based seroepidemiological study. J Family Med Prim Care. 2022;11:2816-23.
- [Google Scholar]
- SARS-CoV-2 sero-prevalence among the general population and healthcare workers in India, December 2020-January 2021. Int J Infect Dis. 2021;108:145-55.
- [Google Scholar]
- The role of age and gender in perceived vulnerability to infectious diseases. Int J Environ Res Public Health. 2020;17:485.
- [Google Scholar]
- How sex and age affect immune responses, susceptibility to infections, and response to vaccination. Aging Cell. 2015;14:309-21.
- [Google Scholar]


