
Translate this page into:
Cost of National Vector Borne Disease Control Programme in North India
For correspondence: Dr Shankar Prinja, Department of Community Medicine & School of Public Health, Postgraduate Institute of Medical Education & Research, Sector-12, Chandigarh 160 012, India e-mail: shankarprinja@gmail.com
-
Received: ,
This article was originally published by Wolters Kluwer - Medknow and was migrated to Scientific Scholar after the change of Publisher.
Abstract
Background & objectives:
Despite significant resources being spent on National Vector Borne Disease Control Programme (NVBDCP), there are meagre published data on health system cost upon its implementation. Hence, the present study estimated the annual and unit cost of different services delivered under NVBDCP in North India.
Methodology:
Economic cost of implementing NVBDCP was estimated based on data collected from three North Indian States, i.e. Punjab, Haryana and Himachal Pradesh. Multistage stratified random sampling was used for selecting health facilities across each level [i.e. subcentres (SCs), Primary Health Centres (PHCs), community health centres (CHCs) and district malaria office (DMO)] from the selected States. Data on annual consumption of both capital and recurrent resources were assessed from each of the selected facilities following bottom-up costing approach. Capital items (equipment, vehicles and furniture) were annualized over average life span using a discount rate of 3 per cent. The mean annual cost of implementation of NVBDCP was estimated for each level along with unit cost.
Results:
The mean annual cost of implementing NVBDCP at the level of SC, PHC and CHC and DMO was ₹ 230,420 (199,523-264,901), 686,962 (482,637-886,313), 1.2 million (0.9-1.5 million) and 9.1 million (4.6-13.5 million), respectively. Per capita cost for the provision of complete package of services under NVBDCP was ₹ 45 (37-54), 48 (29-73), 10 (6-14) and 47 (31-62) at the level of SC, PHC, CHC and DMO level, respectively. The per capita cost was higher in Himachal Pradesh (HP) at SC [₹ 69 (52-85)] and CHC [₹ 20.8 (20.7-20.8)] level and in Punjab at PHC level [₹ 89 (49-132)] as compared to other States.
Interpretation & conclusions:
The evidence on cost of NVBDCP can be used to undertake future economic evaluations which could serve as a basis for allocating resources efficiently, policy development as well as future planning for scale up of services.
Keywords
Annual cost
National Vector Borne Disease Control Programme
per capita cost
unit cost
vector-borne diseases

The vector-borne diseases (VBDs) are a group of communicable diseases constituting malaria, dengue, chikungunya, japanese encephalitis (JE), kala-azar and lymphatic filariasis. In South East Asia, which has the highest burden of VBD, India alone contributes to the highest burden of more than a million cases diagnosed annually1. Amongst all the VBDs in India, malaria constitutes the major burden both in terms of morbidity and mortality23. Besides malaria, around 34 per cent of the global dengue cases are diagnosed in India, with the incidence showing a rising trend over the last decade4. Similarly, the burden of chikungunya has risen by more than three times over the last five years, i.e. from 3,300 cases in 2015 to 12,200 cases in 20195.
To tackle with the persistent and rising burden of VBDs, three previous centrally sponsored programmes, i.e. National Anti-Malaria Programme, National Filaria Control Programme and National Kala-azar Control Programme, were integrated into a single ‘National Vector Borne Disease Control Programme’ (NVBDCP) in 20036. It aims to control VBDs by promoting early case detection, prompt treatment and strengthening of referral services. It also focusses on specific prevention activities related to vector management such as indoor residual spraying (IRS), fogging and promoting the use of insecticide-treated bed nets and larvivorous fish6.
Of the total budget (₹ 43.58 billion) allocated to the control of communicable diseases in 2016-2017, only 11.73 billion (27%) was spent at the national level7. This clearly depicts the lack of efficient use of budget to tackle the menace of communicable diseases. Despite the resources being spent for the control of VBDs under NVBDCP, empirical evidence on the cost of its implementation at various levels of health system is scanty. Further, with decentralized planning at the district level, the need for generating reliable estimates of health system cost becomes necessary for future planning and policy development and assessing the programme’s efficiency. Although there have been studies on the out-of-pocket expenditure incurred by patients on the treatment of various VBDs8910, there is limited published evidence from the perspective of an Indian health system, on the cost of various services delivered under the umbrella of NVBDCP. A couple of studies did assess the total annual cost spent on NVBDCP at primary [subcentres (SCs) and Primary Health Centres (PHCs)] and secondary level [community health centres (CHCs)] of health system1112, but these studies did not estimate the unit cost and per capita cost of specific services such as active/passive surveillance, radical treatment and laboratory tests under the domain of NVBDCP. Furthermore, these studies also did not take into consideration the resources used and spent at the district malaria office (DMO), which is one of the major cost centres, while estimating the total cost of implementing NVBDCP. Therefore, the present study was designed primarily to assess the annual cost of implementing NVBDCP at both primary and secondary levels of health system along with estimation of unit cost and per capita cost of various services delivered under this programme across each level of health facility.
Material & Methods
Study settings and sampling methodology: The present study was undertaken in the three north Indian States of Punjab, Haryana and Himachal Pradesh (HP). The epidemiological situation of malaria, 2014, in India that includes annual parasite index and slide positivity rate of Haryana was 0.17, 0.18; Punjab is 0.04, 0.03 and HP is 0.02, 0.02 respectively13.
A multistage stratified random sampling was followed for the selection of districts and health facilities from the three States. In the first stage, a total of five districts were chosen randomly, i.e. two out of 21 districts from Haryana, two out of 22 districts in Punjab and one out of 12 districts in HP. Following this, two CHCs were selected from each district based on the highest and lowest burden of VBDs. Further, following the same criteria, two PHCs were chosen from each of the selected CHC. Finally, one farthest SC and one nearest SC were picked from each of the selected PHCs. Finally, a total of 40 SCs, 20 PHC’s, 10 CHCs and 5 DMOs were selected for the present study.
In terms of nomenclature, CHC in Punjab is known by the term ‘upgraded PHC’, but has an infrastructure equivalent to that of a CHC. Similarly, a standard PHC is known as ‘mini PHCs’ and delivers the same set of service package given at a standard PHC.
Data collection: Economic cost of implementing NVBDCP was assessed based on the bottom-up costing method during the reference year of 2016. Public health programmes such as NVBDCP are fully horizontally integrated and implemented using the existing infrastructure and staff present at the health facilities. For such programmes, resources present at the health facilities (such as healthcare workers, space, building, equipment, furniture, etc.) are shared across all the preventive and curative services delivered at the facility. Therefore, the first step under this approach included identification of various cost centres at each level of health facility (such as OPD room, laboratory, waiting area, MPHS room, etc.) associated with the delivery of NVBDCP services. The next step was assessing the quantity of various inputs in the form of capital items and recurrent resources consumed under each of the cost centres. The capital items comprised space/building, equipment [both medical and non-medical machines for fogging and indoor residual spraying (IRS)], furniture items and other non-consumables having a life period of more than one year. Recurrent resources consisted of drugs, consumables, stationary items, overheads (electricity, water, Internet, etc.) and other resources having a life period of less than one year. Salaries of human resources (fully or partially involved with NVBDCP) were also classified as recurrent resources. The framework for this analysis is shown in Figure 1.
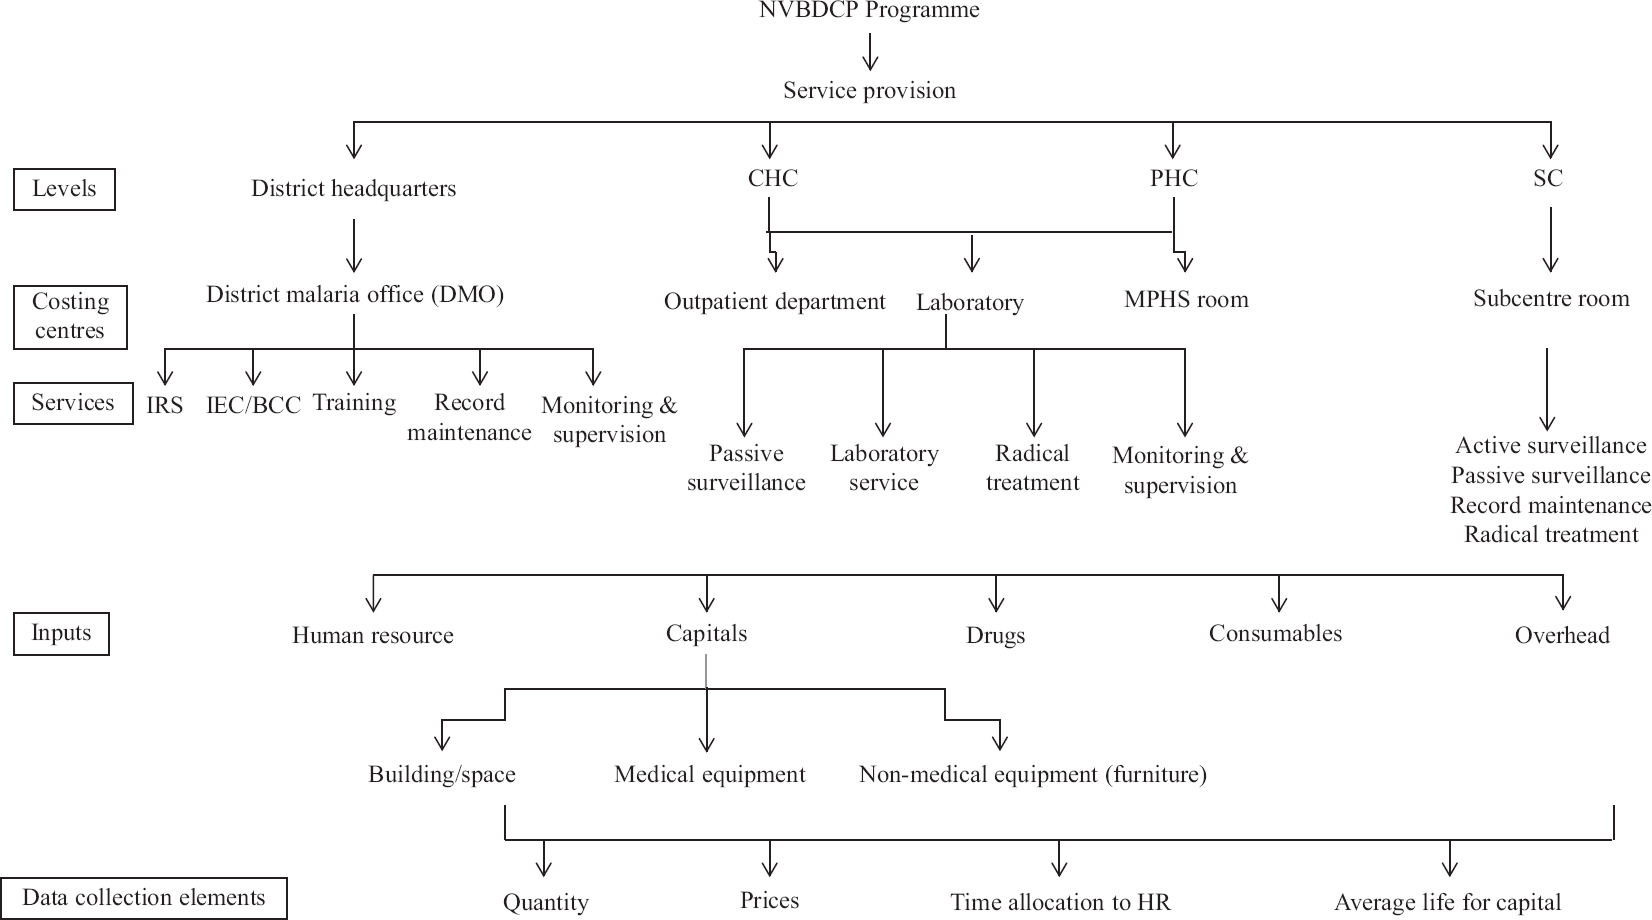
- Costing framework for NVBDCP programme. CHC, community health centre; PHC, primary health Centre; SC, subcentre,; IRS, indoor residual spraying; IEC, information, education and communication; MPHS, multipurpose health supervisor
Data sources: Facility survey was undertaken for assessing the dimensions (square feet) of the space on which the health facility was built. Non-consumable stock registers were reviewed (along with facility survey) for assessing the quantity of various medical/non-medical equipment and furniture. Further, stock registers and pharmacy records were reviewed to enlist the quantity of various drugs and consumables utilized (for delivery of services under NVBDCP) during the reference time period. Along with the data of these inputs, the data on service output were collected by reviewing various routine records such as outpatient registers, malaria forms (MF) 2 and MF 7 registers, laboratory registers and other annual reports of the facility. The data collection was undertaken by postgraduate level field investigators trained for collecting data on costing.
After assessing the quantity of various input resources, data on unit price of these resources were assessed. Government procurement prices were used for pricing the drugs, consumables and equipment items. Due to non-availability of price data on some of these items, price charged by local distributors and that reported from relevant websites were considered14. Similarly, due to non-availability of procurement prices for furniture and stationary items, market prices were used. For estimating the space costs, local commercial rental price was used, which was assessed based on expert opinion by interviewing key informants from local area, where health facility was located. Annual salaries along with incentives paid to the staff members were assessed from the accounts records of the respective health facilities. Monthly bills of electricity, water, Internet and telephone along with any maintenance cost (building or equipment) were also collected to estimate the overhead cost. Apart from this, data on any kind of incentives paid to accredited social health activists (ASHA), a voluntary health worker under NVBDCP programme and resources spent on IEC activities/trainings related to NVBDCP were also elicited from the account records.
All the staff members involved with NVBDCP were interviewed based on semi-structured interview schedule for assessing their time spent on various services including activities related to NVBDCP during the last one year. Since the services provided under NVBDCP are season dependent, in terms of incidence of VBD, the frequency of the service provision did not remain constant throughout the year. Based on this, interviews were conducted at two different times, i.e. off season and malaria season to reduce the chances of recall bias. Interviews included information on frequency of the activities (such as outpatient consultation, active surveillance, IEC/health education and slide preparation) in both in and off season and the time spent per activity. Time spent by staff members on the administrative work was also collected. The time allocation interviews were also supplemented with observation-based data on time spent on activities done on daily basis by various staff members. Written informed consent was obtained to interview the staff members. (
Ethical approval for the present study was obtained from the Institute Ethics Committee of the Postgraduate Institute of Medical Education and Research, Chandigarh, India. Administrative approval of State Departments of Health and Family Welfare was also obtained to undertake data collection.
Data analysis: Expenditure incurred on the capital items (equipment, vehicles and furniture) was annualized, which involved spreading out the costs of these items over the useful life of the asset to arrive at the equivalent annual cost. Annualization takes into consideration the discount rate (time preference for money and inflation) and the lifespan of capital equipments. As per standard guidelines, a discount rate of three per cent was applied1516. The standard literature was reviewed for assessing the average lifespan of the capital items1517. Further, the local staff at the health facility was also interviewed for assessing the same. Space costs were calculated by multiplying the estimates of floor size of rooms of the health facility with local commercial rental prices of similar space. The cost of recurrent items was calculated by multiplying the unit price of each of these items with the respective quantity consumed.
The cost of certain resources (both capital and recurrent) in the facility that were used solely for providing NVBDCP services (such as equipment for fogging/IRS and drugs for radical treatment of malaria) was completely allocated to the same. While in case of some resources that were jointly used to deliver two or more services (OPD room, slides, laboratory equipments, etc.), the cost was apportioned among the respective services using appropriate statistics, as shown in Table I. Specifically, the proportional time spent by staff members in various activities was used for apportioning their salaries towards each of these activities, respectively.
| Costing head | Sources of information | Basic analysis | Apportioning statistics (joint costs) |
|---|---|---|---|
| Salaries of human resource | Salaries of staff involved in NVBDCP (fully or partially) and account records from district health office | Annual salaries of the health staff of the health facility were calculated including the TA/DAs, and cost of additional perks provided | As per the proportion of time spent by an individual in providing NVBDCP services |
| Building (space and rent) |
Space: Facility survey by the investigators Rent: By interviewing key informants for market rental price for 100 sq feet of space |
The annual rental value of the space was calculated by obtaining the market rental values of the place | Shared areas were apportioned on the basis of number of patients seeking NVBDCP services |
| Furniture and equipment (quantity, price and average life) |
Quantity: Stock registers and facility survey by investigators Price: Rate contract of State governments, market price by physical interviews with distributers, dealers and relevant websites Average life: Literature review, interviews with staff at health facility |
The one-time costs of purchase of furniture and equipment were annualized for their average life | The annualized cost was then apportioned based on the number of patients seeking NVBDCP services |
| Drugs (price and quantity) |
Price: Market price lists were obtained from the local distributors Quantity: Stock registers in the health facilities were referred |
The annual amount spent on drugs was calculated by multiplying quantity procured within data collection year and unit price for each drug | Based on the patients/beneficiaries utilizing these drugs under NVBDCP related healthcare services being provided at the facility |
| Consumables (price and quantity) |
Quantity: To record the annual utilization within last year, the stock registers were checked Prices: Rate contract of state governments, market price from the distributors |
The annual expenditure on consumables was calculated from the quantity used and unit prices | As per proportion of beneficiaries utilizing consumables under NVBDCP-related healthcare services |
| Electricity and water bills | Bills for last one year | As per proportion of number of patients seeking NVBDCP services |
TA, travel allowance; DA, daily allowance
Most of the equipment and chemicals such as temephose and technical malathion used for fogging and spray were present at higher levels of health facilities, i.e. at Community Health Centres (CHCs) and District Malaria Office (DMO), the cost of these was included accordingly. However, the time spent by staff for fogging and IRS at SC and PHC was included in costing as per the lower levels of health facilities.
Calculation of annual and unit cost: The annual cost of implementing NVBDCP was estimated along with its distribution among various inputs (human resource, capital, consumables, equipment, drugs and overheads) and specific services of the programme. The various services delivered under NVBDCP included passive surveillance (routine outpatient consultation), active surveillance (included mass contact slides preparation, Aedes/entomological survey and health education as it was difficult to differentiate time for these activities when health workers went for the outreach field work), laboratory activities, monitoring and supervision and fogging and spray (including IRS and anti-larval measures).
In addition to the total cost, the per capita cost and unit cost [along with 95% confidence interval (CI)] of specific services were also computed. The per capita cost at a given level of facility was estimated by dividing annual cost with population under administrative boundary of the concerned facility. The per capita cost at district level was calculated by dividing the total annual cost of implementing the programme in a district that includes the annual cost of all SCs, PHCs, CHCs and DMO with the population covered under this district. The unit cost of a specific service was calculated by dividing the total cost for the particular service by the number of beneficiaries that availed the specific service. For example, the unit cost of passive surveillance was calculated by the total cost for the same divided by the number of passive slides made at a particular health facility. Bootstrap method was used and the analysis was done on SPSS 21 (IBM Statistical Package for the Social Sciences for Windows, Version 21.0, IBM Corp., Armonk, NY, USA) for estimating the 95 per cent CI.
Results
The mean annual cost of implementing NVBDCP at the level of SC, PHC, CHC and DMO was found to be ₹ 230,420 (199,523-264,901), 686,962 (482,637-886,313), 1.2 million (0.9-1.5 million) and 9.1 million (4.6-13.5 million), respectively. The input-wise division of annual cost at each level of health facility is shown in Tables II-IV. It was seen that salaries alone accounted for more than 85 per cent of total annual cost at each level, followed by that of equipment and furniture (Fig. 2).
| Subcentre/type of cost | Service heads | Haryana (n=16) Mean; CI | Punjab (n=16) Mean; CI | Himachal Pradesh (n=8) Mean; CI | Overall (n=40) Mean; CI |
|---|---|---|---|---|---|
| Annual cost | 234,062 (194,19-275,830) | 231,867 (165,346-291,295) | 209,966 (149,241-275,631) | 230,420 (199,637-265,493) | |
| Per capita cost | 40 (28-55) | 37 (25-49) | 69 (52-85) | 45 (37-54) | |
| Input - wise distribution of annual cost | Human resource | 222,827 (182,663-265,220) | 208,301 (141,176-270,209) | 187,363 (131,065-248,044) | 211,979 (181,246-247,288) |
| Consumable | 825 (586-1084) | 703 (447-1011) | 1,245 (703-2198) | 860 (652-1083) | |
| Drugs | 1686 (1159-2344) | 202 (91-318) | 1,019 (608-1593) | 959 (617-1346) | |
| Overhead | 1,453 (867-2282) | 1,204 (475-2329) | 10,302 (6824-13,658) | 3123 (1900-4622) | |
| Stationary | 5150 (1706-10,901) | 1983 (1027-3243) | 1140 (490-2343) | 3081 (1585-5261) | |
| Equipment/furniture | 1787 (1184-2495) | 18,574 (4579-36,091) | 8125 (5414-11,190) | 9769 (4156-16,747) | |
| Space | 333 (190-514) | 899 (258-1968) | 772 (532-1037) | 648 (364-1109) | |
| Unit cost (specific services) | Passive surveillance (per fever case) | 492 (356-640) | 1,929 (380-4360) | 460 (352-561) | 964 (441-1683) |
| Active surveillance (per fever case) | 254 (159-357) | 299 (194-426) | NA | 274 (202-348) | |
| Laboratory service (per slide made) | 2 (1-2) | 4 (2-9) | 5 (3-8) | 3 (2-5) | |
| RT services (per slide positive malaria case) | 237 (88-448) | 529 (419-750) | NA | 325 (190-490) |
RT, radical treatment; per capita cost, annual cost/population covered; NA, not applicable as service not provided; CI, confidence interval
| PHC/type of cost | Service heads | Haryana (n=8) Mean; CI | Punjab (n=8) Mean; CI | Himachal Pradesh (n=4) Mean; CI | Overall (n=20) Mean; CI |
|---|---|---|---|---|---|
| Annual cost | 999,989 (653,879-1,393,089) | 614,684 (409,609-850,917) | 205,464 (109,338-316,177) | 686,962 (482,637-886,313) | |
| Per capita cost | 26 (19-35) | 89 (49-132) | 10 (5-17) | 48 (29-73) | |
| Input - wise distribution of annual cost | Human resource | 904,268 (604,232-1,258,920) | 520,921 (340,348-753,930) | 180,913 (90,746-296,018) | 606,258 (422,669-804,041) |
| Consumable | 8513 (5006-12,215) | 5295 (2425-8701) | 3884 (283-8895) | 6300 (4259-8513) | |
| Drugs | 9164 (2464-17,548) | 14,987 (4395-27,532) | 13,175 (700-31,000) | 12,295 (6783-18623) | |
| Overhead | 17,977 (7823-29,226) | 7841 (2408-14,275) | 2472 (327-3347) | 10,821 (5579-16,408) | |
| Stationary | 4496 (2374-6833) | 2972 (1285-5182) | 541 (31-1357) | 3095 (1836-4441) | |
| Equipment/furniture | 53,411 (11,715-137,991) | 59,054 (11,254-125,049) | 4323 (478-9595) | 45,851 (13,941-81,075) | |
| Space | 2161 (1083-3256) | 3614 (636-7612) | 156 (41-267) | 2341 (1054-4061) | |
| Unit cost (specific services) | Passive surveillance (per fever case) | 48 (33-64) | 330 (204-507) | 218 (146-289) | 195 (120-286) |
| Active surveillance (per fever case) | 1287 (129-509) | 215 (103-326) | NA | 272 (147-445) | |
| Laboratory service (per slide made) | 104 (67-143) | 234 (120-337) | 409 (10-1154) | 217 (108-379) | |
| RT service (per slide positive malaria case) | 1455 (567-3073) | 1315 (17-3397) | NA | 1393 (418-2640) | |
| Laboratory service (per slide examined) | 38 (22-54) | 29 (17-42) | 27 (19-85) | 32 (22-42) |
PHC, primary heath centre; CI, confidence interval
| CHC/type of cost | Service heads | Haryana (n=4) Mean; CI | Punjab (n=4) Mean; CI | Himachal Pradesh (n=2) Mean; CI | Overall (n=10) Mean; CI |
|---|---|---|---|---|---|
| Annual cost | 1,213,714 (948,703-1,460,115) | 1,585,475 (1,170,502-2,072,752) | 565,399 (485,659-645,139) | 1,232,756 (950,110-1,537,734) | |
| Per capita cost | 9 (4-12) | 5 (2-11) | 20.8 (20.7-20.8) | 10 (6-14) | |
| Input wise distribution of annual cost | Human resource | 1,043,144 (809,107-1,234,825) | 1,513,232 (1,071,230-2,007,633) | 437,534 (410,449-464,618) | 1,110,057 (823,441-1,432,479) |
| Consumable | 40,700 (12,497-85,340) | 15,129 (11,877-18,807) | 12,266 (8052-16,481) | 24,785 (13,462-40,909) | |
| Drugs | 21,206 (600-33,963) | 11,202 (1735-28,692) | 15,323 (7766-22,880) | 16,028 (7827-24,527) | |
| Overhead | 61,800 (11,924-125,837) | 6560 (2053-13,426) | 69,709 (51,445-87,973) | 41,286 (14,419-77,268) | |
| Stationary | 7767 (4223-12,364) | 7143 (5356-8651) | 2938 (1252-4624) | 6552 (4672-8549) | |
| Equipment/furniture | 33,052 (15,197-47,306) | 28,424 (1,7059-37,915) | 26,643 (6397-46,889) | 29,919 (21,614-38,331) | |
| Space | 6045 (3317-11,269) | 3784 (1827-7377) | 987 (300-1674) | 4129 (2192-6701) | |
| Unit cost (specific services) | Passive surveillance (per fever case) | 18 (7-32) | 89 (49-127) | 37 (33-41) | 50 (26-76) |
| Active surveillance (per fever case) | 790 (16-2320) | NA | NA | 790 (16-2320) | |
| Laboratory service (per slide made) | 62 (46-79) | 233 (119-375) | 41 (40-41) | 126 (65-203) | |
| RT service (per slide positive malaria case) | 226 (125-317) | 1947 (79-4912) | NA | 1209 (146-2902) | |
| Laboratory service (per slide examined) | 32 (21-45) | 74 (45-117) | 41 (40-41) | 51 (36-69) |
CHC, community health centre
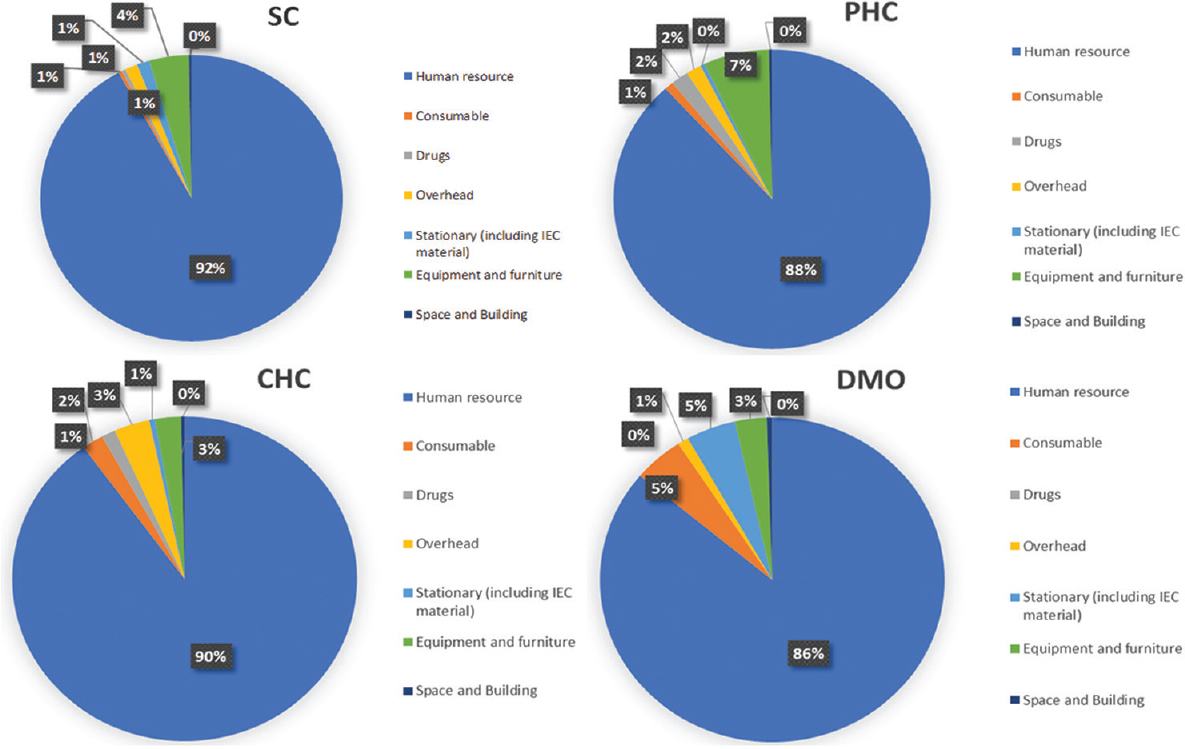
- Cost by input resources.
Distribution of annual cost by type of specific service at each level across the three States is shown in Figure 3. While active surveillance contributed more than half of the total cost at SC level (52%), the laboratory services were a major determinant of the cost at the level of PHC (25%) and CHC (34%). At the district level, fogging and spray activities contributed to the highest proportion of the total cost (75%).
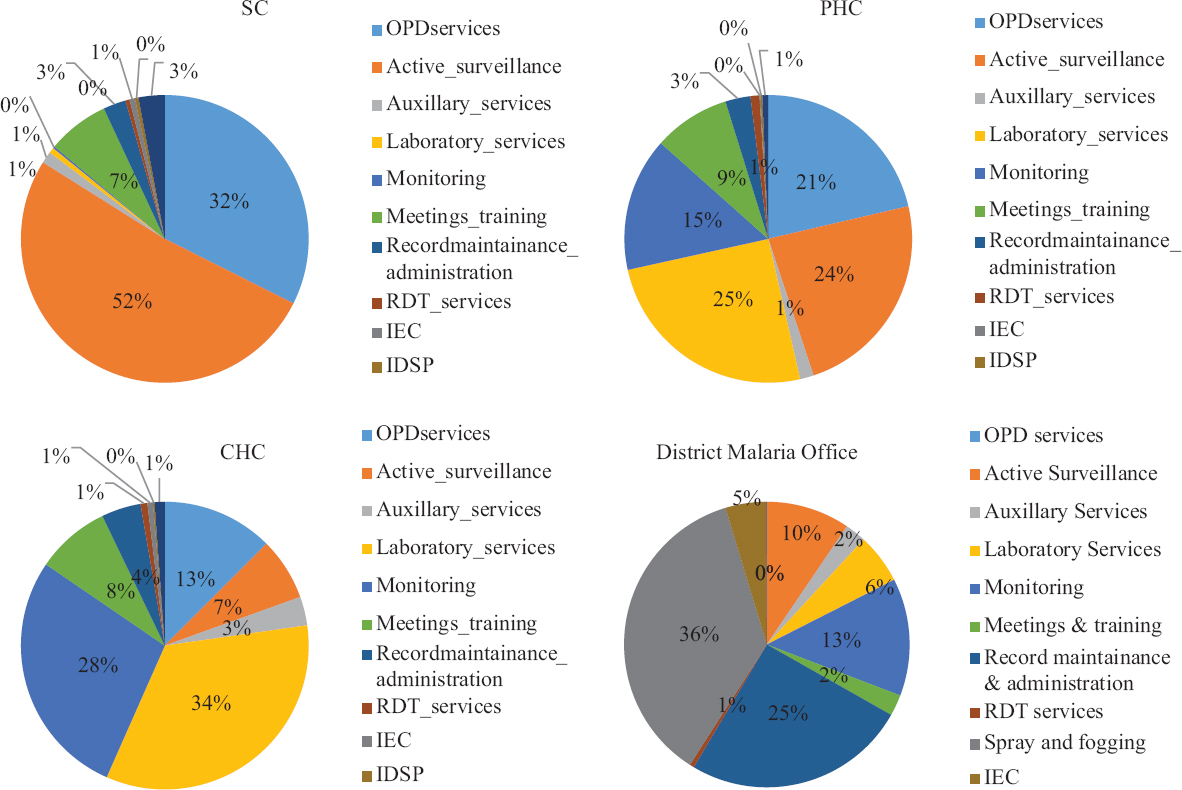
- Cost of NVBDCP by type of resources.
Unit cost: The unit cost of passive surveillance at SC, PHC and CHC was ₹ 964 (441-1,683), 195 (120-286) and 50 (26-76), respectively. Similarly, the unit cost of active surveillance was ₹ 274 (202-348), 272 (108-379) and 790 (16-2,320) at the level of SC, PHC and CHC, respectively. Furthermore, the unit cost per slide made at SC, PHC and CHC was ₹ 3 (2-5), 217 (108-379) and 126 (65-203), respectively (Tables II-IV).
Further, provisioning a complete package of NVBDCP services at the level of SC, PHC, CHC and DMO incurred a per capita cost of ₹ 45 (37-54), 48 (29-73), 10 (6-14) and 47 (31-62) annually, respectively (Table V). Inter-state variations were also observed across levels. The per capita cost in Haryana was ₹ 40 (28-55), 26 (19-25), 9 (4-12) at SC, PHC and CHC levels, respectively. In Punjab, it was ₹ 37 (25-49), 89 (49-132), respectively and ₹ 5 (2-11) and in HP, it was ₹ 69 (52-85), 10 (5-17) and 20.8 (20.7-20.8), respectively (Supplementary Tables I, II, III, IV).
| Unit cost | Cost (₹); CI | |||
|---|---|---|---|---|
| Subcentre | PHC | CHC | District | |
| Per capita cost | 45 (37-54) | 48 (29-73) | 10 (6-14) | 47 (31-62) |
| Passive surveillance (per fever case) | 964 (441-1683) | 195 (120-286) | 50 (26-76) | NA |
| Active surveillance (per fever case) | 274 (202-348) | 272 (147-445) | 790 (16-2320) | NA |
| Laboratory service (per slide made) | 3 (2-5) | 217 (108-379) | 126 (65-203) | NA |
| Laboratory service (per slide examined) | NA | 32 (22-42) | 51 (36-69) | NA |
| RT service (per slide positive malaria case) | 325 (190-490) | 1393 (418-2640) | 1209 (146-2902) | NA |
NA, not applicable as service not provided
| Subcentre Service heads | Haryana | Punjab | HP | Overall | ||||||||
|---|---|---|---|---|---|---|---|---|---|---|---|---|
| Mean (n=40) | CI (95%) | Mean (n=40) | CI (95%) | Mean (n=40) | CI (95%) | Mean (n=40) | CI (95%) | |||||
| Upper limit | Lower limit | Upper limit | Lower limit | Upper limit | Lower limit | Upper limit | Lower limit | |||||
| Human resource | 222,827 | 182,663 | 265,220 | 208,301 | 141,176 | 270,209 | 187,363 | 131,065 | 248,044 | 211,979 | 181,246 | 247,288 |
| Consumable | 825 | 586 | 1084 | 703 | 447 | 1011 | 1245 | 703 | 2198 | 860 | 652 | 1083 |
| Drugs | 1686 | 1159 | 2344 | 202 | 91 | 318 | 1019 | 608 | 1593 | 959 | 617 | 1346 |
| Overhead | 1453 | 867 | 2282 | 1204 | 475 | 2329 | 10302 | 6824 | 13,658 | 3123 | 1900 | 4622 |
| Stationary (including IEC material) | 5150 | 1706 | 10,901 | 1983 | 1027 | 3243 | 1140 | 490 | 2343 | 3081 | 1585 | 5261 |
| Equipment and furniture | 1787 | 1184 | 2495 | 18,574 | 4579 | 36,091 | 8125 | 5414 | 11,190 | 9769 | 4156 | 16,747 |
| Space and building | 333 | 190 | 514 | 899 | 258 | 1968 | 772 | 532 | 1037 | 648 | 364 | 1109 |
| Total annual cost | 234,062 | 194,191 | 275,830 | 231,867 | 165,346 | 291,295 | 209,966 | 149,241 | 275,631 | 230,420 | 199,637 | 265,493 |
| Unit cost | 40 | 28 | 55 | 37 | 25 | 49 | 69 | 52 | 85 | 45 | 37 | 54 |
| Per passive surveillance | 492 | 371 | 630 | 1446 | 215 | 3308 | 460 | 350 | 560 | 934 | 444 | 1647 |
| Per active surveillance | 152 | 64 | 252 | 243 | 136 | 363 | 0 | 0 | 0 | 158 | 94 | 228 |
| Laboratory service per slide made | 2 | 1 | 2 | 4 | 2 | 8 | 5 | 3 | 8 | 3 | 2 | 5 |
| Per radical treatment services | 104 | 19 | 211 | 92 | 0 | 256 | 0 | 0 | 0 | 78 | 17 | 146 |
CI, confidence interval; IEC, information, education and communication
| PHC Service heads | Haryana | Punjab | HP | Total | ||||||||
|---|---|---|---|---|---|---|---|---|---|---|---|---|
| Mean (n=40) | CI (95%) | Mean (n=20) | CI (95%) | Mean (n=10) | CI (95%) | Mean (n=10) | CI (95%) | |||||
| Upper Limit | Lower limit | Upper limit | Lower limit | Upper limit | Lower limit | Upper limit | Lower limit | |||||
| Human resource | 904,268 | 604,232 | 1,258,920 | 520,921 | 340,348 | 753,930 | 180,913 | 90,746 | 296,018 | 606,258 | 422,669 | 804,041 |
| Consumable | 8513 | 5006 | 12,215 | 5295 | 2425 | 8701 | 3884 | 283 | 8895 | 6300 | 4259 | 8513 |
| Drugs | 9164 | 2464 | 17,548 | 14,987 | 4395 | 27,532 | 13,175 | 700 | 31,000 | 12,295 | 6783 | 18,623 |
| Overhead | 17,977 | 7823 | 29,226 | 7841 | 2408 | 14275 | 2472 | 327 | 3347 | 10,821 | 5579 | 16,408 |
| Stationary (including IEC material) | 4496 | 2374 | 6833 | 2972 | 1285 | 5182 | 541 | 31 | 1357 | 3095 | 1836 | 4441 |
| Equipment and furniture | 53,411 | 11,715 | 137,991 | 59,054 | 11,254 | 125,049 | 4323 | 478 | 9595 | 45,851 | 13,941 | 81,075 |
| Space and building | 2161 | 1083 | 3256 | 3614 | 636 | 7612 | 156 | 41 | 267 | 2341 | 1054 | 4061 |
| Total annual cost | 999,989 | 653,879 | 1,393,089 | 614,684 | 409,609 | 850,917 | 205,464 | 109,338 | 316,177 | 686,962 | 482,637 | 886,313 |
| Unit cost | 26 | 19 | 35 | 89 | 49 | 132 | 10 | 5 | 17 | 48 | 29 | 73 |
| Per passive surveillance | 40 | 21 | 60 | 275 | 139 | 476 | 218 | 162 | 289 | 170 | 98 | 268 |
| Per active surveillance | 230 | 75 | 462 | 54 | 0 | 140 | 0 | 0 | 0 | 113 | 40 | 212 |
| Laboratory service per slide made | 88 | 39 | 138 | 195 | 89 | 305 | 409 | 8 | 1534 | 195 | 88 | 373 |
| Per radical treatment services | 427 | 117 | 792 | 659 | 4 | 1766 | 0 | 0 | 0 | 434 | 101 | 909 |
| Laboratory service per slide examined | 34 | 16 | 54 | 29 | 17 | 42 | 27 | 0 | 85 | 30 | 20 | 42 |
PHC, Primary Health Centre; CI, Confidence Interval; IEC, Information, Education and Communication
| CHC Service heads | Haryana | Punjab | HP | Total | ||||||||
|---|---|---|---|---|---|---|---|---|---|---|---|---|
| Mean (n=40) | CI (95%) | Mean (n=20) | CI (95%) | Mean (n=10) | CI (95%) | Mean (n=10) | CI (95%) | |||||
| Upper limit | Lower limit | Upper limit | Lower limit | Upper limit | Lower limit | Upper limit | Lower limit | |||||
| Human resource | 1,043,144 | 809,107 | 1,234,825 | 1,513,232 | 1,071,230 | 2,007,633 | 437,534 | 410,449 | 464,618 | 1,110,057 | 823,441 | 1,432,479 |
| Consumable | 40,700 | 12,497 | 85,340 | 15,129 | 11,877 | 18,807 | 12,266 | 8052 | 16,481 | 24,785 | 13,462 | 40,909 |
| Drugs | 21,206 | 600 | 33,963 | 11,202 | 1735 | 28,692 | 15,323 | 7766 | 22,880 | 16,028 | 7827 | 24,527 |
| Overhead | 61,800 | 11,924 | 125,837 | 6560 | 2053 | 13,426 | 69,709 | 51,445 | 87,973 | 41,286 | 14,419 | 77,268 |
| Stationary (including IEC material) | 7767 | 4223 | 12364 | 7143 | 5356 | 8651 | 2938 | 1252 | 4624 | 6552 | 4672 | 8549 |
| Equipment and furniture | 33,052 | 15,197 | 47,306 | 28,424 | 17,059 | 37,915 | 26,643 | 6397 | 46,889 | 29,919 | 21,614 | 38,331 |
| Space and building | 6045 | 3317 | 11,269 | 3784 | 1827 | 7377 | 987 | 300 | 1674 | 4129 | 2192 | 6701 |
| Total annual cost | 1,213,714 | 948,703 | 1,460,115 | 1,585,475 | 1,170,502 | 2,072,752 | 565,399 | 485,659 | 645,139 | 1,232,756 | 950,110 | 1,537,734 |
| Unit cost | 9 | 4 | 12 | 5 | 2 | 11 | 20.8 | 20.7 | 20.8 | 10 | 6 | 14 |
| Per passive surveillance | 18 | 5 | 32 | 89 | 50 | 126 | 37 | 33 | 41 | 50 | 28 | 76 |
| Per active surveillance | 786 | 4 | 3088 | 0 | 0 | 0 | 0 | 0 | 0 | 314 | 0 | 932 |
| Laboratory service per slide made | 62 | 45 | 78 | 233 | 119 | 355 | 41 | 40 | 41 | 126 | 64 | 203 |
| Per radical treatment services | 157 | 0 | 274 | 1947 | 79 | 5135 | 0 | 0 | 0 | 842 | 75 | 2021 |
| Laboratory service per slide examined | 32 | 21 | 44 | 74 | 43 | 109 | 41 | 40 | 41 | 51 | 35 | 70 |
CI, confidence interval; CHC, Community Health Centre; IEC, Information, Education and Communication
| District Service heads | Haryana | Punjab | Total | ||||||
|---|---|---|---|---|---|---|---|---|---|
| Mean (n=2) | CI (95%) | Mean (n=2) | CI (95%) | Mean (n=4) | CI (95%) | ||||
| Upper limit | Lower limit | Upper limit | Lower limit | Upper Limit | Lower limit | ||||
| Human resource | 12,527,265 | 11,309,065 | 13,745,465 | 3,109,200 | 2,559,953 | 3,658,446 | 7,818,232 | 3,109,200 | 1.3E+07 |
| Consumable | 298,985 | 158,216 | 439,754 | 558,563 | 307,426 | 809,700 | 428,774 | 228,601 | 684,132 |
| Drugs | 0 | 0 | 0 | 0 | 0 | 0 | 0 | 0 | 0 |
| Overhead | 108,300 | 10,496 | 206,103 | 83,579 | 35,000 | 132,158 | 93,633 | 22,748 | 164,517 |
| Stationary (including IEC material) | 164,126 | 123,466 | 204,785 | 683,214 | 7844 | 1,358,584 | 423,670 | 36,750 | 1,049,805 |
| Equipment and furniture | 405,535 | 371,919 | 439,151 | 134,296 | 120,026 | 148,566 | 269,916 | 134,296 | 405,535 |
| Space and Building | 46,095 | 38,280 | 53,910 | 45,925 | 25,350 | 66,500 | 46,010 | 31,815 | 60,205 |
| Total annual cost | 13,550,305 | 12,027,072 | 15,073,538 | 4,614,777 | 4,573,188 | 4,656,366 | 908,0234 | 4,610,163 | 1.4E+07 |
| Unit cost | 59 | 51 | 67 | 35 | 24 | 45 | 47 | 31 | 62 |
CI, Confidence Interval; IEC, Information, Education and Communication
Discussion
Despite a significant amount of resources being devoted to NVBDCP each year, there is no robust economic analysis of this programme. To our knowledge, this is the first comprehensive costing study for determining the total as well as unit cost of delivering various services under NVBDCP, based on data collected from 75 health facilities of the north Indian States. A standardized bottom-up costing methodology was employed alongside analytical methods for estimating economic costs of implementing the programme. Furthermore, a reference period of one complete year was taken to exclude any seasonal variation in terms of disease incidence and service utilization. NVBDCP is a horizontally integrated programme being implemented with the existing staff present at the requisite health facilities that are employed to deliver all the related services to NVBDCP (surveillance, treatment, health promotion, etc.). Therefore, to take into account the cost of donated goods or cost of voluntary workers, the bottom-up costing methodology was employed for computing the total economic cost of this programme.
In comparison to the present work, a study assessing the overall cost of running a SC in north India during 2012-2013 estimated that ₹ 0.08 million was spent for provisioning of services related to control of VBD18, which is less than half of the cost (0.2 million) estimated in the present study. Even after adjusting for the effect of inflation during the intervening years, the estimated cost of the former study was found to be around ₹ 0.13 million for the year of 2017-2018. This difference in the cost might be, firstly, due to the non-inclusion of fogging and spray components in the previous study for which resources were used. Secondly, the present study specifically focussed on the services delivered under NVBDCP; therefore, the cost estimates were the result of more detailed data on resources consumed, precise time allocation interviews and statistics for apportioning of human resource time and other resources towards NVBDCP. However, by comparing the results of our study, with the studies assessing the total cost of running a health facility, it could be seen that the cost of implementing NVBDCP was 10, eight and five per cent of the total annual cost of operating the SC, PHC and CHC, respectively11.
SCs, being the first point of contact with the community and primarily involved in implementation of various public health programmes at the grass root level, outreach activity of active surveillance was found to be the major contributor of the total implementation cost at this level. The higher level of health system, i.e. PHC and CHC, acted as referral centres for those diagnosed with VBDs, leading to laboratory services and radical treatment being the major cost drivers at this level. Likewise, at the district level, all the equipment and consumables used for fogging and IRS were procured at the level of DMO; therefore, fogging and spray constituted the major chunk of the total cost at this level. Furthermore, the major allocation of HR time at DMO level went into collecting and compiling the reports from the lower levels; thus record maintenance and administration cost also contributed largely at this level. Thus, the distribution of spending across services at various levels is in line with the programmatic guidelines and clearly depicts the functioning of the programme across these levels.
The unit cost of active surveillance at CHC level was highest as compared to other levels of PHC and SC. As this cost is HR dependent, active surveillance at CHCs was carried out by staff with higher pay scale, i.e. health inspector and lady health visitor, whereas the same activity was delivered by multipurpose health worker (MPHW) and ANM/ASHA workers (with lower salary scale) at the level of PHC and SC, respectively.
The per capita cost of implementing NVBDCP in three States matches with the pattern of per capita spending on health in the respective States. The highest per capita spending on NVBDCP in the State of HP (at the level of SC and CHC) concurs with the finding of National Health Accounts, which showed HP with the overall highest per capita health care spending among the Indian States19. One of the reasons for the higher per capita spending might be due to the population norms under each facility. Being a hilly State, population density per facility is low as compared to other two states in the study. Similarly, higher per capita costs at PHC level in the State of Punjab is due to difference in population norms of healthcare delivery. While the annual cost of NVBDCP in mini-PHCs of Punjab was similar to normal PHCs of other states, unit costs were significantly higher due to much lesser population per mini-PHCs in the State of Punjab. At the DMO level, both the total cost and per capita cost of NVBDCP were almost three times higher in Haryana as compared to Punjab. The shortage of MPHWs (male) in Punjab was the major reason for this lower total cost. Better availability of workforce in Haryana as compared to Punjab led to three times higher annual HR cost.
Policy and research implications of study findings: Our estimates on the cost of NVBDCP services could be used to undertake further analysis in terms of cost-effectiveness study for assessing the efficiency of the programme. This will further form the basis of the formation of league tables, which rank the cost-effectiveness of health interventions, for prioritizing health expenditures, especially for national health budgets20. Also, these estimates could also be utilized by the government for scaling up of national malaria elimination strategy in India21. Furthermore, the unit costs of mini-PHCs in Punjab were significantly higher as compared to PHCs of other States, thus depicting the need for future research in estimating the cost-effectiveness of establishing mini-PHCs versus regular PHCs.
Despite useful implications the present study did, however, have certain limitations. Firstly, a detailed observation-based time-motion study was not undertaking for assessing time contribution of various staff members on activities of NVBDCP. However, omission of a detailed time-motion study and application of methods used in our study have also been justified in other studies owing to infrequent nature of timings for services due to seasonal patterns111822. Second, unlike population-based studies, where statistical methods to estimate the required sample size are available for various study designs, there is no clear-cut guidance on the sample size calculation for health facility studies. Moreover, for the purpose of costing, representativeness of the sample facilities is given greater importance. We followed rigorous sampling methods to ensure representativeness. However, given the vast heterogeneity in healthcare delivery system in India, our study estimates should be viewed only as representative of northern India. Third, in our analysis, we used the bootstrap method to generate CI around annual and unit costs as the original sample was too less to use a parametric method for generating mean estimates and standard errors11. Fourth, due to restricted sample size, cost function analysis could not be carried out for assessing the impact of independent variables on the total and per capita costs. Fifth, as resources were available at pooled level, some standard techniques for apportioning these had to be used towards NVBDCP activities. This has also been recommended in other costing studies23. However, this could imply compromising on the precision of estimates. This also points to the need for a management information system which is detailed up to the level of recording programme specific inputs and outputs. Lastly, our estimates did not take into account the cost of inpatient care of these VBDs which were mostly referred to the district hospitals and the cost incurred for providing NVBDCP services at the State and national level. However, generic estimates of unit cost of inpatient treatment at district hospitals are only available in Indian settings. Thus, this leads to the future scope of research for the costing of inpatient care for these diseases at the public hospitals as well as at the State and national levels.
Overall, the evidence provided by this study can be used as a basis for allocating resources efficiently under the NVBDCP, as well as planning for scaling up of services under the malaria elimination strategy. Since the government is providing NVBDCP health services free of cost, the results can also be used to evaluate the extent to which subsidies have been cost-effective to the government.
Annexures
Annexure I
Annexure I Cost data collection toolAnnexure II
Annexure II Cost data collection toolAnnexure III
Annexure III Cost data collection toolFinancial support & sponsorship: The study was funded by intramural research grant (71/8-Edu-15/2598-99) of Postgraduate Institute of Medical Education & Research, Chandigarh.
Conflicts of Interest: None.
References
- World Health Organization. World malaria report 2016
- Directorate General of Health Services, Ministry of Health and Family Welfare, Government of India. Malaria: Magnitude of the problem; Available from: http://www.nvbdcp.gov.in/malaria3.html
- Burden of malaria in India:Retrospective and prospective view. Am J Trop Med Hyg. 2007;77:69-78.
- [Google Scholar]
- National Vector Borne Disease Control Programme, Directorate General of Health Services, Government of India. Dengue/DHF situation in India 2018
- National Vector Borne Disease Control Programme, Directorate General of Health Services, Government of India. Clinically supected chikungunya fever cases since 2010 2018
- Ministry of Health & Family Welfare, Government of India. Home. Available from: https://nvbdcp.gov.in/
- Health finance indicators. Available from: http://www.cbhidghs.nic.in/WriteReadData/l892s/Chapter%204.pdf
- Economic burden of malaria in India: The need for effective spending. WHO South East Asia J Public Health. 2014;3:95-102.
- [Google Scholar]
- The economic burden of lymphatic filariasis in India. Parasitol Today. 2000;16:251-3.
- [Google Scholar]
- Household economic impact of an emerging disease in terms of catastrophic out-of-pocket health care expenditure and loss of productivity:Investigation of an outbreak of chikungunya in Orissa, India. J Vector Borne Dis. 2009;46:57-64.
- [Google Scholar]
- Cost of delivering health care services in public sector primary and community health centres in North India. PLoS One. 2016;11:e0160986.
- [Google Scholar]
- Cost of delivering child health care through community level health workers:How much extra does IMNCI program cost?J Trop Pediatr . . 2013;59:489-95.
- [Google Scholar]
- National Health Mission. Ministry of Health and Family Welfare, Government of India. National strategic malaria elimination in India 2017-2022 2016
- Cost effectiveness modelling for health technology assessment. Basel: Springer; 2015.
- World Health Organization. Making choices in health: WHO guide to cost-effectiveness analysis 2013
- Methods for the economic evaluation of health care programmes (2nd ed). Oxford: Oxford Medical Publications; 1997.
- Programme costs in the economic evaluation of health interventions. Cost Eff Resour Alloc. 2003;1:1.
- [Google Scholar]
- Economic analysis of delivering primary health care services through community health workers in 3 North Indian states. PLoS One. 2014;9:e91781.
- [Google Scholar]
- National Health Systems Resource Centre. National health accounts estimates for India (2015-16). New Delhi: Ministry of Health and Family Welfare, Government of India; 2018.
- Disease Control Priorities:Improving health and reducing poverty. Lancet. 2018;391:e11-4.
- [Google Scholar]
- National Vector Borne disease Control Programme. Directorate General of Health Services. Ministry of Health and Family Welfare, Government of India. National framework for malaria elimination in India (2016–2030) 2016
- Cost of neonatal intensive care delivered through district level public hospitals in India. Indian Pediatr. 2013;50:839-46.
- [Google Scholar]
- Economic evaluation. New York: McGraw-Hill Education (UK); 2005.


